- Home
- :
- All Communities
- :
- Products
- :
- ArcGIS GeoEvent Server
- :
- ArcGIS GeoEvent Server Questions
- :
- How create symbology on stream layer
- Subscribe to RSS Feed
- Mark Topic as New
- Mark Topic as Read
- Float this Topic for Current User
- Bookmark
- Subscribe
- Mute
- Printer Friendly Page
How create symbology on stream layer
- Mark as New
- Bookmark
- Subscribe
- Mute
- Subscribe to RSS Feed
- Permalink
- Report Inappropriate Content
I want to create a map showing traffic lights and display the status of lights (green, yellow, red). To do this, I would use the stream layer.
1 - I want to know how to apply a layer symbology on a Stream layer
2- How can we keep only the last observation (I do not want the points are added on top of each other)
Thanx
- Mark as New
- Bookmark
- Subscribe
- Mute
- Subscribe to RSS Feed
- Permalink
- Report Inappropriate Content
Hello Sebastien -
On your first question, if you are using an ArcGIS.com web map to display feature data broadcast from a stream service, your only option is what we would refer to as "Single Symbol" symbology in ArcMap. You cannot configure a set of coded values - 0, 1, 2 for example - to display as "red", "yellow", and "green" dots. You could cheat, of course, and add your stream service to your web map three times, as three separate layers, then use a filter (configured on the stream layer) to display only items whose coded value is 0, 1, or 2. Then you could configure each layer's "Single Symbol" symbology to be either "red", "yellow", or "green" dots. (See my screenshot, attached)
On your second question, if you have a field tagged TRACK_ID in the GeoEvent Definition being used by the stream service output, existing graphics displayed by a web map's stream layer will be updated as event data is broadcast by the stream service (vs. new graphics created for each event). However, the cheat above, where you display the "red", "yellow", and "green" as separate stream layers defeats the TRACK_ID updating because each layer will update its graphic, but the old signal value is still displayed by the other layer.
I think your combination of requirements, to have control of your stream layer symbology to create unique value rendering and to not display graphics overtop of one another, you are going to have to use the JavaScript API and develop your own web mapping application.
Hope this information helps -
RJ
- Mark as New
- Bookmark
- Subscribe
- Mute
- Subscribe to RSS Feed
- Permalink
- Report Inappropriate Content
Sebastien,
I agree with RJ that creating a custom application using the JavaScript API is the best way to accomplish all of the requirements. A sample that shows how to create a unique value renderer can be found at Unique value renderer | ArcGIS API for JavaScript. The sample uses a Feature Layer, but applying the renderer to a Stream Layer is the same.
The number of graphics displayed per TrackId is controlled by the "maximumTrackPoints" property of the Stream Layer. The default value is 1, meaning that when a new message is received by the Stream Layer, if there is an existing graphic with the same TrackId field value, the existing graphic is removed and a new graphic is added.
The Stream Layer uses the "trackIdField" property of a Stream Service to determine which message attribute contains the TrackId value. If your Stream Service does not specify a field to use for the TrackId, then the field name can be specified in the Stream Layer constructor. For example:
var layer = new StreamLayer(streamLayerUrl, {
trackIdField: "fieldName"
});
--James Cardona
- Mark as New
- Bookmark
- Subscribe
- Mute
- Subscribe to RSS Feed
- Permalink
- Report Inappropriate Content
Thank you for your good advice, unfortunately we will have to develop and without integration into arcgis online it will be difficult to integrate the layer in operation dashboard .
I have another question, if each lights does not return the coordinates (lat-long) how i can associate the track_ID to a coordinate stored in an external table ?
- Mark as New
- Bookmark
- Subscribe
- Mute
- Subscribe to RSS Feed
- Permalink
- Report Inappropriate Content
Sebastien,
When you publish a Stream Service you can specify an ArcGIS Server service layer that contains related features. The use case that this addresses is where the geographic location of your data does not change, but data attributes change. It sounds like your traffic light data works like this.
To publish a Stream Service that references a map/feature service containing location data, you specify the url to the map or feature service layer in the "Related Features" text box of the "Publish Stream Service" dialog. The image below shows using the first layer of a map service named Gages:
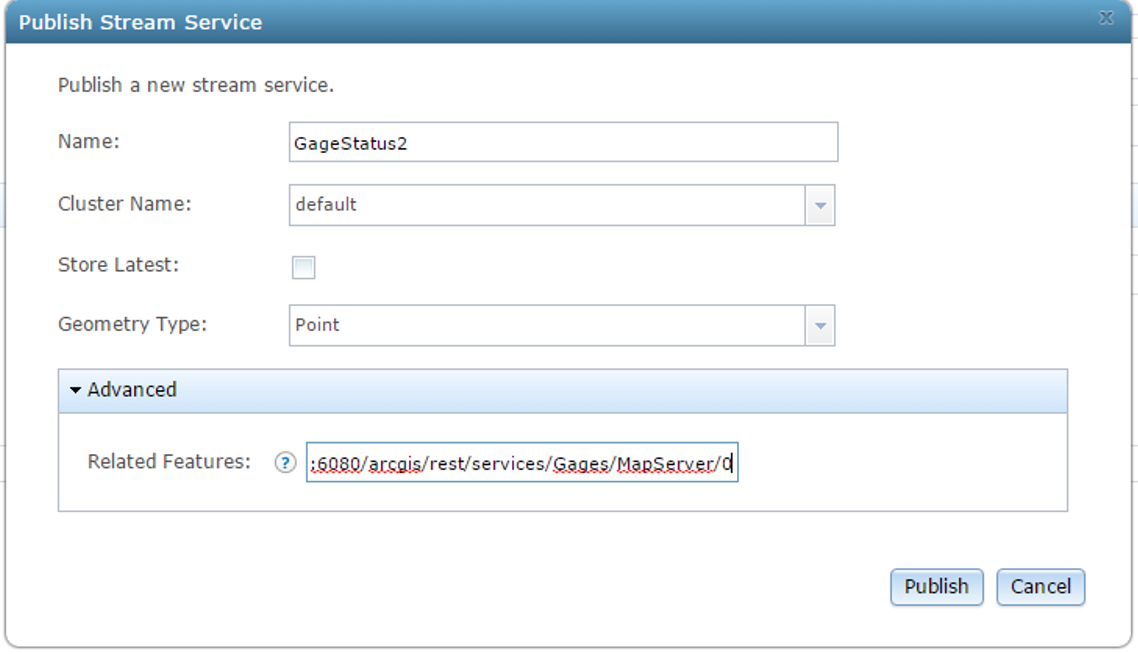
When the JavaScript API Stream Layer is added to a map, it will first query the "Related Features" url to get the locations of the data. Then when a message is received from the stream service, it finds the feature that has the same Track_ID as the incoming message and updates the attributes of the existing feature with the attributes contained in the new message. To use the related features capability, the Track_ID field of the Geoevent Definition must have the same name as the field in the Map/Feature Service layer. For instance if your traffic light location data has a field named Light_ID, then messages that are coming from your stream service must also contain a field named Light_ID.
--James Cardona
- Mark as New
- Bookmark
- Subscribe
- Mute
- Subscribe to RSS Feed
- Permalink
- Report Inappropriate Content
Is this still the same case today? We still can't set the marker or symbol based on attributes from the stream service? We have a stream service set up for trucks in the field for inspectors and want to see the heading set the symbol rotation to show direction and the color of the symbol to show the TYPE attribute (Inspector vs Service Call). As of now they are all just blue dots. Is there really no way to set this on the server side somewhere? Or do we have to create custom javascript code to run on our client web maps that sets the renderer on the fly? Is it even possible to use a UniqueValueRenderer in Javascript for stream service layers?
- Mark as New
- Bookmark
- Subscribe
- Mute
- Subscribe to RSS Feed
- Permalink
- Report Inappropriate Content
Hello Josh -
That is correct. The Portal and ArcGIS Online implementations of the JavaScript API's StreamLayer have not changed.
You can use the web map interface to change the stream layer's point symbology to apply a different fill or outline color, you can select a symbol from any of the provided Categories ('Shapes', 'Outdoor Recreation', 'Transportation', etc.) or browse to select a PNG, GIF, or JPG image from your local server to use as a simple marker symbol. You cannot use an attribute from the feature record broadcast by the stream service to apply unique value rendering in order to symbolize 'Inspection' vehicles differently from 'Service' vehicles. You would have to either filter server-side to have a stream service broadcast only 'Inspection' vehicle records, and add that stream service to your web map as a stream layer ... or filter client-side and have the web map specify to the stream service that is only wanted to receive feature records whose TYPE attribute was 'Inspection'.
There is no way to set symbology server-side. The feature records broadcast by a stream service do not include any symbology information. (If you examine the drawingInfo property in a stream service's JSON specification you will notice that there are some default properties for symbology. The web map uses this when the stream layer is first added to the map, which is why you see the default blue esriSMSCircle symbols.)
James provided a link to samples within the 3.23 release of the JavaScript API for creating a unique value renderer: Unique value renderer | ArcGIS API for JavaScript
I don't believe that you can extend the out-of-the-box Portal or ArcGIS Online StreamLayer implementations. You would have to develop your own custom web mapping application which implements capabilities exposed by the JavaScript API's StreamLayer class which Portal and ArcGIS Online web maps do not implement. Folks on the ArcGIS API for JavaScript can provide advice on how to do this.
- RJ
- Mark as New
- Bookmark
- Subscribe
- Mute
- Subscribe to RSS Feed
- Permalink
- Report Inappropriate Content
Hi RJ
Do you think creating a different stream layer for each type and show it in different symbol is a good idea?
In the original question create stream for red, anther one for yellow and other for green. Then filter each stream by the value to get only the correct features.
Is it reasonable if you have 5-10 types (like car types)?
Thanks
Mody
- Mark as New
- Bookmark
- Subscribe
- Mute
- Subscribe to RSS Feed
- Permalink
- Report Inappropriate Content
There should be no need to have the same service more than once. Just create separate UniqueValueInfos for each car type so they each get a different color symbol. So the one stream service would then have different symbols for each feature based on the value in one, two, or even three fields.
- Mark as New
- Bookmark
- Subscribe
- Mute
- Subscribe to RSS Feed
- Permalink
- Report Inappropriate Content
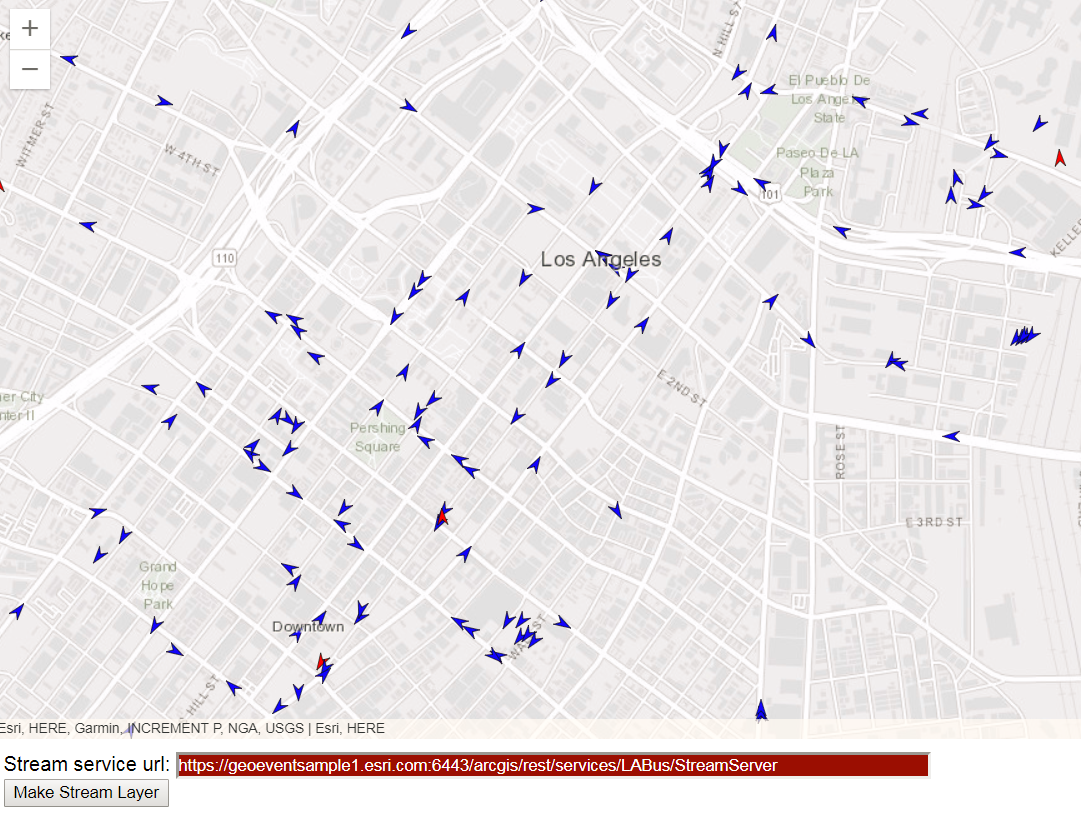
We got it working last night. Here's a snippet and a screen shot. We can change out the "symbol" property under each UniqueValueInfos object between "blue" for the simple marker and "blueSym" for the picture marker (and red/redSym). This is using the sandbox example page so we just put our prototype code directly in the addStreamLayer() function. We also had to make sure to reference the 4.6 javascript API at the top. ArcGIS API for JavaScript Sandbox You may also need to make sure to import all the correct modules at the top of the "require([" portion. You'll also need to fix the URLs for the picture marker symbols to point to your server.
function addStreamLayer() {
//Renderer
var blueArrow = "http://yourserver/navigationArrow.png";
var redArrow = "http://yourserver/redArrow.jpg";
var defaultPic = "https://yourserver/Xmark.png";
var blueSym = new PictureMarkerSymbol({
url: blueArrow,
width: 10,
height: 10
});
var redSym = new PictureMarkerSymbol({
url: redArrow,
width: 10,
height: 10
});
var defSymbol = new PictureMarkerSymbol({
url: defaultPic,
width: 10,
height: 10
});
var blue = {
type: "simple-marker", // autocasts as new SimpleMarkerSymbol()
color: "blue",
path: "M14.5,29 23.5,0 14.5,9 5.5,0z",
angle: 180,
size: 10
};
var red = {
type: "simple-marker", // autocasts as new SimpleMarkerSymbol()
color: "red",
path: "M14.5,29 23.5,0 14.5,9 5.5,0z",
angle: 180,
size: 10
};
//create renderer
var uvr2 = {
type: "unique-value",
field: "predictable",
defaultSymbol: { type: "simple-fill"},
uniqueValueInfos: [{
value: "true", //predictable field is a string type
symbol: blue,
label: "Predictable" // used in the legend to describe features with this symbol
}, {
value: "false",
symbol: red,
label: "Not Predictable" // used in the legend to describe features with this symbol
}],
visualVariables: [{
type: "rotation",
field: "heading",
rotationType: "geographic"
}]
};
var svcUrl = "https://geoeventsample1.esri.com:6443/arcgis/rest/services/LABus/StreamServer";
// Construct Stream Layer
streamLayer = new StreamLayer({
url: svcUrl,
renderer: uvr2,
purgeOptions: {
displayCount: 10000
}
});
// When graphics controller created, register listeners for events
streamLayer.on("graphics-controller-create", function(evt) {
controller = evt.graphicsController;
// Connect and disconnect events
controller.on("connect", processConnect);
controller.on("disconnect", processDisconnect);
// FilterChange event
controller.on("filter-change", processFilterChange);
});
map.add(streamLayer);
}