Turn on suggestions
Auto-suggest helps you quickly narrow down your search results by suggesting possible matches as you type.
Cancel
- Home
- :
- All Communities
- :
- Products
- :
- ArcGIS Spatial Analyst
- :
- ArcGIS Spatial Analyst Questions
- :
- Classify Raster by Contour
Options
- Subscribe to RSS Feed
- Mark Topic as New
- Mark Topic as Read
- Float this Topic for Current User
- Bookmark
- Subscribe
- Mute
- Printer Friendly Page
Classify Raster by Contour
Subscribe
2723
8
11-09-2010 12:11 PM
11-09-2010
12:11 PM
- Mark as New
- Bookmark
- Subscribe
- Mute
- Subscribe to RSS Feed
- Permalink
- Report Inappropriate Content
Hi,
I have many rasters comprising a sizable study area. I would like to color code each raster by the value of the highest contour that runs through each raster.
I'm doing some flood modeling and I have various water heights to try in order to flood each raster. The contours are the natural barriers. If flood waters rise 2meters, will this raster flood completely?
If anyone has any thoughts on how to classify each tile by the highest contour that runs through it, I would be much obliged.
-Thanks
8 Replies
11-09-2010
01:25 PM
- Mark as New
- Bookmark
- Subscribe
- Mute
- Subscribe to RSS Feed
- Permalink
- Report Inappropriate Content
http://help.arcgis.com/en/arcgisdesktop/10.0/help/index.html#//009z000000w7000000.htm
for version 10 using the maximum option, however, every raster will be the zone and your contours will have to be grids if memory serves...a bit of a pain but check this out first and perhaps reformulate in light of this
for version 10 using the maximum option, however, every raster will be the zone and your contours will have to be grids if memory serves...a bit of a pain but check this out first and perhaps reformulate in light of this
11-11-2010
05:01 AM
- Mark as New
- Bookmark
- Subscribe
- Mute
- Subscribe to RSS Feed
- Permalink
- Report Inappropriate Content
Hi Dan,
I have a couple of different posts going right now and missed your response.
I'm not exactly clear on how this would work. I would have to generate contours from each of my DEMs, convert those contours to Rasters, but wouldn't this just tell me what the highest contour in each of my areas is? I need the highest contour that completely crosses my rasters. My rasters are 100m wide... I suppose I could look to find a way to select only contours that run 100m? No. Contours are irregularly shaped and a hill with a circumference of 100m should not be classed as a barrier for my purposes.
Thanks for your advice, am I missing something here? I'm open to all ideas.
Thanks,
Richard
http://help.arcgis.com/en/arcgisdesktop/10.0/help/index.html#//009z000000w7000000.htm
for version 10 using the maximum option, however, every raster will be the zone and your contours will have to be grids if memory serves...a bit of a pain but check this out first and perhaps reformulate in light of this
11-11-2010
01:02 PM
- Mark as New
- Bookmark
- Subscribe
- Mute
- Subscribe to RSS Feed
- Permalink
- Report Inappropriate Content
obviously not seeing the picture here...why are the rasters separated
rather than merged together?
... I need the highest contour that completely crosses my rasters...
rather than merged together?
11-12-2010
04:10 AM
- Mark as New
- Bookmark
- Subscribe
- Mute
- Subscribe to RSS Feed
- Permalink
- Report Inappropriate Content
What I have is Lidar coverage along a section of beach 76km long. I'm trying to show the probability of areas behind the beach flooding as sea levels rise. The Dunes are the barriers to flooding. I have several models that show various rates of sealevel rise over time.
My goal is to show the probability of inundation along beach segments 100m wide. If I wanted to show a flood of the whole beach I would keep the Raster as one unit. But I'm interested in what areas have the greatest probability of flooding first. I figure that by breaking the beach up into my 100m study areas and then taking the maximum contour line that stretches all the way across that section I would then be able to say "here we see that sealevel would have to reach X meters before this portion floods. My model does not take into account the fact that once water breaches at one point, it will fill all the lower regions behind the beach, but it doesn't have to. I'm looking for the weak points. So being able to isolate the highest continuous elevation across a 100m section is key.
I've played with converting my sections to polygons and then querying the polygons that intersect with specific contours, but that still does not give me only contours that run 100% across my 100m sections.
So yeah... I have broken my swaths into 10m subsections and have removed all small contours with the intent of reducing error. But I figure there has to be a way to do this that doesn't involve fudging regions and accepting too many errors.
11-12-2010
04:44 AM
- Mark as New
- Bookmark
- Subscribe
- Mute
- Subscribe to RSS Feed
- Permalink
- Report Inappropriate Content
I suppose I could be thinking about this from the wrong direction.
I'm interested in breaching points along the shore broken by my 100m sections. Instead of searching for barriers, I should be searching for the lowest continuous path north to south along each section. But since this is a shoreline, I can't start with one point and do a cost/distance analysis.
I'm interested in breaching points along the shore broken by my 100m sections. Instead of searching for barriers, I should be searching for the lowest continuous path north to south along each section. But since this is a shoreline, I can't start with one point and do a cost/distance analysis.
04-14-2016
01:59 PM
- Mark as New
- Bookmark
- Subscribe
- Mute
- Subscribe to RSS Feed
- Permalink
- Report Inappropriate Content
I am actually working on a project similar to this in respect to the needing to query the lowest "high" point on a ring levee.
Was this post ever solved?
04-14-2016
02:35 PM
- Mark as New
- Bookmark
- Subscribe
- Mute
- Subscribe to RSS Feed
- Permalink
- Report Inappropriate Content
You should be able to get to this using the Fill tool.
Hillshade Before:
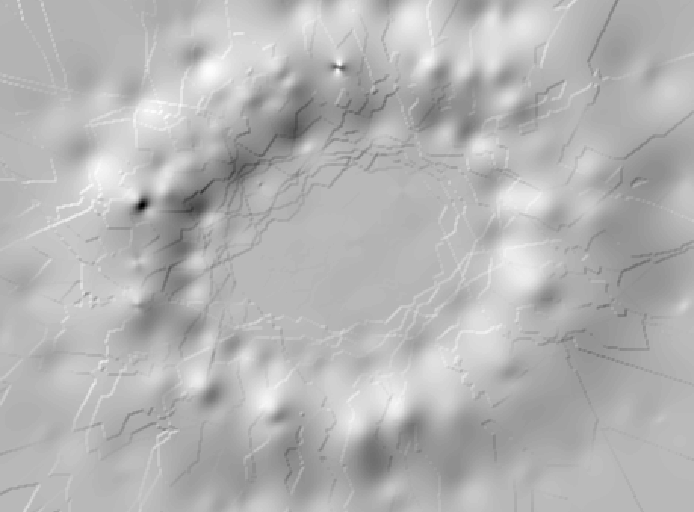
Hillshade After Fill:
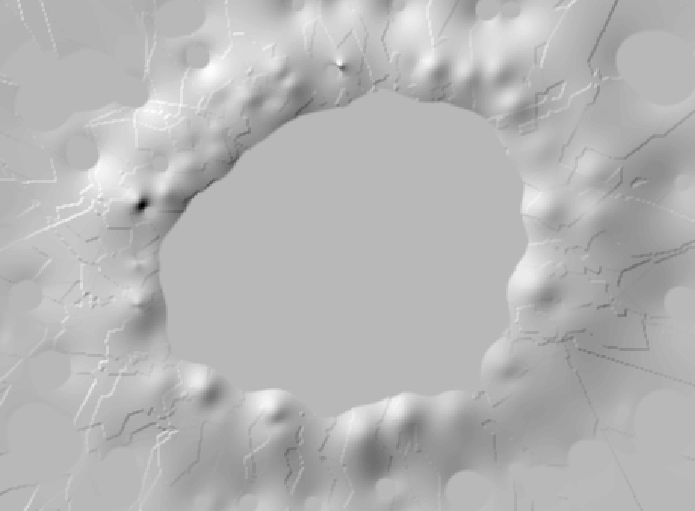
The values inside the filled sink are the elevation of the lowest point of the levee.
04-14-2016
03:03 PM
- Mark as New
- Bookmark
- Subscribe
- Mute
- Subscribe to RSS Feed
- Permalink
- Report Inappropriate Content
Similarly, for the original poster, Fill can do the job with an extra step of creating a bathub boundary around the raster and artificially altering the original DEM using the Con tool:
Before Fill tool (ocean on right):
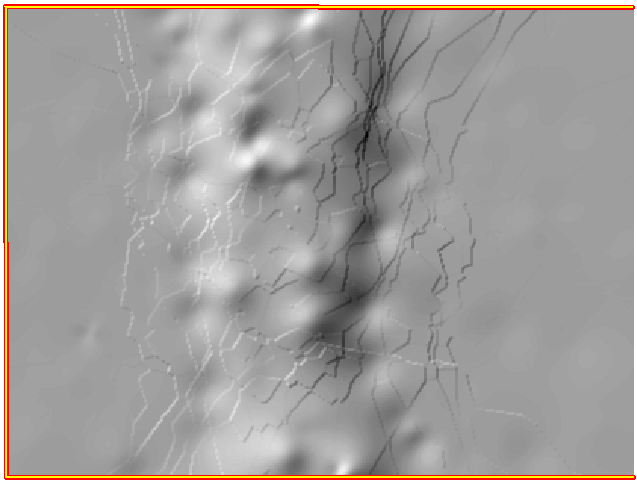
After Fill tool:
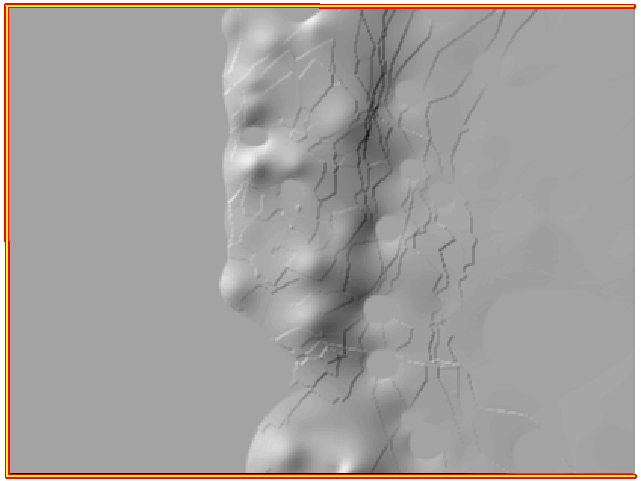
Values behind the barrier are the lowest crossing point on the barrier.