- Home
- :
- All Communities
- :
- User Groups
- :
- New to GIS
- :
- Questions
- :
- Education... keep striving.... New to GIS? GRACE?
- Subscribe to RSS Feed
- Mark Topic as New
- Mark Topic as Read
- Float this Topic for Current User
- Bookmark
- Subscribe
- Mute
- Printer Friendly Page
Education... keep striving.... New to GIS? GRACE?
- Mark as New
- Bookmark
- Subscribe
- Mute
- Subscribe to RSS Feed
- Permalink
- Report Inappropriate Content
Since I am not a member of the GRACE group...
This thread on ... points/levels... I found interesting and amusing... I omitting the steak level, have a look
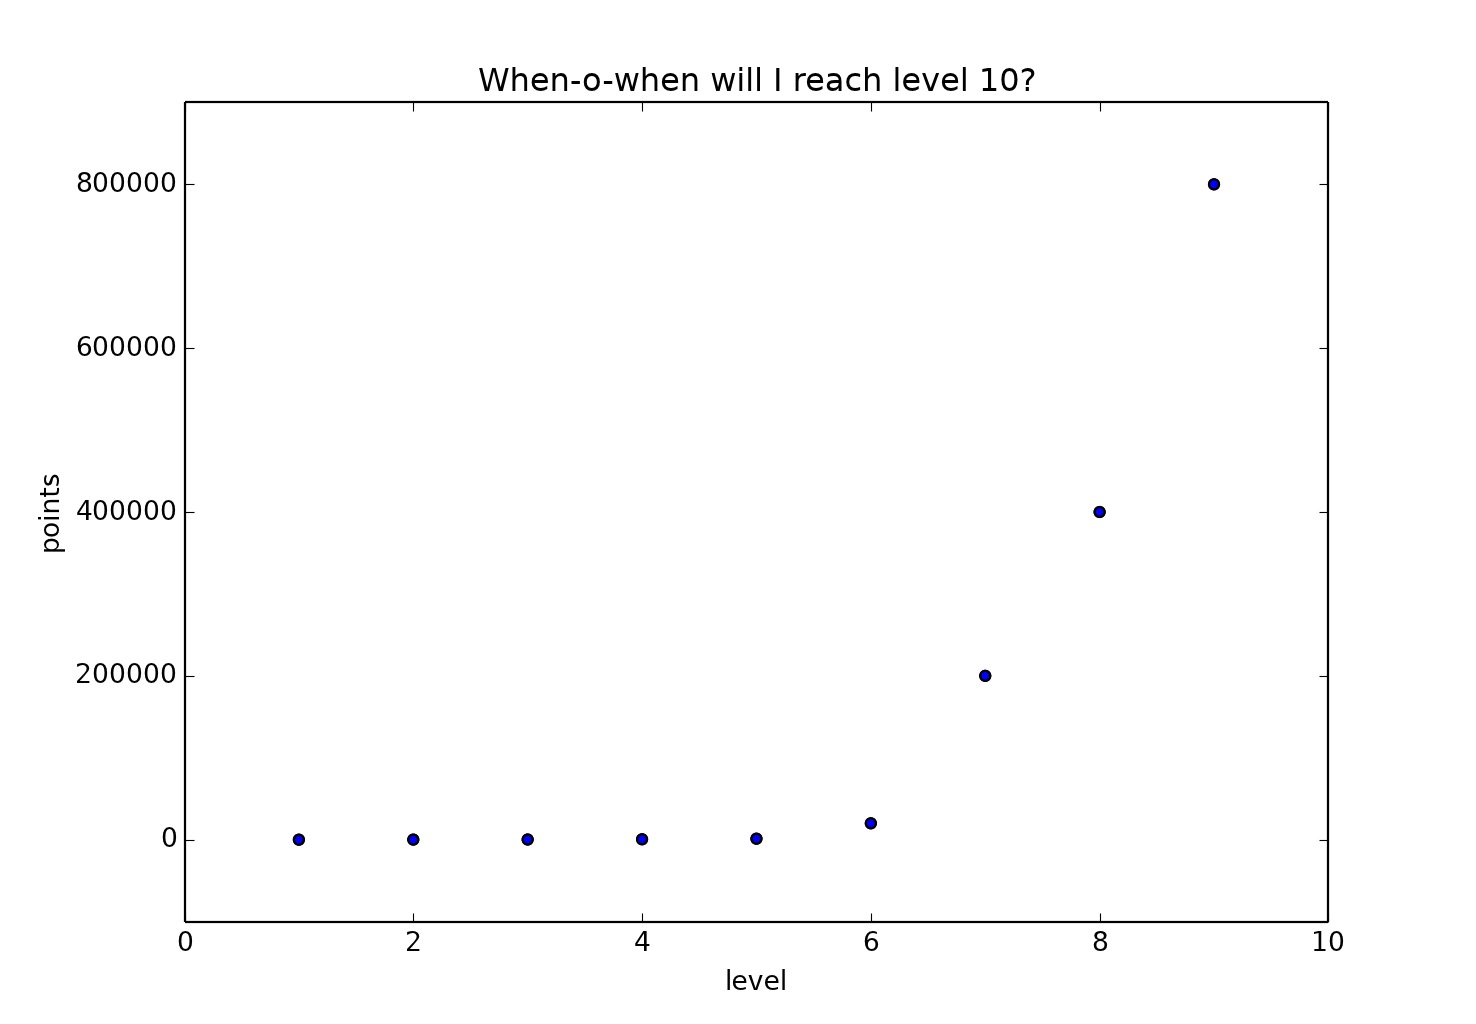
now the code to go with it...to help in the level ascent..
import matplotlib.pyplot as plt
import numpy
levels = [1,2,3,4,5,6,7,8,9]
values = [0,100,200,500,1200,20000,200000,400000,800000]
plt.scatter(levels,values)
plt.title("When-o-when will I reach level 10?")
plt.xlabel("level")
plt.ylabel("points")
plt.show()
Your assignment...
- produce a semi-log plot, fixing the original values list replace 0 with 1
- and add a second Y axis to represent time... assume it takes 1 year to reach level 6
- what is the relationship between level and points (express in statistical terms)?
- how can the script be improved?
- what documentation would you provide to a viewer?
- what impacts would viewing this graph have upon someone's desire to reach the top?
- have some fun and discuss what you find
Keep striving ....

- Mark as New
- Bookmark
- Subscribe
- Mute
- Subscribe to RSS Feed
- Permalink
- Report Inappropriate Content
What a fun question, Dan!
I don't have graphing capabilities on this computer, but I would imagine the level/point relationship will appear linear using a logarithmic scale on the Y-axis. As it is, it looks exponential.
Assuming it will take 1.6 million points to reach level 10, it makes me wonder if one could even turn it up to 11. At the rate you suggest, it would take 40 years to reach level 9. It certainly doesn't seem obtainable in my lifetime.
I wonder why they made the first few levels so closely spaced, and the rest so distant? I guess one could think of level 6 as the "weed-out" level. I suppose that makes you a rare plant. 