- Home
- :
- All Communities
- :
- Developers
- :
- JavaScript Maps SDK
- :
- JavaScript Maps SDK Questions
- :
- Create polyline which crosses international date l...
- Subscribe to RSS Feed
- Mark Topic as New
- Mark Topic as Read
- Float this Topic for Current User
- Bookmark
- Subscribe
- Mute
- Printer Friendly Page
Create polyline which crosses international date line
- Mark as New
- Bookmark
- Subscribe
- Mute
- Subscribe to RSS Feed
- Permalink
- Report Inappropriate Content
Hello.
I am working with the 3.12 version of the JavaScript API, and my map is using WMAS as the spatial reference.
When i use the Draw toolbar to create a polyline from San Francisco to Sydney, AU, the line is drawn such that it crosses the international date line. However, when i programmatically create a polyline that uses coordinates created by converting Lat.Lon to WMAS with the web mercator utilities, the line does not cross the international time. Instead, it goes off in an Eastward direction to get to Sydney. No matter how many points i put between San Francisco and Sydney, the line always approaches the international date line, then heads eastward all the way around the globe to Sydney.
When i compare the 'paths' of the line created by the Draw toolbar and the polyline i created by programmtically adding points, i see that locations like Sydney have different values for X and Y. Two different coordinate sets represent the same place on Earth, even though both coordinate pairs are using the same Spatial Reference
My question is, I suppose, how do i convert values generated by the web mercator utilities into values that will cross the international date line? In other words, how can i get the same values as those created by the draw toolbar?
Thank you.
Coords for approximately Sydney when the point is created by the Draw Toolbar
[ -23223191, -4049281]
Coords for approximately Sydney when the point is created by converting from Lat/Lon using the web mercator utilities
[16832553, -4010018]
Both pairs have spatial reference:
{ "wkid": 102100, "latestWkid": 3857}
Solved! Go to Solution.
Accepted Solutions
- Mark as New
- Bookmark
- Subscribe
- Mute
- Subscribe to RSS Feed
- Permalink
- Report Inappropriate Content
For this particular use case, you'll have to make sure you densify the line as you only have 4 points. Since the Polyline SR is 4326, you can call geodesicUtils.geodesicDensify instead of normalizeUtils.normalizeCentralMeridian.
- Mark as New
- Bookmark
- Subscribe
- Mute
- Subscribe to RSS Feed
- Permalink
- Report Inappropriate Content
Thomas,
Have you looked into the normalizeUtils?
esri/geometry/normalizeUtils | API Reference | ArcGIS API for JavaScript
- Mark as New
- Bookmark
- Subscribe
- Mute
- Subscribe to RSS Feed
- Permalink
- Report Inappropriate Content
Hey Robert.
I had not looked into the normalizeUtils before your message. But I have now, and it works like magic.
Thank you
- Mark as New
- Bookmark
- Subscribe
- Mute
- Subscribe to RSS Feed
- Permalink
- Report Inappropriate Content
lHi Robert.
It seems that I was not thorough in my testing of the 'normalizeUtils' functionality. The line that i am trying to create still will not pass through the international date time zone. When i use my browser developer tools, i can't even see that a call is made to the geometry service. And when doing the step-thru debugging, there is no delay at all going to the '.then' function. If i add an error callback, that callback function is not invoked.
Any thoughts on what's going on, what i might be doing wrong, and how to get that line to cross the international date line?
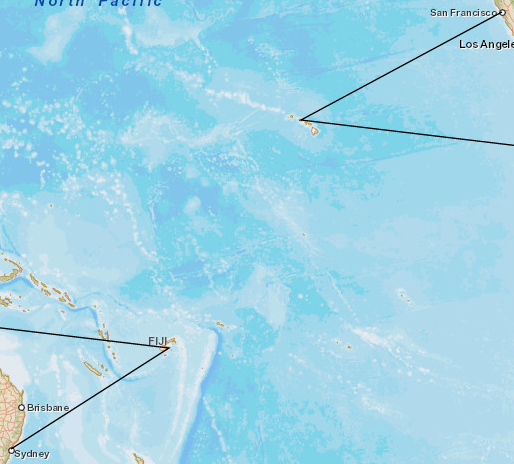
My code is below as is a snapshot of the resulting line.
Thank you.
var wmas = new SpatialReference({ "wkid": 102100, "latestWkid": 3857 });
var honolulu = new Point(webMercatorUtils.lngLatToXY(-157.8167, 21.3000), wmas);
var sanFran = new Point(webMercatorUtils.lngLatToXY(-122.4167, 37.7833), wmas);
var fiji = new Point(webMercatorUtils.lngLatToXY(179.0000, -18.0000), wmas);
var sydney = new Point(webMercatorUtils.lngLatToXY(151.2094, -33.8600), wmas);
var polyline = new Polyline([[sanFran.x, sanFran.y], [honolulu.x, honolulu.y], [fiji.x, fiji.y], [sydney.x, sydney.y]]);
polyline.setSpatialReference(wmas);
var lineSymbol = new SimpleLineSymbol();
var request = normalizeUtils.normalizeCentralMeridian([polyline], new GeometryService("http://utility.arcgisonline.com/ArcGIS/rest/services/Geometry/GeometryServer"));
request.then(function (geoms) {
var lineGraphic = new Graphic(geoms[0], lineSymbol);
map.graphics.add(lineGraphic);
});
- Mark as New
- Bookmark
- Subscribe
- Mute
- Subscribe to RSS Feed
- Permalink
- Report Inappropriate Content
Thomas,
I am not sure why this is not working. I have created a simple demo sample to outline the issue.
Maybe John Grayson or Kelly Hutchins shed some light on this. Clicking the "International Date Line" button in this sample shows the issue.
<!DOCTYPE html>
<html>
  <head>
    <meta http-equiv="Content-Type" content="text/html; charset=utf-8">

    <!--The viewport meta tag is used to improve the presentation and behavior of the samples
      on iOS devices-->
    <meta name="viewport" content="initial-scale=1, maximum-scale=1,user-scalable=no">
    <title>Shapes and Symbols</title>

    <link rel="stylesheet" href="http://js.arcgis.com/3.12/esri/css/esri.css">

    <style>
      #info {
        top: 20px;
        color: #444;
        height: auto;
        font-family: arial;
        right: 20px;
        margin: 5px;
        padding: 10px;
        position: absolute;
        width: 115px;
        z-index: 40;
        border: solid 2px #666;
        border-radius: 4px;
        background-color: #fff;
      }
      html, body, #mapDiv {
        padding:0;
        margin:0;
        height:100%;
      }
      button {
        display: block;
      }
    </style>

    <script src="http://js.arcgis.com/3.12/"></script>
    <script>
      var map, tb;

      require([
        "esri/map", "esri/toolbars/draw", "esri/geometry/normalizeUtils", "esri/tasks/GeometryService",
        "esri/symbols/SimpleMarkerSymbol", "esri/symbols/SimpleLineSymbol",
        "esri/symbols/PictureFillSymbol", "esri/symbols/CartographicLineSymbol",
        "esri/graphic", "esri/geometry/Polyline", "esri/SpatialReference", "esri/geometry/Point",
        "esri/geometry/webMercatorUtils", "esri/Color", "dojo/dom", "dojo/on", "dojo/domReady!"
      ], function(
        Map, Draw, normalizeUtils, GeometryService,
        SimpleMarkerSymbol, SimpleLineSymbol,
        PictureFillSymbol, CartographicLineSymbol,
        Graphic, Polyline, SpatialReference, Point,
        webMercatorUtils, Color, dom, on
      ) {
        map = new Map("mapDiv", {
          basemap: "streets",
          center: [-25.312, 34.307],
          zoom: 3
        });
        map.on("load", initToolbar);

        // markerSymbol is used for point and multipoint, see http://raphaeljs.com/icons/#talkq for more examples
        var markerSymbol = new SimpleMarkerSymbol();
        markerSymbol.setPath("M16,4.938c-7.732,0-14,4.701-14,10.5c0,1.981,0.741,3.833,2.016,5.414L2,25.272l5.613-1.44c2.339,1.316,5.237,2.106,8.387,2.106c7.732,0,14-4.701,14-10.5S23.732,4.938,16,4.938zM16.868,21.375h-1.969v-1.889h1.969V21.375zM16.772,18.094h-1.777l-0.176-8.083h2.113L16.772,18.094z");
        markerSymbol.setColor(new Color("#00FFFF"));

        // lineSymbol used for freehand polyline, polyline and line.
        var lineSymbol = new CartographicLineSymbol(
          CartographicLineSymbol.STYLE_SOLID,
          new Color([255,0,0]), 10,
          CartographicLineSymbol.CAP_ROUND,
          CartographicLineSymbol.JOIN_MITER, 5
        );

        // fill symbol used for extent, polygon and freehand polygon, use a picture fill symbol
        // the images folder contains additional fill images, other options: sand.png, swamp.png or stiple.png
        var fillSymbol = new PictureFillSymbol(
          "images/mangrove.png",
          new SimpleLineSymbol(
            SimpleLineSymbol.STYLE_SOLID,
            new Color('#000'),
            1
          ),
          42,
          42
        );

        function initToolbar() {
          tb = new Draw(map);
          tb.on("draw-end", addGraphic);

          // event delegation so a click handler is not
          // needed for each individual button
          on(dom.byId("info"), "click", function(evt) {
            if ( evt.target.id === "info" ) {
              return;
            }
            var tool = evt.target.id.toLowerCase();
            map.disableMapNavigation();

            if(tool === 'idl'){
//tried creating points in web mercator first but whether they are 102100 or 4326 the map know what to do with them
              var sr = new SpatialReference({ "wkid": 4326});
              var honolulu = new Point(-157.8167, 21.3000, sr);
              var sanFran = new Point(-122.4167, 37.7833, sr);
              var fiji = new Point(179.0000, -18.0000, sr);
              var sydney = new Point(151.2094, -33.8600, sr);
              var polyline = new Polyline(new SpatialReference({wkid:4326}));
//tried drawing east to west and west to east
              //polyline.addPath([sanFran, honolulu, fiji, sydney]);
              polyline.addPath([sydney, fiji, honolulu, sanFran]);

              var request = normalizeUtils.normalizeCentralMeridian([polyline], new GeometryService("http://utility.arcgisonline.com/ArcGIS/rest/services/Geometry/GeometryServer"),
                function(geoms){
//tried converting normaized geometry to web mercator before adding to the map
                  //var geom = webMercatorUtils.geographicToWebMercator(geoms[0]);
                  var lineGraphic = new Graphic(geoms[0], lineSymbol);
                  map.graphics.add(lineGraphic);
                  tb.deactivate();
                  map.enableMapNavigation();
                },
                function(error){
                  console.info(error);
                }
              );
              return;
            }
            tb.activate(tool);
          });
        }

        function addGraphic(evt) {
          //deactivate the toolbar and clear existing graphics
          tb.deactivate();
          map.enableMapNavigation();

          // figure out which symbol to use
          var symbol;
          if ( evt.geometry.type === "point" || evt.geometry.type === "multipoint") {
            symbol = markerSymbol;
          } else if ( evt.geometry.type === "line" || evt.geometry.type === "polyline") {
            symbol = lineSymbol;
          }
          else {
            symbol = fillSymbol;
          }

          map.graphics.add(new Graphic(evt.geometry, symbol));
        }
      });
    </script>
  </head>

  <body>

    <div id="info">
      <div>Select a shape then draw on map to add graphic</div>
      <button id="Point">Point</button>
      <button id="Multipoint">Multipoint</button>
      <button id="Line">Line</button>
      <button id="Polyline">Polyline</button>
      <button id="FreehandPolyline">Freehand Polyline</button>
      <button id="Triangle">Triangle</button>
      <button id="Extent">Rectangle</button>
      <button id="Circle">Circle</button>
      <button id="Ellipse">Ellipse</button>
      <button id="Polygon">Polygon</button>
      <button id="FreehandPolygon">Freehand Polygon</button>
      <button id="idl">International Date Line</button>
    </div>

    <div id="mapDiv"></div>

  </body>
</html>
- Mark as New
- Bookmark
- Subscribe
- Mute
- Subscribe to RSS Feed
- Permalink
- Report Inappropriate Content
For this particular use case, you'll have to make sure you densify the line as you only have 4 points. Since the Polyline SR is 4326, you can call geodesicUtils.geodesicDensify instead of normalizeUtils.normalizeCentralMeridian.
- Mark as New
- Bookmark
- Subscribe
- Mute
- Subscribe to RSS Feed
- Permalink
- Report Inappropriate Content
Hi John.
You are correct. If i densify the line with a high enough value for maxSegmentLengh, the line is drawn across the International date line without the need to make a call out to the Geometry Server.
Thank you.