- Home
- :
- All Communities
- :
- Products
- :
- ArcGIS GeoStatistical Analyst
- :
- ArcGIS GeoStatistical Analyst Questions
- :
- geostatistical analyst-kriging
- Subscribe to RSS Feed
- Mark Topic as New
- Mark Topic as Read
- Float this Topic for Current User
- Bookmark
- Subscribe
- Mute
- Printer Friendly Page
geostatistical analyst-kriging
- Mark as New
- Bookmark
- Subscribe
- Mute
- Subscribe to RSS Feed
- Permalink
- Report Inappropriate Content
Hi all,
I am using IDW and Kriging in ArcGIS to explore the distribution of forest carbon stock using 183 ground sample points. The data is not normal and there is trend, so I have transformed the data. However after running kriging, the cross-validation result shows root mean square standardized: 0.98, root mean square and average standardized error: 127.7 and 128.89 respectively and the main problem is the predicted and error plot is not 1:1. Can anyone please suggest what can be the issue and how can I address this. Any helpful suggestions will be highly appreciated.
Thanks in advance!
- Mark as New
- Bookmark
- Subscribe
- Mute
- Subscribe to RSS Feed
- Permalink
- Report Inappropriate Content
Ok they are the numbers...what is the area like from a qualitative perspective?
- Mark as New
- Bookmark
- Subscribe
- Mute
- Subscribe to RSS Feed
- Permalink
- Report Inappropriate Content
Dan thank you for the reply
Yes the sample points are numbers, the study area is watershed of about 8000 ha, and with wide elevation range from low mid 200 to high 1900 m. The main landuse in this area are forest and agriculture, there are some agricultural patches in between the forest area where there is no sample points.
- Mark as New
- Bookmark
- Subscribe
- Mute
- Subscribe to RSS Feed
- Permalink
- Report Inappropriate Content
Before getting into the spatial interpolation methods, did inferential tests between landscapes yield any valuable information? Had you considered partitioning the landscape into discrete areas prior to kriging? since I am not sure why you would do that if there are inherent differences in the landscape to begin with (ie forest vs agri. low vs high elevations). I am just trying to get a sense why kriging is being applied to the whole area?
- Mark as New
- Bookmark
- Subscribe
- Mute
- Subscribe to RSS Feed
- Permalink
- Report Inappropriate Content
Yes i have thought of partitioning but in certain region there are not enough sample points. I am trying to look at the spatial distribution of forest carbon in whole watershed, so I thought of using kriging in whole area, and also based on some literature review. I couldn't think of any other method, any suggestion!
- Mark as New
- Bookmark
- Subscribe
- Mute
- Subscribe to RSS Feed
- Permalink
- Report Inappropriate Content
Julia...a lack of data points in one area isn't a reason to include it in the whole area...that fact alone may be masking the true result... in otherwords, including that area may make matters worse.. If you have true barriers in the terrain, consider spline with barriers for a quick look. Partition into different areas and do your kriging...do some inferential tests of difference/association on your raw data partitioned off into different areas divided by cover type and elevation class. I guess my big recommendation is don't throw all your efforts into one test/procedure then wonder why things aren't working out as perceived. There may be many reasons for results for a large area may not yield the same results when the area is partitioned. Good luck
- Mark as New
- Bookmark
- Subscribe
- Mute
- Subscribe to RSS Feed
- Permalink
- Report Inappropriate Content
Thank you very much Dan! I will explore other options including partitioning, hope that will get better result. Again thanks!
- Mark as New
- Bookmark
- Subscribe
- Mute
- Subscribe to RSS Feed
- Permalink
- Report Inappropriate Content
Julia
Are you using 10.1 or later, if so then look at Emperical Bayesian Kriging
Also, could you include a screenshot of the semivariogram that you are using.
-Steve
- Mark as New
- Bookmark
- Subscribe
- Mute
- Subscribe to RSS Feed
- Permalink
- Report Inappropriate Content
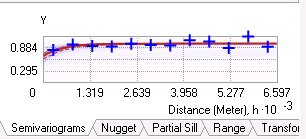
Steve,
I am using 10 but recently also trying EBK in 10.1. I have attached the screenshot of the semivariogram from EBK after transformation.
- Mark as New
- Bookmark
- Subscribe
- Mute
- Subscribe to RSS Feed
- Permalink
- Report Inappropriate Content
Julia
That is great, what parameters are you using?
I.e what transformation, which model, what subset size, etc.
-Steve