- Home
- :
- All Communities
- :
- Developers
- :
- Python
- :
- Python Questions
- :
- 2 arcpy.mapping issues: Add.Colormap_management & ...
- Subscribe to RSS Feed
- Mark Topic as New
- Mark Topic as Read
- Float this Topic for Current User
- Bookmark
- Subscribe
- Mute
- Printer Friendly Page
2 arcpy.mapping issues: Add.Colormap_management & data not changing
- Mark as New
- Bookmark
- Subscribe
- Mute
- Subscribe to RSS Feed
- Permalink
- Report Inappropriate Content
Hello everybody,
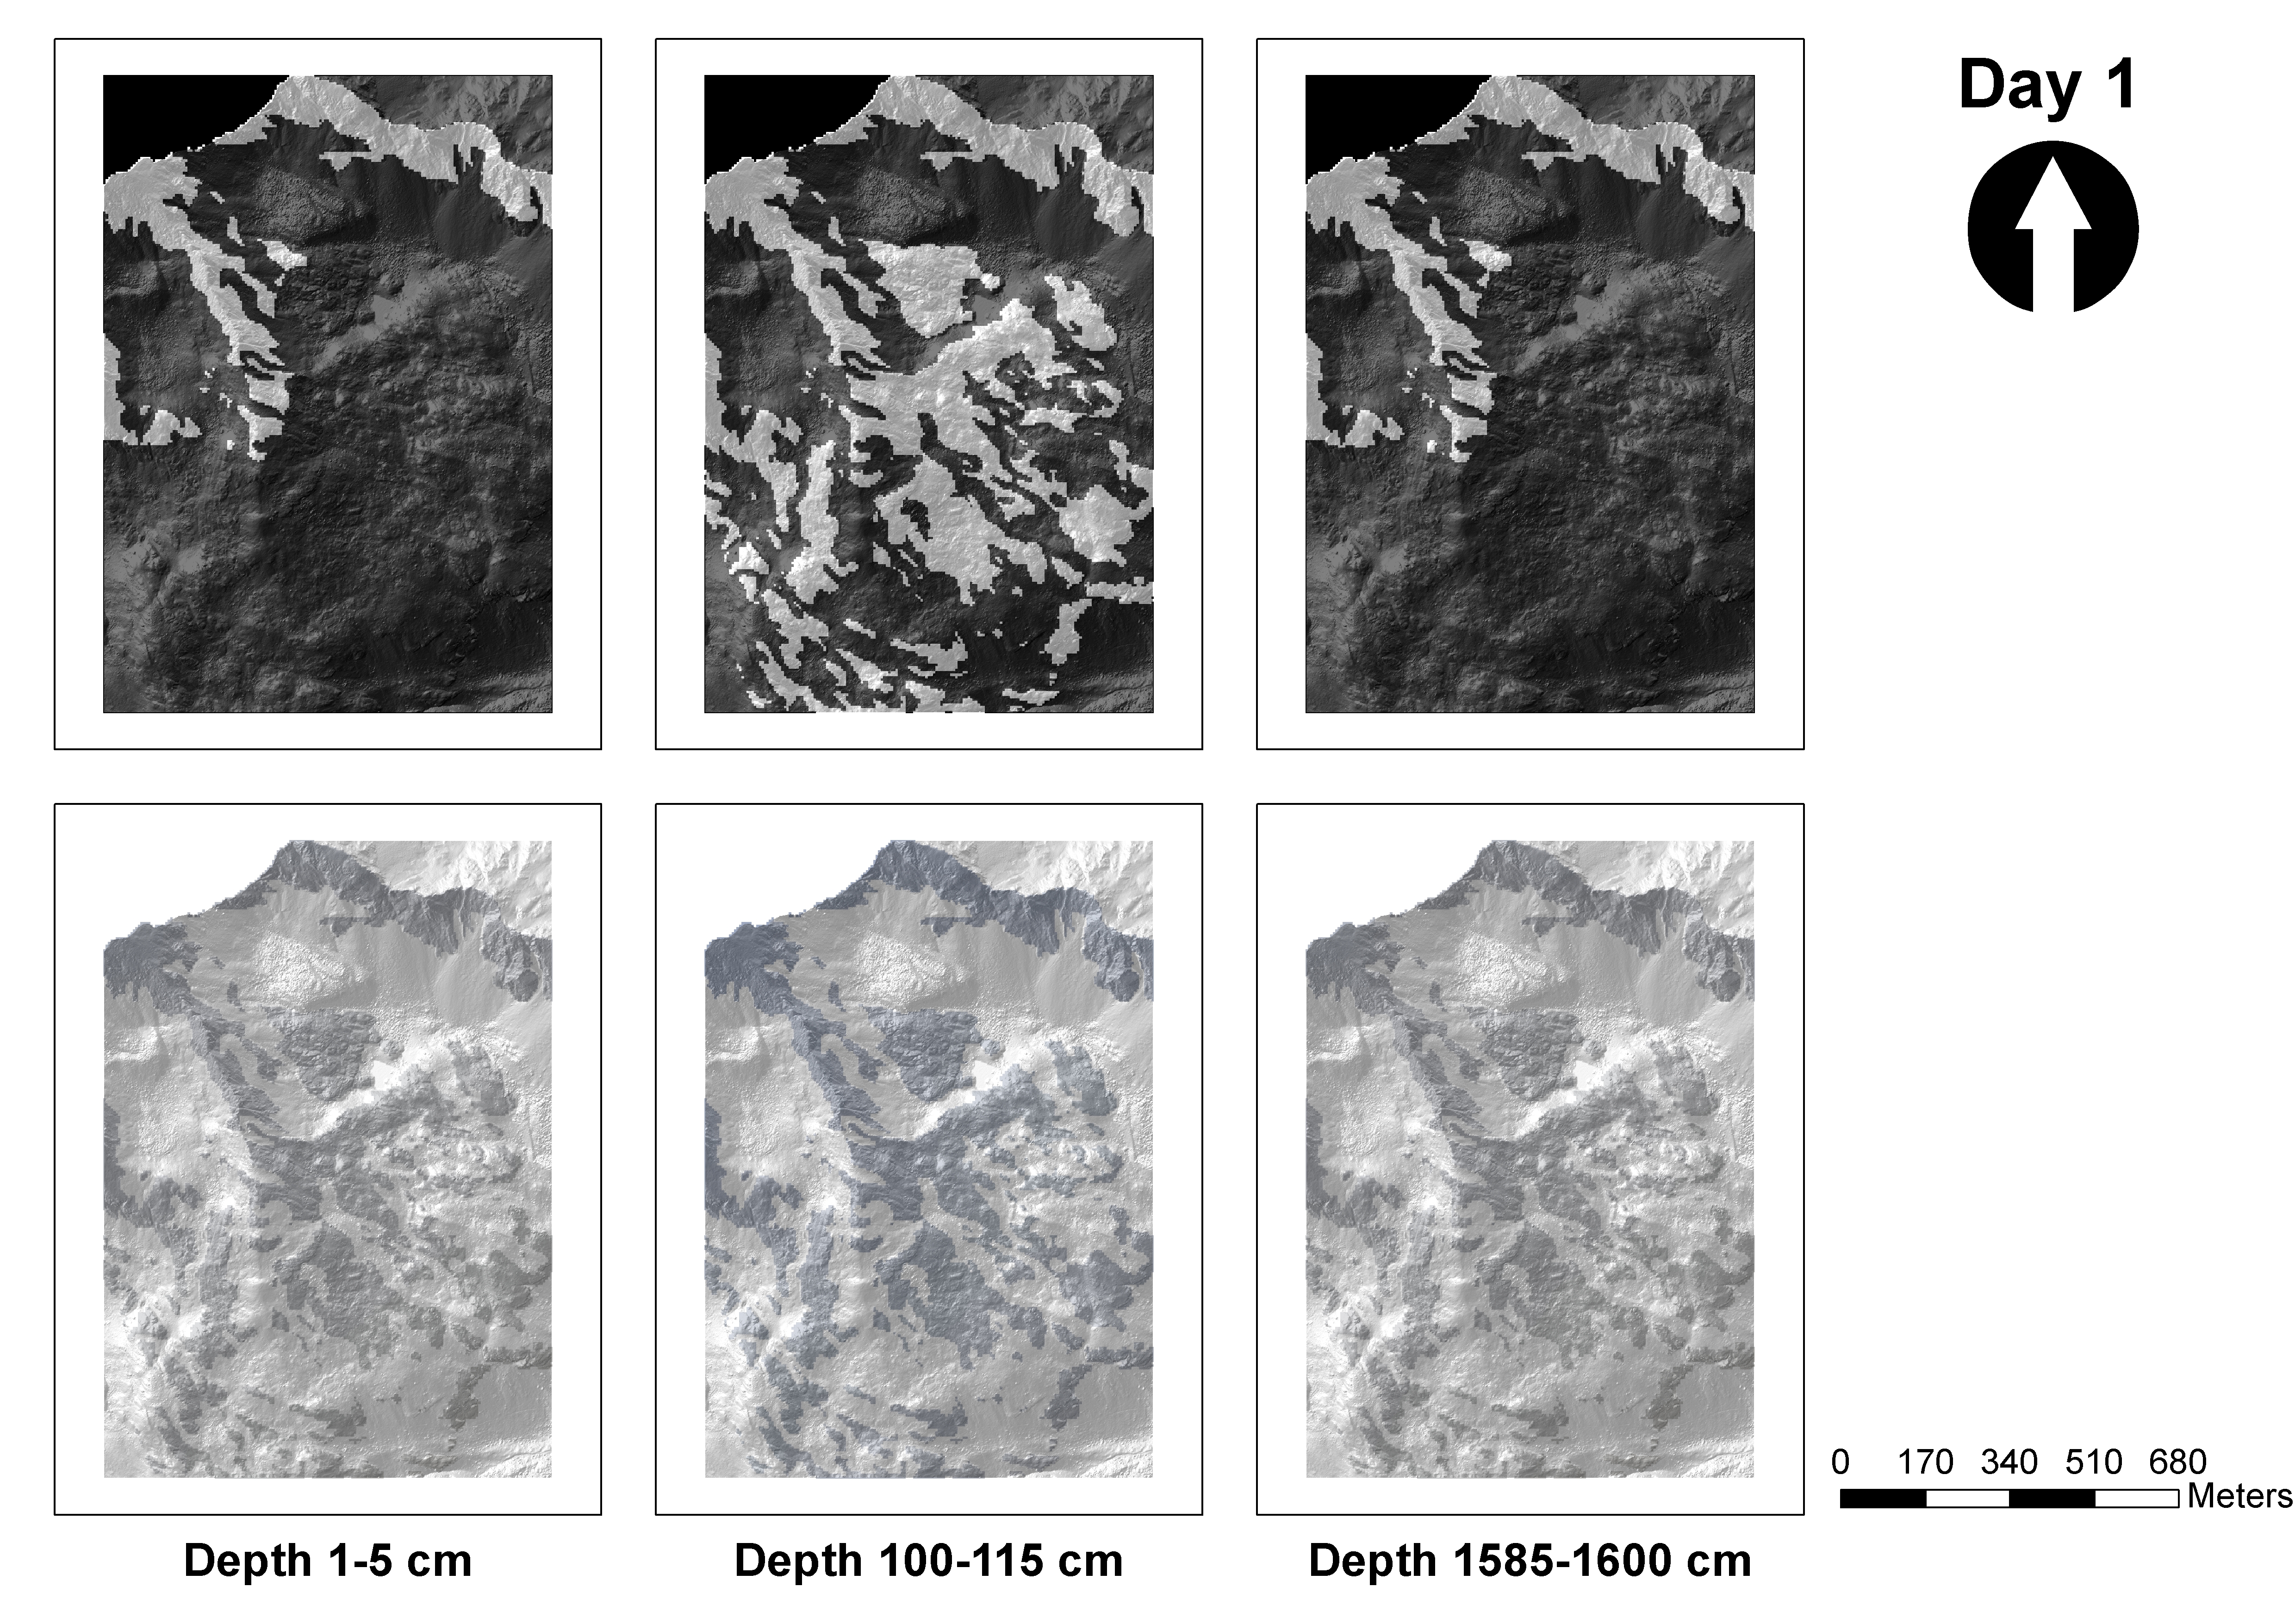
I am doing my first steps in arcpy.mapping: I am trying to export a map as jpeg 365 times and exchange the data for each day of the year in six dataframes within the layout accordingly. I have two issues I just cannot get solved and would really appreciate any help:
1. I am creating a .clr file from scratch (lines 10-17) to use in arcpy.AddColormap_management (line 44). However, the cells that should be blue are diplayed transparent and the ones that should be transparent are black (see upper row of first screenshot). It worked with a single dataframe but with more not anymore (although I am not sure if the df number is the problem). How can I solve this?
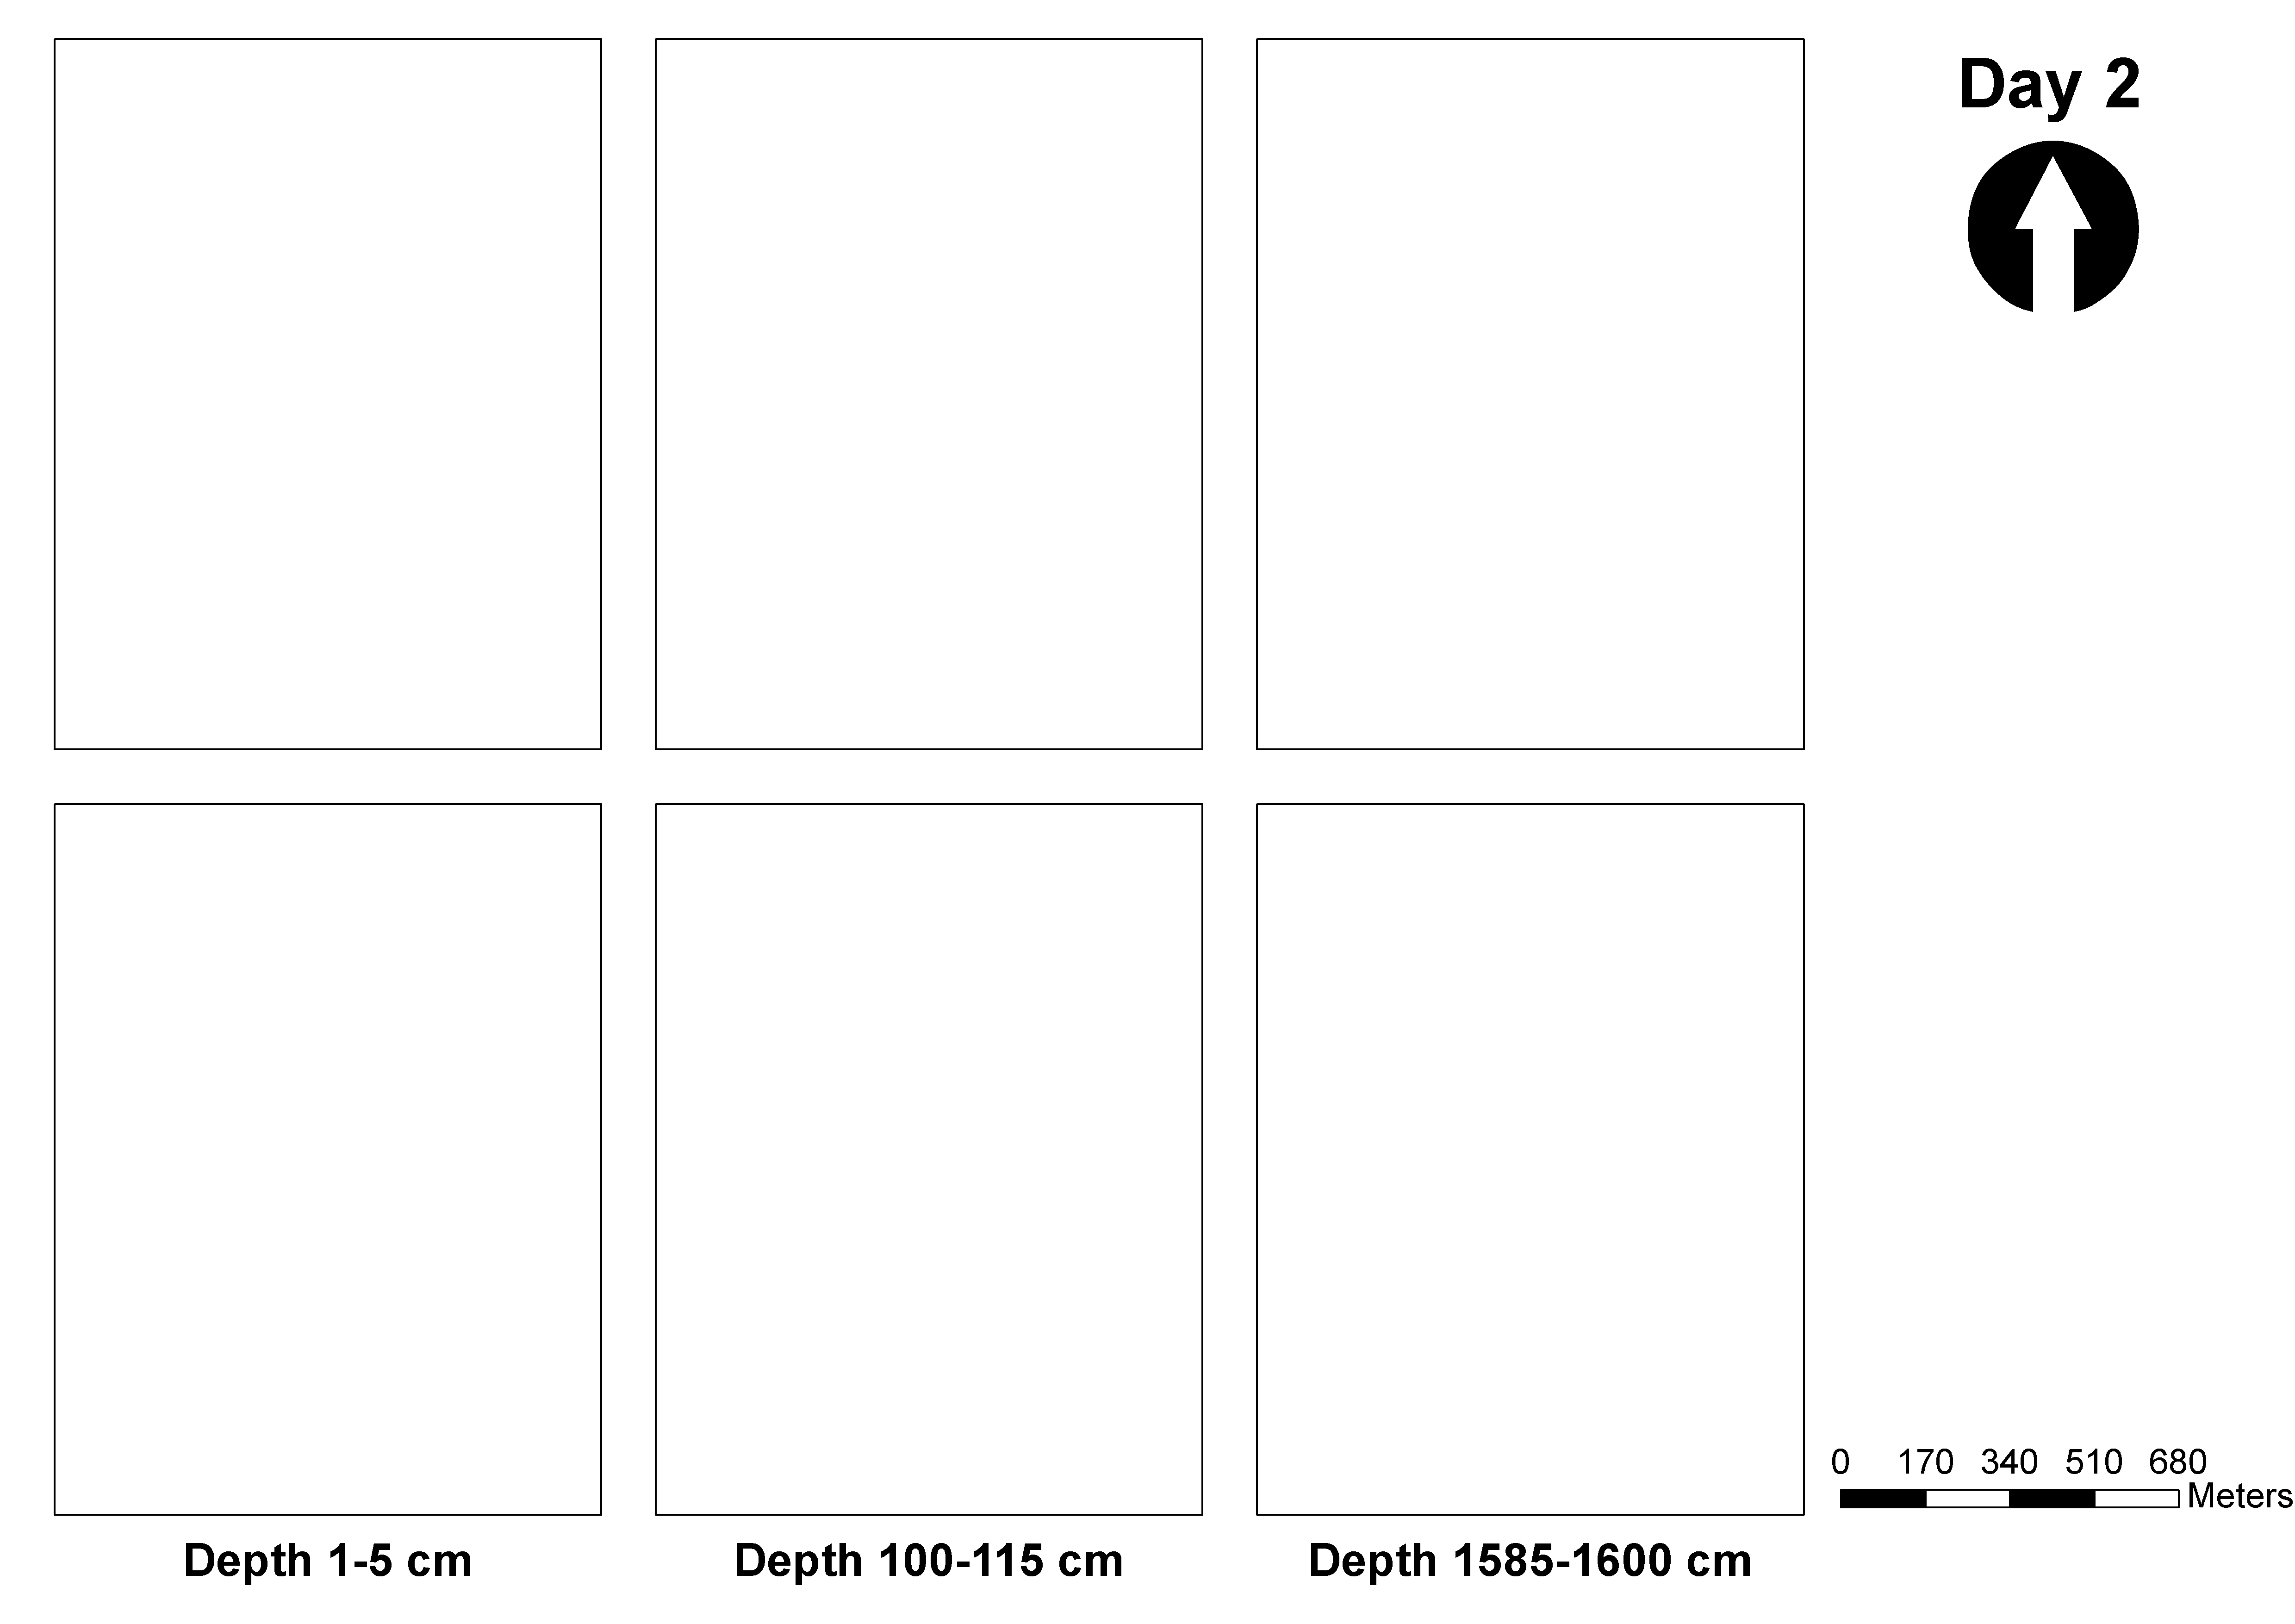
2. Most important: Only the first map I export does contain data. All other 364 ones only display empty dataframes. This is why I thought that sth is wrong with the loop over days, but the Text (line 97) is changed as I wish (see second example). I have now idea why all the other datasets are not found.
I have attached two examples of the first two maps exported to show what I mean,
thank you very much,
Ludwig
Here is my script:
import os, arcpy, csv
from arcpy import env
arcpy.env.overwriteOutput = True

### First create a color map (*.clr) file to use as a model for symbology for the raster layers. This done in the GUI.
## Hillshade
# Hillshade im GUI aufmachen, richtig darstellen und als Layerfile abspeichern. Dieses File wird weiter unten dann als Vorbild verwendet.
## Ice classes
wdir = "D:\\R_working_directory\\hales_and_roering_2007\\"
nodata = [0, 255, 255, 255, 0] # value 0 transparent
data = [1, 0, 0, 255, 1] # value 1 blue
table = [nodata, data]
with open(wdir + "ice_colormap.clr", "w") as csvfile:
    writer = csv.writer(csvfile, delimiter = ' ', lineterminator = '\n')
    for r in table:
        writer.writerow(r)
    csvfile.close()
## Temperatures
# Beispielraster erstellen das die Temperaturen ueber das ganze Jahr und Modell abdeckt. In GUI aufmachen, richtig darstellen und als Layerfile abspeichern.
# Dieses File wird unten dann als Vorbild verwendet.

## Arbeiten auf der mxd im weiteren Sinne:
# Die mxd mit der man arbeiten moechte sollte schon data frames haben
mxd = arcpy.mapping.MapDocument("D:\\R_working_directory\\hales_and_roering_2007\\mapping.mxd")
mxd.author = "Ludwig Hilger"
mxd.save()
dfs = arcpy.mapping.ListDataFrames(map_document = mxd)
## Layer fuer Hillshade:
wdir = "D:\\R_working_directory\\hales_and_roering_2007\\SGRD"
arcpy.MakeRasterLayer_management(wdir  + "\\" + "ALS_201209_EPCtG-median-1m_CG_CGwP_AH.tif", "hslayer", "#")
arcpy.ApplySymbologyFromLayer_management("hslayer", wdir  + "\\" + "ALS_201209_EPCtG-median-1m_CG_CGwP_AH.lyr")
refhslayer = arcpy.mapping.Layer("hslayer")

## Eigentliche Datensaetze
di = [[0, 1, 2, 3, 4, 5],["1-5", "1-5", "100-115", "100-115", "1585-1600", "1585-1600"]] # set here the depths you want to display and the order of the dfs
### BEGIN LOOP OVER DAYS
for j in range(1, 366):
    ### BEGIN LOOP OVER DEPTHS
    print("Starting day " + str(j))
    for i in list(set(di[1]))[::-1]:
        ## Data frame: Ice existent at different depths
        arcpy.env.workspace = "D:\\R_working_directory\\hales_and_roering_2007\\SGRD\\ice_classes"
        wdir = "D:\\R_working_directory\\hales_and_roering_2007\\SGRD\\ice_classes"
        arcpy.AddColormap_management(wdir  + "\\" + "Day_" + str(j) + "_ice_" + i + "cm.tif", "#", "D:\\R_working_directory\\hales_and_roering_2007\\ice_colormap.clr")
        arcpy.MakeRasterLayer_management(wdir  + "\\" + "Day_" + str(j) + "_ice_" + i + "cm.tif", "icecurrentlayer", "#")
        reficecurrentlayer = arcpy.mapping.Layer("icecurrentlayer")
        arcpy.mapping.AddLayer(data_frame = dfs[di[0][di[1].index(i)]], add_layer = reficecurrentlayer) # Provides the ability to add a layer to a data frame within a map document (.mxd) using simple placement options
        ## Data frame: Temperature_days_different_depths
        wdir = "D:\\R_working_directory\\hales_and_roering_2007\\SGRD\\temp_days"
        arcpy.env.workspace = "D:\\R_working_directory\\hales_and_roering_2007\\SGRD\\temp_days"
        arcpy.MakeRasterLayer_management(wdir  + "\\" + "Day_" + str(j) + "_Depth_" + i.split("-")[1] + "cm.tif", "tempcurrentlayer", "#")
        arcpy.SetRasterProperties_management("tempcurrentlayer", "PROCESSED", "1, -18, 18, 0, 1", "#", "#") # set Anzeigeart, bandnr, min, max, mean, stdv (keine Ahnung ob richtig)
        arcpy.ApplySymbologyFromLayer_management("tempcurrentlayer", "D:\\R_working_directory\\hales_and_roering_2007\\SGRD\\colormodel.lyr")
        reftempcurrentlayer = arcpy.mapping.Layer("tempcurrentlayer")
        arcpy.mapping.AddLayer(data_frame = dfs[di[0][di[1].index(i)]+1], add_layer = reftempcurrentlayer) # Provides the ability to add a layer to a data frame within a map document (.mxd) using simple placement options
    ### END LOOP OVER DEPTHS

    ## Add HS to all data frames:
    for df in range(len(arcpy.mapping.ListDataFrames(mxd))):
        arcpy.mapping.AddLayer(data_frame = dfs[df], add_layer = refhslayer)

    ### Set all dfs to same scale etc, general layout:
    # die Namen der MAPSURROUND_ELEMENTS (z.B. "Alternating Scale Bar") kann in der GUI in den Properties dieser Elemente gesetzt oder nachgesehen werden.
    for df in arcpy.mapping.ListDataFrames(mxd):#range(len(arcpy.mapping.ListDataFrames(mxd))):
        df.spatialReference = arcpy.SpatialReference(25832)
        df.scale = 11000
    scaleBar = arcpy.mapping.ListLayoutElements(mxd, "MAPSURROUND_ELEMENT", "Alternating Scale Bar")[0] # finds the mapsurround element named ScaleBar
    scaleBar.elementPositionX = 335
    scaleBar.elementPositionY = 20
    narrow = arcpy.mapping.ListLayoutElements(mxd, "MAPSURROUND_ELEMENT", "North Arrow")[0]
    narrow.elementPositionX = 360
    narrow.elementPositionY = 240
    for elm in arcpy.mapping.ListLayoutElements(mxd, "TEXT_ELEMENT"):# change Day caption and reposition
        if elm.text == "Day x":
            elm.text = "Day " + str(j)
            elm.elementPositionX = 358
            elm.elementPositionY = 275
    for elm in arcpy.mapping.ListLayoutElements(mxd, "TEXT_ELEMENT"):# set depth slice names and set position of them, anchor points of texts should be set in the gui
        if elm.text == "Depth x":
            elm.text = "Depth " + str(di[1][0]) + " cm"
            elm.elementPositionX = 60
            elm.elementPositionY = 7
        if elm.text == "Depth y":
            elm.text = "Depth " + str(di[1][3]) + " cm"
            elm.elementPositionX = 170
            elm.elementPositionY = 7
        if elm.text == "Depth z":
            elm.text = "Depth " + str(di[1][5]) + " cm"
            elm.elementPositionX = 280
            elm.elementPositionY = 7
    ### Export as jpeg
    wdir = "D:\\R_working_directory\\hales_and_roering_2007\\jpegs"
    arcpy.mapping.ExportToJPEG(map_document = mxd, out_jpeg = wdir + "\\" + "Day_" + str(j) + ".jpg", color_mode = "24-BIT_TRUE_color", data_frame = "PAGE_LAYOUT", world_file = False, jpeg_quality = 100, resolution = 300, progressive = False)

    ### Remove all layers from page layout and reset text elements
    for elm in arcpy.mapping.ListLayoutElements(mxd, "TEXT_ELEMENT"):# reset Day caption
        if elm.text == "Day " + str(j):
            elm.text = "Day x"
    for elm in arcpy.mapping.ListLayoutElements(mxd, "TEXT_ELEMENT"):# reset depth slice names
        if elm.text == "Depth " + str(di[1][0]):
            elm.text = "Depth x"
        if elm.text == "Depth "  + str(di[1][3]):
            elm.text = "Depth y"
        if elm.text == "Depth " + str(di[1][5]):
            elm.text = "Depth z"
    for df in arcpy.mapping.ListDataFrames(mxd):
        for lyr in arcpy.mapping.ListLayers(mxd, "", df):
            arcpy.mapping.RemoveLayer(df, lyr)
    mxd.save()
### END LOOP OVER DAYS
exit()
Here are the two examples:
Solved! Go to Solution.
Accepted Solutions
- Mark as New
- Bookmark
- Subscribe
- Mute
- Subscribe to RSS Feed
- Permalink
- Report Inappropriate Content
Finally managed to correct this myself:
1. Instead of a clr file I used arcpy.ApplySymbologyFromLayer_management and prepared a model layer file in the gui.
2. Line 27 needs to go inside the day loop.
regards,
Ludwig