- Home
- :
- All Communities
- :
- Products
- :
- ArcGIS Spatial Analyst
- :
- ArcGIS Spatial Analyst Questions
- :
- Grid "Artifacts" when Contouring
- Subscribe to RSS Feed
- Mark Topic as New
- Mark Topic as Read
- Float this Topic for Current User
- Bookmark
- Subscribe
- Mute
- Printer Friendly Page
- Mark as New
- Bookmark
- Subscribe
- Mute
- Subscribe to RSS Feed
- Permalink
- Report Inappropriate Content
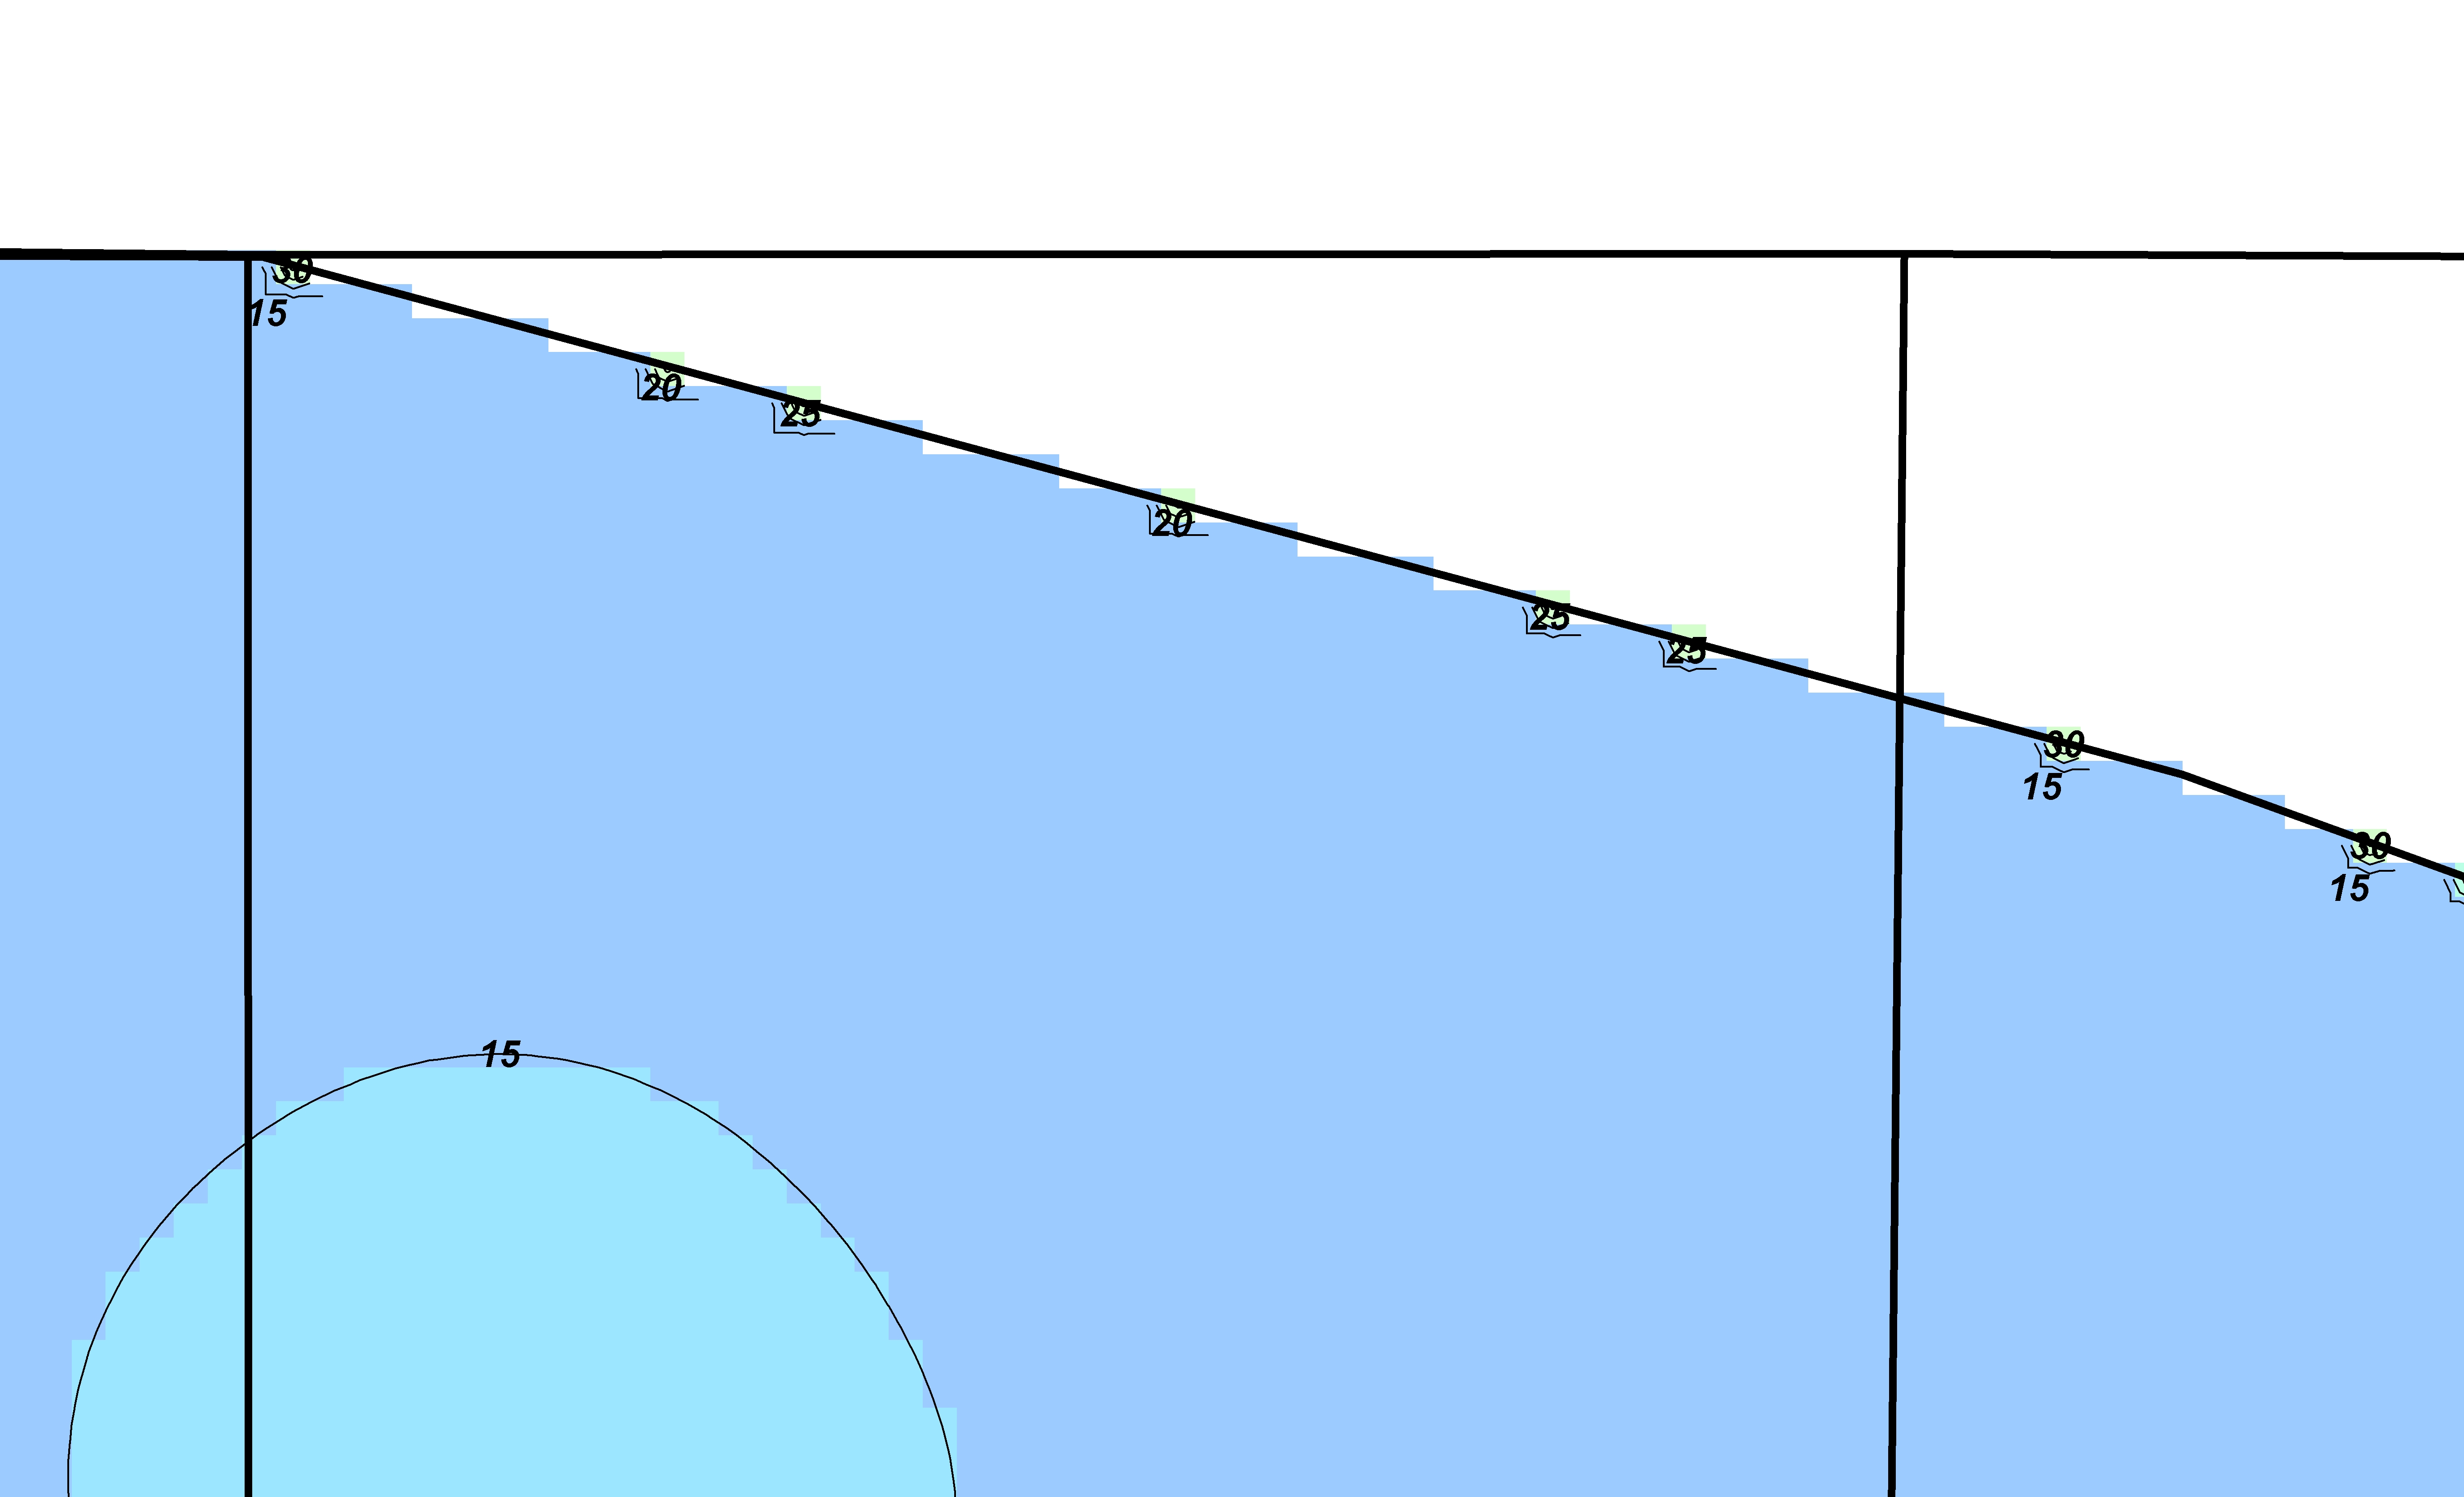
Is there a tool that will eliminate these "Artifacts" along the edge of a grid? I used "spline by barrier" to generate the grid then I had to clip the grid to get rid of the "No Data". These cells are left over and when I contour it adds these small clusters which wreaks havoc on my labeling!
Is there a better tool for gridding continuous numerical data? Should i decrease my cell size? (current is 200m).
Only way i can think of is to select each "Artifact" from the table of the contour layer and delete them. This is extremely time consuming on over 50 grids, so any help would be much appreciated!
Solved! Go to Solution.
Accepted Solutions
- Mark as New
- Bookmark
- Subscribe
- Mute
- Subscribe to RSS Feed
- Permalink
- Report Inappropriate Content
Hi Daniel, you are going to have to run one of the genearalizaion tools after creating your linework. Once you have an acceptable result your labelling should be fine. As far as your grid cell sizes are concerned, you need to consider things such as your minimum mapping unit and extent.
- Mark as New
- Bookmark
- Subscribe
- Mute
- Subscribe to RSS Feed
- Permalink
- Report Inappropriate Content
If you are referring to jagged appearance along the edges...they are the grid cells ... they will never go away, you can decrease cell size to make them less noticeable but they aren't artifacts they represent the nature of raster data. For visualization purposes, you can mitigate the "jaggies" by decreasing cell size or convert raster to vector...where possible...
- Mark as New
- Bookmark
- Subscribe
- Mute
- Subscribe to RSS Feed
- Permalink
- Report Inappropriate Content
Dan and David,
I appreciate your answers, I used the dissolve tool on the contours and that solved the labeling problem.
As for the grid cells, I think by using "Spline by Barrier" it created those cells along the barrier. It is meant for lines inside the data and not as a "clipping" tool. I think that's the problem. I am going to use natural neighbor and then clip the raster to see if those same zig zags disappear.
Both your answers are correct and helped! But i can only mark one as "Correct". I guess my next question is when you have continuous numeric data such as Sub Surface values for a formation in a well...essentially the surface elevation - measured depth, what is the best gridding algorithm to use?
I'm tying to contstruct a "Smooth" surface below the surface of the earth. The topo tools don't work since they use the Hydrology tools, or use flow to construct valleys...
Thanks!
- Mark as New
- Bookmark
- Subscribe
- Mute
- Subscribe to RSS Feed
- Permalink
- Report Inappropriate Content
Hi Daniel, as Dan says the grid structure producing the stair-step will never 'disappear'. It is part of the raster structure. Natural Neighbor, bi-linear, etc will not make a difference. If you are looking into making a smooth surface of any type, I would look into the exact interpolaters such as an IDW or one of the local of global polynomial tools available in the geostatistical analyst tools. Kriging may be appropriate if your data meet normalization criteria. Keep in mind all work on grids, so you will have to export to vector and smooth where (as Dan says) possible and/or appropriate--
- Mark as New
- Bookmark
- Subscribe
- Mute
- Subscribe to RSS Feed
- Permalink
- Report Inappropriate Content
David,
Where can i find the normalization criteria for Kriging? Is that the histogram and zscores?
Thanks,
Dan
- Mark as New
- Bookmark
- Subscribe
- Mute
- Subscribe to RSS Feed
- Permalink
- Report Inappropriate Content
Yes, that will give you a quick idea on how the data is distributed. Kriging requires that the data be normally distributed or close to normal. For example, rainfall time-series data is a continuous measure but never falls below zero becauce you can't have less than no rainfall right? So in the past I would apply a natural log-tranformation to the data that forces some data values to fall below zero and thus making it pass normalizaiton tests like t and z scores. I could then take say 10 or 15 rainfall stations, log transform the data, then make a surface using kriging. Negative values are then ignored or discarded....