Turn on suggestions
Auto-suggest helps you quickly narrow down your search results by suggesting possible matches as you type.
Cancel
- Home
- :
- All Communities
- :
- Products
- :
- ArcGIS GeoStatistical Analyst
- :
- ArcGIS GeoStatistical Analyst Questions
- :
- Emprical Bayesian Kriging
Options
- Subscribe to RSS Feed
- Mark Topic as New
- Mark Topic as Read
- Float this Topic for Current User
- Bookmark
- Subscribe
- Mute
- Printer Friendly Page
Emprical Bayesian Kriging
Subscribe
4229
4
06-25-2014 07:36 PM
06-25-2014
07:36 PM
- Mark as New
- Bookmark
- Subscribe
- Mute
- Subscribe to RSS Feed
- Permalink
- Report Inappropriate Content
I'm having some trouble deciding how best to model my groundwater level data. I have evaluated it using the ESDA tools and I have a positively skewed non-normal data set with a WNW to ESE global trend. I have tried a couple of different kriging models and the EBK provides the best overal result in terms of prediction error statistics. My power function is not between 0.25 and 1.75 as recommended in the help files so I'm wondering what does this mean. Also I'm not entirely sure what my normal QQ plot is telling me- does the line have to be 1:1 or does the slope not matter just as long as the data points fall along the line?
Thanks Simon.
Ps: I also noted there are more options for different semivariogram models in the 10.2 files..I assume these options aren't available in the 10.1 version.
Thanks Simon.
Ps: I also noted there are more options for different semivariogram models in the 10.2 files..I assume these options aren't available in the 10.1 version.
4 Replies
by
Anonymous User
Not applicable
06-26-2014
01:57 PM
- Mark as New
- Bookmark
- Subscribe
- Mute
- Subscribe to RSS Feed
- Permalink
- Report Inappropriate Content
Original User: Eric6346
How did you determine that the power value is outside [0.25, 1.75]? That should not be able to happen.
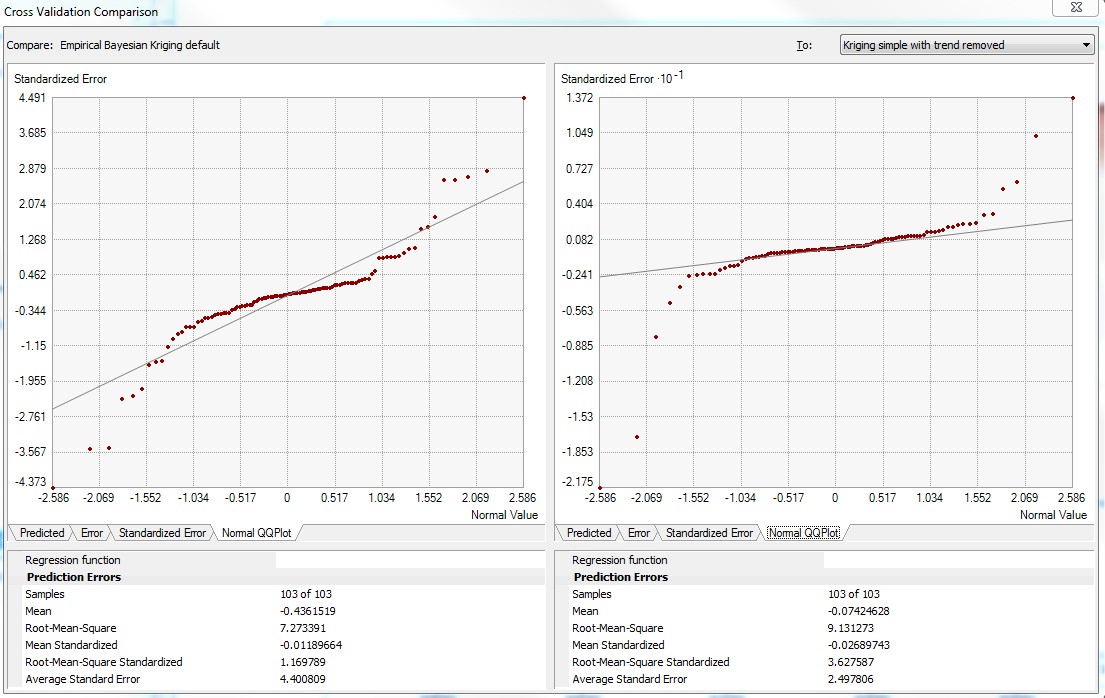
About the QQ Plot, the points in the graph should follow the 1:1 line as closely as possible. Your QQ Plot (from the detrended kriging model) looks good in the middle, but you're getting large deviations at the tails. Some deviation at the tails is expected, but deviations this large are probably due to the skewness that you described. You should try using a transformation (one of the options in EBK) and see if it improves the QQ Plot.
How did you determine that the power value is outside [0.25, 1.75]? That should not be able to happen.
About the QQ Plot, the points in the graph should follow the 1:1 line as closely as possible. Your QQ Plot (from the detrended kriging model) looks good in the middle, but you're getting large deviations at the tails. Some deviation at the tails is expected, but deviations this large are probably due to the skewness that you described. You should try using a transformation (one of the options in EBK) and see if it improves the QQ Plot.
06-26-2014
04:26 PM
- Mark as New
- Bookmark
- Subscribe
- Mute
- Subscribe to RSS Feed
- Permalink
- Report Inappropriate Content
Opps I think I was reading the wrong axis. The power looks about 1.6-1.75.
The empirical transformation provided the better qqplot compared with a logempirical transformation but both were not quite as accurate on the prediction front as the default EBK. I checked the data to see if the deviations might be caused by measurement errors but they are accurate and represent relatively large differences in groundwater level head over short distances. This is because one well is representing the shallower unconfined aquifer and the other wells an artesian aquifer with much higher head.
I get very good predictions using ordinary and simple kriging with trend removed and a better fit using these models for the middle data along the qqplot, however the transformed EBK does forces more points to fall closer to the normal line. The issue with the simple and ordinary kriging, despite for the large deviations at the tail, is that the RMSSE is about 3 and not 1. For EBK it is near to 1.
Using the transformed EBK and looking at the prediction statistics and qqplot am I able to use the prediction standard error maps or would this be misleading for some reason?
Simon
by
Anonymous User
Not applicable
06-27-2014
07:34 AM
- Mark as New
- Bookmark
- Subscribe
- Mute
- Subscribe to RSS Feed
- Permalink
- Report Inappropriate Content
Original User: Eric6346
I see that the Root Mean Square error is smaller with the default model, but overall the EBK with empirical transformation looks better. The transformation stabilizes the RMS Standardized, and the Average Standard Error is much closer to the Root Mean Square error (these values should be close to each other).
I see that the Root Mean Square error is smaller with the default model, but overall the EBK with empirical transformation looks better. The transformation stabilizes the RMS Standardized, and the Average Standard Error is much closer to the Root Mean Square error (these values should be close to each other).
06-27-2014
08:13 AM
- Mark as New
- Bookmark
- Subscribe
- Mute
- Subscribe to RSS Feed
- Permalink
- Report Inappropriate Content
I checked the data to see if the deviations might be caused by measurement errors but they are accurate and represent relatively large differences in groundwater level head over short distances. This is because one well is representing the shallower unconfined aquifer and the other wells an artesian aquifer with much higher head.
Simon, why are you combining groundwater levels of wells in different aquifers stratified vertically in one interpolation? As you already stated yourself, this can, and most likely will, result in significant differences in head if there is either infiltration, or significant seepage. In one instance, as demonstrated by a forester, I have seen water levels in a transparent pipe rise to 3 meters above ground level in a spring / brook system for a pipe going 100 meters deep and with known significant seepage, compared to a head of just 5 cm below ground level for the surface level pipe going just 1 meter deep at exactly the same location... This is an image I will never forget, as it demonstrated the mechanism and phenomenon of seepage so well.
Combining such measurements in one interpolation is bound to cause major issues. I think you will need to remove any head measurements not related to the same aquifer. If needed, you can interpolate the other heads of the deeper aquifer separately.