- Home
- :
- All Communities
- :
- User Groups
- :
- Web AppBuilder Custom Widgets
- :
- Questions
- :
- Re: Need assistance in deploying Web App Builder D...
- Subscribe to RSS Feed
- Mark Topic as New
- Mark Topic as Read
- Float this Topic for Current User
- Bookmark
- Subscribe
- Mute
- Printer Friendly Page
Need assistance in deploying Web App Builder Data Grid Widget
- Mark as New
- Bookmark
- Subscribe
- Mute
- Subscribe to RSS Feed
- Permalink
- Report Inappropriate Content
I have a JavaScript application that contains a data grid, where the user can click on an icon to zoom to feature or click on another icon to open up a fact sheet. Here is a preview:
I want to deploy this data grid functionality as a widget, but currently struggling to get it to work properly. I know the steps to add in the custom widget to the Web Application Builder, but cannot get this tool to work properly.
I am attaching the code that contains the tool I want to deploy. The zip file contains: 1. CSS folder with the layout.css file; 2. Graphics folder that contains the two icons; 3. the index.htm file which contains the code.
I have the feature layer I want to use hard coded, which is fine and what I want. I want the data grid to appear in the panel within the widget. So far, I have been unsuccessful in getting this deployed properly.
Does anyone have any ideas or approaches I can use? Would greatly appreciate some assistance.
Ian
Solved! Go to Solution.
Accepted Solutions
- Mark as New
- Bookmark
- Subscribe
- Mute
- Subscribe to RSS Feed
- Permalink
- Report Inappropriate Content
Ian,
Here it is converted to a widget. The most likely issue you were encountering was scope or _WidgetsInTemplateMixin.
- Mark as New
- Bookmark
- Subscribe
- Mute
- Subscribe to RSS Feed
- Permalink
- Report Inappropriate Content
- Mark as New
- Bookmark
- Subscribe
- Mute
- Subscribe to RSS Feed
- Permalink
- Report Inappropriate Content
Robert,
Thank you so much! This works really well. This is awesome!
Still trying to get my icons referenced properly and change the height of the grid within the panel.
Ian
- Mark as New
- Bookmark
- Subscribe
- Mute
- Subscribe to RSS Feed
- Permalink
- Report Inappropriate Content
Ian,
For the height of the grid try editing the widget.html:
<div>
<div data-dojo-attach-point="gridDiv" class="gridDiv" style="height: 29em;"></div>
</div>
- Mark as New
- Bookmark
- Subscribe
- Mute
- Subscribe to RSS Feed
- Permalink
- Report Inappropriate Content
Robert,
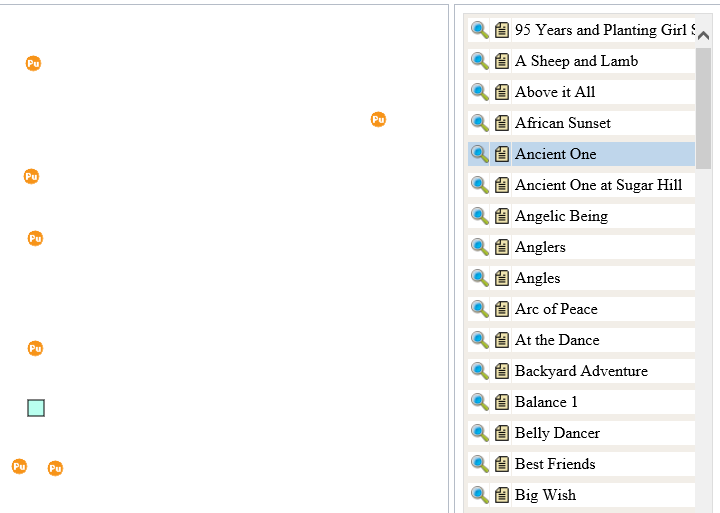
Thank you again for the response. Your assistance is greatly appreciated. I couldn't modify the height of the grid with that line you listed above. I am trying to select elements on the page to see if I can add properties to the .css file. What do you think?
Here is how it currently looks:

- Mark as New
- Bookmark
- Subscribe
- Mute
- Subscribe to RSS Feed
- Permalink
- Report Inappropriate Content
Ian,
Here is what will work for making the dGrid 100% height of widget:
css:
.ArtdGrid.dgrid {
  height: 100% !important;
}
html:
<div style="height:100%;">
  <div data-dojo-attach-point="gridDiv" class="ArtdGrid"></div>
</div>
js:
/*global define, console, window*/
define([
  'dojo/_base/declare',
  'dijit/_WidgetsInTemplateMixin',
  'jimu/BaseWidget',
  'esri/symbols/SimpleLineSymbol',
  'esri/symbols/SimpleMarkerSymbol',
  'esri/Color',
  'esri/tasks/query',
  'esri/tasks/QueryTask',
  'dojo/on',
  'esri/layers/FeatureLayer',
  'esri/request',
  'dgrid/OnDemandGrid',
  'dgrid/Selection',
  'dgrid/extensions/DijitRegistry',
  'dojo/_base/array',
  'dojo/store/Memory',
  'dojo/_base/lang',
  'dijit/form/Button'
],
  function (
    declare,
    _WidgetsInTemplateMixin,
    BaseWidget,
    SimpleLineSymbol,
    SimpleMarkerSymbol,
    Color,
    Query,
    QueryTask,
    on,
    FeatureLayer,
    esriRequest,
    Grid,
    Selection,
    DijitRegistry,
    array,
    Memory,
    lang
  ) {
    //To create a widget, you need to derive from BaseWidget.
    return declare([BaseWidget, _WidgetsInTemplateMixin], {

      baseClass: 'jimu-widget-art',
      name: 'ArtList',
      label: 'Art List',
      columns: null,
      publicartFL: null,

      //methods to communication with app container:

      postCreate: function () {
        this.inherited(arguments);
        console.log('postCreate');
      },

      startup: function () {
        this.inherited(arguments);

        // Map Feature Layer
        this.publicartFL = new FeatureLayer("http://gis.edmondok.com/arcgis/rest/services/Parks/PublicArt/MapServer/0", {
          id: "PublicArtFL",
          opacity: 1,
          outFields: ["*"]
        });
        this.map.addLayer(this.publicartFL);

        // Data Grid
        this.columns = [{
          label: "",
          field: "OBJECTID",
          formatter: this.createZoomButton
        }, {
          label: "",
          field: "OBJECTID",
          formatter: this.createFactSheetButton
        }, {
          label: "Name",
          field: "NAME"
        }];

        // Define a Public Art Highlight Symbol Graphic
        var publicArtHighlightSymbol = new SimpleMarkerSymbol(SimpleMarkerSymbol.STYLE_SQUARE, 16, new SimpleLineSymbol(SimpleLineSymbol.STYLE_SOLID,
          new Color([0, 0, 0]), 1), new Color([115, 255, 223, 0.50]));
        this.publicartFL.setSelectionSymbol(publicArtHighlightSymbol);

        this.publicartFL.on("load", lang.hitch(this, function () {
          var time = Math.floor(Math.random() * 1000);
          var requestUrl = "http://gis.edmondok.com/arcgis/rest/services/Parks/PublicArt/MapServer/0/query?where=1%3D1&outFields..." + time;
          var request = new esriRequest({
            'url': requestUrl,
            'content': {
              'f': "json"
            },
            'callbackParamName': "callback"
          });
          request.then(lang.hitch(this, function (response) {
              console.log("Success: ", response);
              var items = array.map(response.features, function (feature) {
                return feature.attributes;
              });
              var memStore = new Memory({
                data: items,
                idProperty: "OBJECTID"
              });
              var publicArtGrid = declare([Grid, Selection, DijitRegistry]);
              this.grid = new publicArtGrid({
                bufferRows: Infinity,
                minRowsPerPage: 1000, // Ian's Comments: 2016-01-21 - By default the grid will populate only 25 records at a time.
                columns: this.columns
              }, this.gridDiv);
              this.grid.startup();
              this.grid.set("store", memStore);
              this.grid.set("sort", "NAME");
              this.grid.on("click", lang.hitch(this, function (e) {
                if (e.target.getAttribute("myAttri") == "Zoom") {
                  if (e.target.alt) {
                    this.zoomRow(e.target.alt);
                  }
                } else if (e.target.getAttribute("myAttri") == "FactSheet") {
                  if (e.target.alt) {
                    this.openFactSheet(e.target.alt);
                  }
                }
              }));
            }),
            function (error) {
              console.log("Error: ", error.message);
            });
        }));
      },

      // Zoom to Art Piece Button
      createZoomButton: function (id) {
        var zoomButton = "<div data-dojo-type='dijit/form/Button'><img src='widgets/ArtList/images/zoom.png' myAttri='Zoom' alt='" + id + "'";
        zoomButton = zoomButton + " width='18' height='18' title='Zoom to Art Piece'></div>";
        return zoomButton;
      },

      // Zoom to Selected Feature - Art Piece
      zoomRow: function (id) {
        console.info(id);
        // Set Public Art Query
        var queryPublicArt = new Query();
        queryPublicArt.objectIds = [id];
        this.publicartFL.selectFeatures(queryPublicArt, FeatureLayer.SELECTION_NEW, lang.hitch(this, function (features) {
          // Zoom to the Selected Feature
          var publicArtExtent = features[0].geometry;
          this.map.centerAndZoom(publicArtExtent, 17);
        }));
      },

      // Fact Sheet Button
      createFactSheetButton: function (id) {
        var factSheetButton = "<div data-dojo-type='dijit/form/Button'><img src='widgets/ArtList/images/fact_sheet.png' myAttri='FactSheet' alt='" + id + "'";
        factSheetButton = factSheetButton + " width='18' height='18' Title='Go to fact sheet'></div>";
        return factSheetButton;
      },

      // Open Fact Sheet in New HTM Page in New Web Page Tab
      openFactSheet: function (id) {
        var queryFactSheet = new Query();

        queryFactSheet.where = "OBJECTID = " + id;
        queryFactSheet.outFields = ["FACT_SHEET"];
        var queryTask = new QueryTask("http://gis.edmondok.com/arcgis/rest/services/Parks/PublicArt/MapServer/0");

        queryTask.execute(queryFactSheet, function (result) {
          var factSheetURL = result.features[0].attributes.FACT_SHEET;
          window.open(factSheetURL, '_blank');
        });
      }

    });
  });
The images in the dgrid are just making sure that the path is correct:
src='widgets/ArtList/images/zoom.png'
- Mark as New
- Bookmark
- Subscribe
- Mute
- Subscribe to RSS Feed
- Permalink
- Report Inappropriate Content
Thank you very much Robert! I was able to lengthen the data grid by using this code:
.dgrid-grid.ui-widget.gridDiv{
height: 750px;
padding: 0px;
border-style: none;
}
However, what you suggested looks a lot better and that is what I am going with. I added some other css properties to make the data grid list look like this:
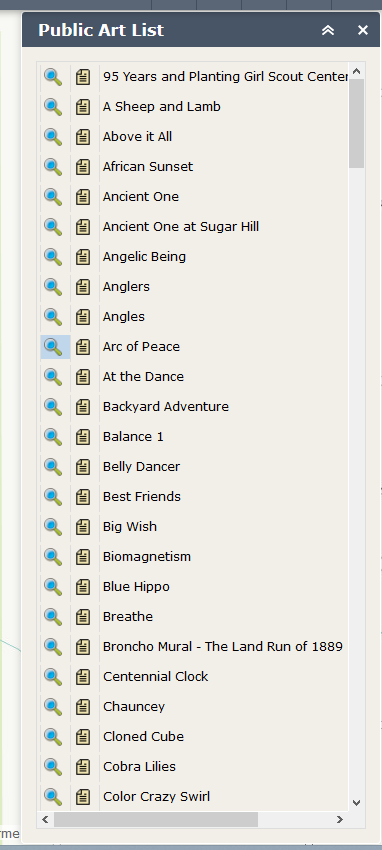
I am now working with the css to have the grey lines removed from the columns. Still selecting elements on the page to see what it is I need to set  .
.
Thank you much for your assistance!
Ian
- Mark as New
- Bookmark
- Subscribe
- Mute
- Subscribe to RSS Feed
- Permalink
- Report Inappropriate Content
Hey Robert, @RobertScheitlin__GISP
trying to deploy this widget or the ArtList widget, i and get blank gray space for the dgrid.
my html is <div data-dojo-attach-point="grid2" style="height: 100%"></div>
what is the issue here

- Mark as New
- Bookmark
- Subscribe
- Mute
- Subscribe to RSS Feed
- Permalink
- Report Inappropriate Content
It appears you have missed something in your code I would have to see your Widget.js
- Mark as New
- Bookmark
- Subscribe
- Mute
- Subscribe to RSS Feed
- Permalink
- Report Inappropriate Content