- Home
- :
- All Communities
- :
- User Groups
- :
- Web AppBuilder Custom Widgets
- :
- Questions
- :
- Re: Incorporating graphs into eSearch Widget resul...
- Subscribe to RSS Feed
- Mark Topic as New
- Mark Topic as Read
- Float this Topic for Current User
- Bookmark
- Subscribe
- Mute
- Printer Friendly Page
Incorporating graphs into eSearch Widget results
- Mark as New
- Bookmark
- Subscribe
- Mute
- Subscribe to RSS Feed
- Permalink
- Report Inappropriate Content
I am using Robert's eSearch Widget to bring in some ACS census data in certain areas. Graphically, it displays the results like this:
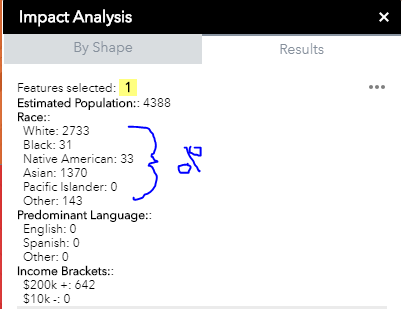
Lets say I wanted to display the race results as a pie graph. I can easily use `(Math.floor((Total Pop/RacialGroup) * 100).toFixed(1) + "%"); ` or something like that to get the percentage> I have no idea how I could create and insert a small pie graph in the Results under Race to display. Currently, I am using the following to display the results in the widget.js.
So, I am thinking that I need to perhaps look to layerConfig inthe config_eSearch.json perhaps to set something like this up. Any ideas or suggestions?
- Mark as New
- Bookmark
- Subscribe
- Mute
- Subscribe to RSS Feed
- Permalink
- Report Inappropriate Content
Justin,
There is currently no support or any plans to support graphing in the eSearch results. This would be a pretty involved undertaking so I don't even have any suggestions about this at the moment.
- Mark as New
- Bookmark
- Subscribe
- Mute
- Subscribe to RSS Feed
- Permalink
- Report Inappropriate Content
Thanks Robert,
It does look like quite an undertaking. I am looking at using the javascript api and dojo/dijits and seeing what I can come up with. I see there is an InfoTemplate example that allows you to have a Pie Chart tab in a popup modal on a clickable layer, but that seems like a whole different concept. Perhaps if I made a category title clickable and then launched a modal with the pie chart, that might be doable. Thanks.
- Mark as New
- Bookmark
- Subscribe
- Mute
- Subscribe to RSS Feed
- Permalink
- Report Inappropriate Content
Justin,
You can try and add the chart to the results popup by making code changes in the widget code to add a media section to the results popup.
- Mark as New
- Bookmark
- Subscribe
- Mute
- Subscribe to RSS Feed
- Permalink
- Report Inappropriate Content
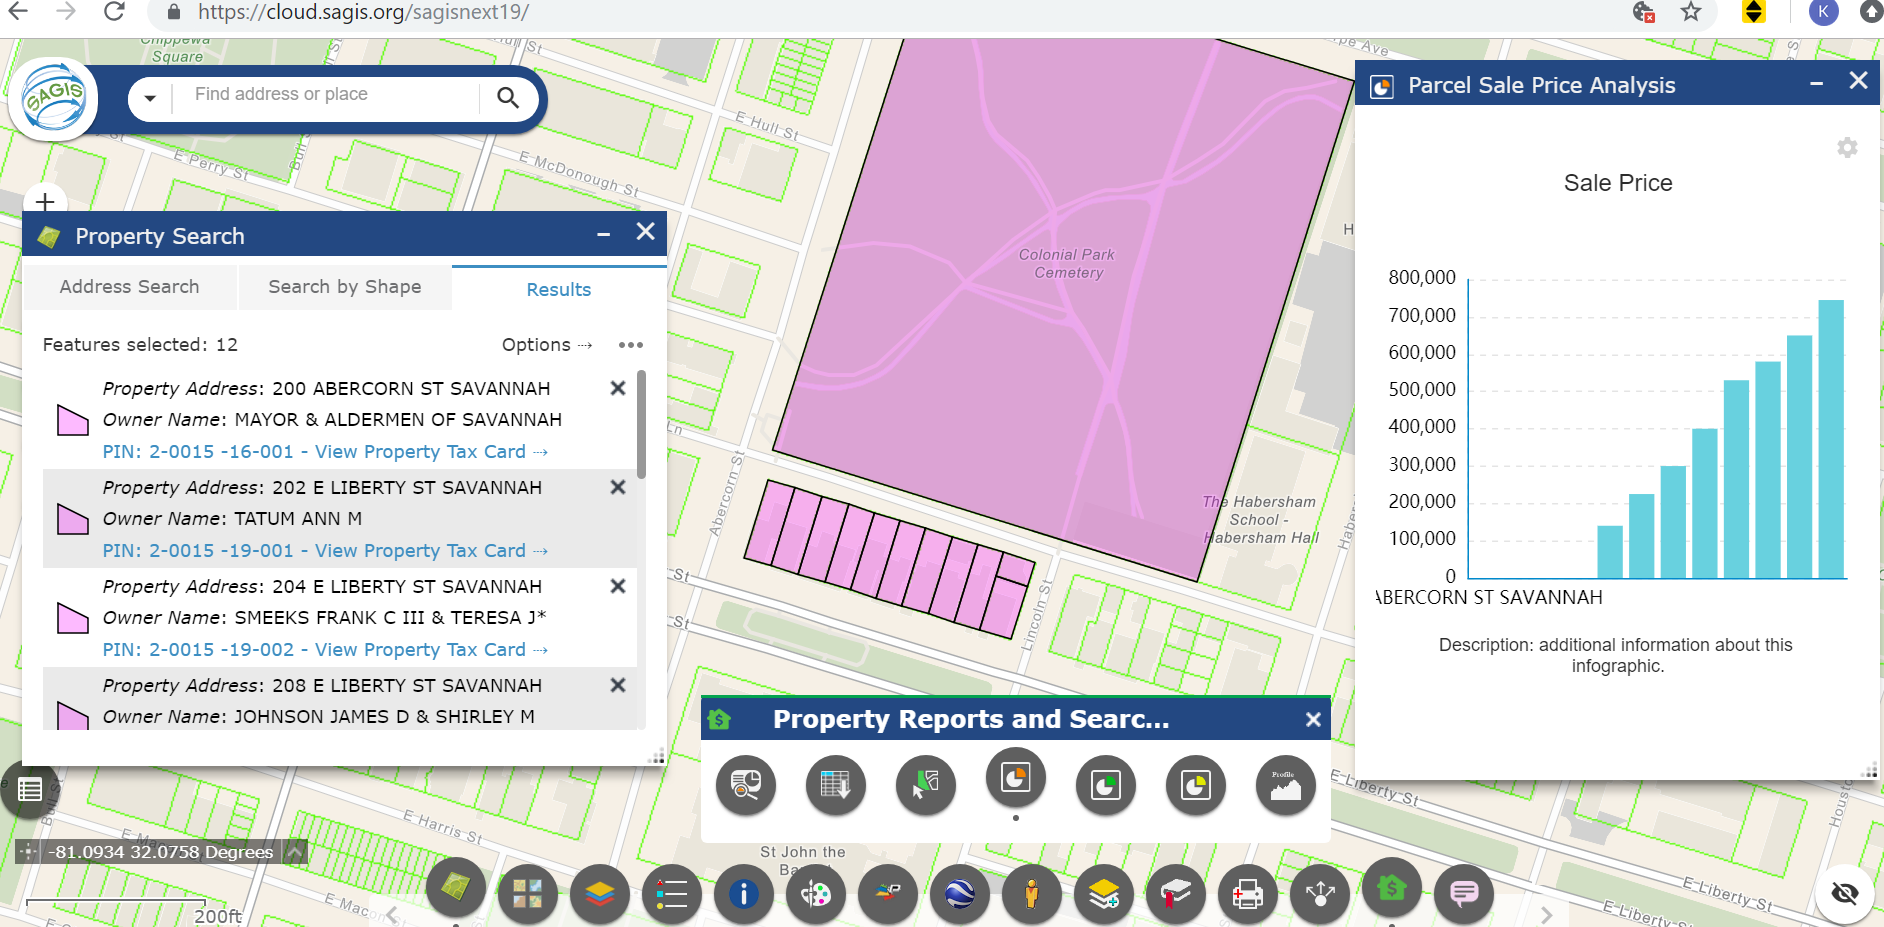
You can link eSearch to the out-of-the-box Infographic widget in Web App Builder.
For example I linked eSearch for Parcels to Infographics for sale price, land value and real estate value. Seemed kind of similar, does that sound useful?
(I re-named the Infographic widget and gave it a custom icon and cloned it for each of these three chart types)
- Mark as New
- Bookmark
- Subscribe
- Mute
- Subscribe to RSS Feed
- Permalink
- Report Inappropriate Content
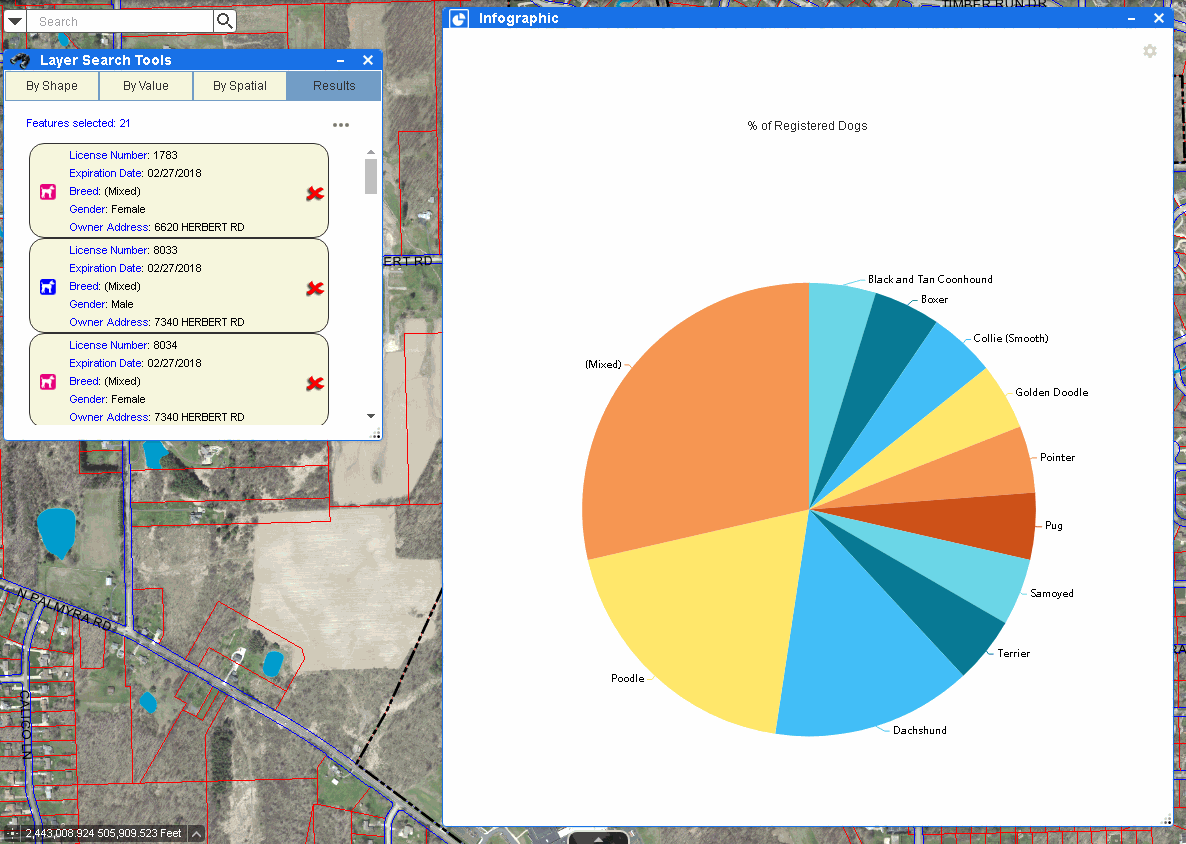
This was a great idea. I ended up using some Dojox/Charting stuff, which was extremely complicated, but it did the trick. Wish I had thought of this earlier. Thanks.
- Mark as New
- Bookmark
- Subscribe
- Mute
- Subscribe to RSS Feed
- Permalink
- Report Inappropriate Content
Hi Justin, Cool. Is your site live that you created the charts for?
- Mark as New
- Bookmark
- Subscribe
- Mute
- Subscribe to RSS Feed
- Permalink
- Report Inappropriate Content
Yes, its up and running, but its an internal/org app.
- Mark as New
- Bookmark
- Subscribe
- Mute
- Subscribe to RSS Feed
- Permalink
- Report Inappropriate Content
I am trying to do basically the same sort of thing.
How do I link the results from the eSearch Widget to open the Infographic Widget
automatically from the selected results?
- Mark as New
- Bookmark
- Subscribe
- Mute
- Subscribe to RSS Feed
- Permalink
- Report Inappropriate Content
Rich Bell in Infographic config select it as the Source.