- Home
- :
- All Communities
- :
- Industries
- :
- Water Resources
- :
- Water Resources Questions
- :
- HRAP (Hydrologic Rainfall Analysis Projection) Tra...
- Subscribe to RSS Feed
- Mark Topic as New
- Mark Topic as Read
- Float this Topic for Current User
- Bookmark
- Subscribe
- Mute
- Printer Friendly Page
HRAP (Hydrologic Rainfall Analysis Projection) Transformation
- Mark as New
- Bookmark
- Subscribe
- Mute
- Subscribe to RSS Feed
- Permalink
- Report Inappropriate Content
I found this about reprojecting it here: http://www.nws.noaa.gov/oh/hrl/distmodel/hrap.htm
But this requires an XMRG file, which was not sent to me.
I am ultimately trying to take the precipitation data and get an Average Yearly Rainfall of each County that the points fall in using a spatial join and the average summary. (or even using Zonal Statistics with the Counties as the zones)
So the question is....If HRAP doesn't have a Transformation, is there a way to do it without an XMRG? And if not, do you think its safe to just ignore the Geographic Coordinate System Transformation warning and let ArcGIS do it's best on the fly? Since this is an average, would it really be that off if I didn't do any transformation? I just want to make sure I'm understanding all of this correctly since I've never worked with hydrologic data before.
Thanks!
- Mark as New
- Bookmark
- Subscribe
- Mute
- Subscribe to RSS Feed
- Permalink
- Report Inappropriate Content
HRAP, cast on the National Weather Service (NWS) 1/40th Limited Fine Mesh, is gridded system used to encode WSR-88D NEXRAD Level II Radar Product Generator (RPG) Precipitation Processing System (PPS) and current Multi-Sensor Precipitation Estimator (MPE) precipitation reporting for each NEXRAD station, and it also is used by the NWS - River Forcast Centers (RFC) for Stage III, now MPE, mosaic precipitation reporting. HRAP grid is a projected in polar stereographic with the North pole arbitrarily assigned Grid cell (4330, 4330), each NEXRAD station is positioned into the same grid, but the RPG generates reports into a 131 x 131 array of HRAP grid cells with the radar located in the local (66,66) cell for its reports. The RFC's mosaic each RPG output back to its correct HRAP location and issue Stage III or MPE summaries in full HRAP for their respective reporting areas. That is each NEXRAD site has a reporting grid (fixed at 131x131 cells) and each RFC has a reporting grid (fixed to its reporting area), and also the NWS mosaics input from the RPGs/RFCs into a full CONUS map based all based on HRAP grid, nominal 4km grid.
The HRAP 1/40th Limited Fine Mesh is defined like this.
North Pole Stereographic
Lattitude of origin 90.00
Longitude -105.00
Reference Lattitude 60.00
Earth radius 6371200.000 m
grid cell size 4762.5 m (nominal, actual inscribed length varies with lattitude)
While the NEXRAD radars operate in local polar radial segments and distance bins, HRAP provides an efficient run length encoded mechanism for delivering converted Radar Product Generator radial bin data as compressed Level III grid data reporting--Hourly Digital Precipitation (HDP), Three Hour Precipitation (THP), or Storm Total Precipitation (STP) arrays.
But since xmrg Level III and Stage III/MPE reporting is encoded lowerleft to upper right, it also has to be inverted to load as Esri Grid, done by reversing the read order if you do obtain XMRG (RPG level III/MPE or RFC Stage III/MPE). Also byte order conversion between big-endian (NWS AWIPS HP Workstations) and little-endian (Intel Linux & Windows OSs) formats is required for some of the older XMRG data.
Obtain and have a read of the S. Reed & D. Maidment (April 1999) article Coordinate Transformations for Using NEXRAD Data in GIS-Based Hydrologic Modeling from the Journal of Hydrological Engineering, Volume 4 issue 2, pg 174-182. It will give you an better idea of how to visualize HRAP grid laid over the Polar projection. This is fig 4. from the article (but I've marked it to show the 1/40 LFM values, North pole would be at 4330,4330):
[ATTACH=CONFIG]26298[/ATTACH]
It can be a little confusing, especially if you have to unwind the Run Length Encoding of archival the RPG Level II/III, or RFC StageIII/MPE data. And now, with faster network connections, the HRAP grid based data exchange is being replaced with more real time RPG Level II distribution via the UCAR Internet Data Distribution digital interchange. If interested in that visit the Unidata folks at http://www.unidata.ucar.edu/data/#levelII
Good luck.
Stuart
- Mark as New
- Bookmark
- Subscribe
- Mute
- Subscribe to RSS Feed
- Permalink
- Report Inappropriate Content
I am trying to transform precipitation data I got from NOAA from HRAP into Albers Equal Area Conic (USGS). It is an older file (2005) data that is in a point file (grid). Each point represents the total rainfall (inches) for 2005 for that location. Derived using these methods: http://water.weather.gov/precip/about.php. There are no transformations available for HRAP. I even checked the extensive list here to make sure: http://downloads2.esri.com/support/TechArticles/Geographic_Transformations_10.1.pdf
I found this about reprojecting it here: http://www.nws.noaa.gov/oh/hrl/distmodel/hrap.htm
But this requires an XMRG file, which was not sent to me.
...
Thanks!
In my understanding, the ArcGIS couldn't directly read this radar grid data and this data should convert to ASCII then can be read by ArcGIS--using ArcGIS to import it as feature class - when importing it, its projection should be defined as Polar Stereographic (it is not one ellipsoidal earth model but the spherical earth model (datum is simple, only its radius value and one original point).
(As that link says the ESRI's spherical radius is little different from the HRAP spherical radius, so after imported to ArcGIS, there should be little distortion produced. The ESRI spherical radium couldn't be modified.)
So treat it as normal radar ASCII file (convert to ASCII file first), import it as feature class and define its projection, then reproject it as you want.
- Mark as New
- Bookmark
- Subscribe
- Mute
- Subscribe to RSS Feed
- Permalink
- Report Inappropriate Content
I tried your method, but I have a feeling I am defining it improperly. I exported the shapefile to ASCII using "Export Feature Attribute to ASCII" and made it SPACE delimited. I then opened it in Notepad and saved it as a .txt file. Then in Catalog I created the feature class 'From XY Table' and defined the X (Long) and Y (Lat) fields as well as the coordinate system as North Pole Stereographic. I added this into my mxd just to check it out before projecting it to Albers Equal Area (USGS) and let it transform using the 'WGS 84 ITRF00 to NAD 83' transformation on the fly. It came in far north of my other Albers layers that were already in my mxd.
Any idea what I did wrong?
Thanks,
Jessie
- Mark as New
- Bookmark
- Subscribe
- Mute
- Subscribe to RSS Feed
- Permalink
- Report Inappropriate Content
Hi Tom,
I tried your method, but I have a feeling I am defining it improperly. I exported the shapefile to ASCII using "Export Feature Attribute to ASCII" and made it SPACE delimited. I then opened it in Notepad and saved it as a .txt file. Then in Catalog I created the feature class 'From XY Table' and defined the X (Long) and Y (Lat) fields as well as the coordinate system as North Pole Stereographic. I added this into my mxd just to check it out before projecting it to Albers Equal Area (USGS) and let it transform using the 'WGS 84 ITRF00 to NAD 83' transformation on the fly. It came in far north of my other Albers layers that were already in my mxd.
Any idea what I did wrong?
Thanks,
Jessie
Jessie,
If you couldn't match that HRAP layer and your referenced other Albers layers, one of them should be wrong, and you need to check:
Set up one new data frame and define its projection as North Pole Stereographic, then bring that HRAP point layer in.
Locate one point to compare the map coordinates (X&Y) if match its coordinates from your source table (your converted txt file).
If it matches, it indicates your referenced other Albers layers' source data is not correct .
Otherwise the point converting process is wrong, you should check that "define" process--check if the defined projection parameters matches your source HRAP datum parameters .
Tom
- Mark as New
- Bookmark
- Subscribe
- Mute
- Subscribe to RSS Feed
- Permalink
- Report Inappropriate Content
It sounds as if you are working with AHPS archive data -- specifically the Observed, Yearly Archive, Shapefiles format data. http://water.weather.gov/precip/download.php
The 2005 yearly archive download would be nws_precip_year2date_observed_shape_20060101.tar.gz and extract to nws_precip_year2date_observed_20060101.shp (with helper files)
Those shapefiles are derived from consolidated RFC XMRG formated records and are already projected for you into a HRAP compliant Spherical North Polar Stereographic including a usable .PRJ projection file. It has the correct spherical radius but not the control latitude for HRAP--not critical as the grids are fixed and geographic coordinates already calculated for you--correctly we'll presume. If you look in the Shapefile attribute table for one of the yearly precipitation observed archives, you'll see that in addition to the calculated Lat/Long for the HRAP grid center point you have the actual HRAP grid cell reference for the value. In short you already have the cell values that an actual XMRG StageIII or MPE value report would provide, the grid cells and values that would be extracted by parsing the XMRG's Run Length Encoding. Also, the shapefile point is positioned at the center of the HRAP grid converted from grid Meters to Lat/Long. In other words you do not have to export or manipulate them beyond handling, or not handling, the transform between spherical coordinates and the ITRS/GRS-80 ellipsoid used in Albers Equal Area.
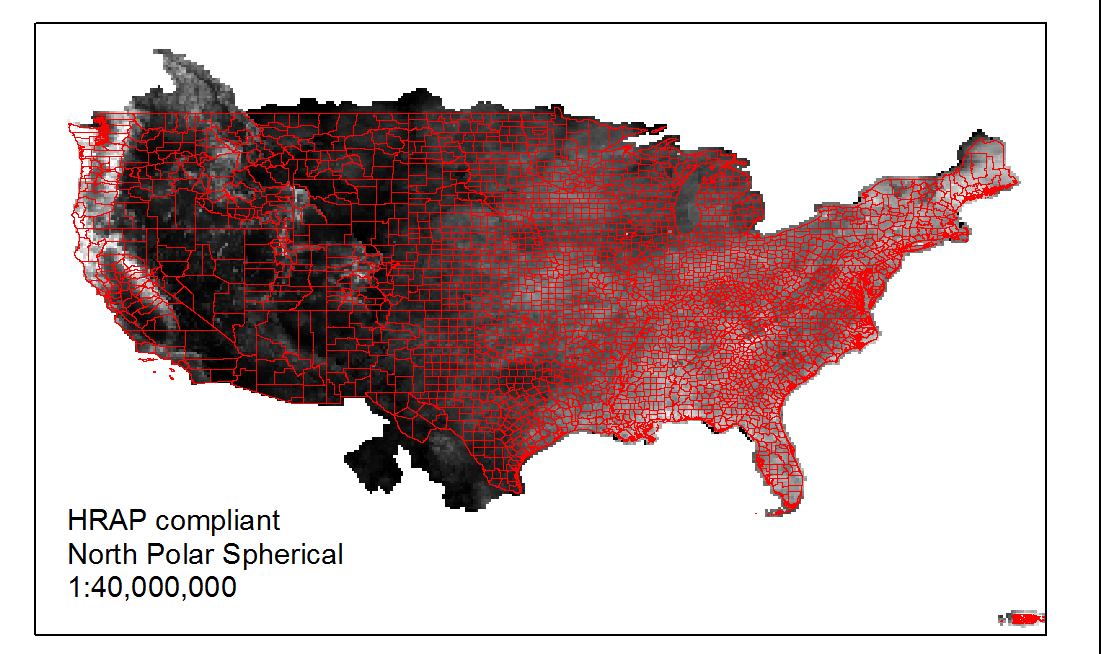
So, you could 1) work backward and reconstruct the HRAP grid, and include reference lattitude of 60 deg and grid length, and then use that to resample from nominal 4K HRAP grids (i.e. 4762.5m at 60 deg north) into a denser, or sparser, raster then projected into Albers Equal Area Conic--review the Reed & Maidment article. Or, 2) you can project the GCS shapefile center points and value into Albers Eaqual Area Conic, not as precise, and interpolate that regular grid into a precipitation surface, and intersect county features against that statistical surface. Or, 3) what is probably simplest just use the HRAP spherical GCS center point and value, and convert directly from feature to raster--but set the cell size against the full range of the AHPS HRAP data set--(found http://water.weather.gov/precip/p_download_new/nws_precip_allpoint.tar.gz ) which would let you normalize the raster across the data sets (yearly, monthly daily), and then project that to Albers Equal Area Conic and intersect that raster with county features.
Here is the 2005 yearly file with option 3, on HRAP sphere as GCS, and then Albers Equal Area
[ATTACH=CONFIG]26483[/ATTACH]
[ATTACH=CONFIG]26480[/ATTACH]
[ATTACH=CONFIG]26481[/ATTACH]
Stuart
- Mark as New
- Bookmark
- Subscribe
- Mute
- Subscribe to RSS Feed
- Permalink
- Report Inappropriate Content
Hi Stuart,
I realize this is a rather old post, but I am working with the daily NWS AHPS Stage III QPE data in shapefile format (pre-March 2017). While I really appreciated your reply (especially helpful in clarifying HRAP meaning), I am still unsure of how to best convert the shapefile points into a raster in ArcGIS based on your reply. I've tried using the "Feature to Raster" GP tool on one shapefile. I get huge grids, something on the order of 33 x 33 km (maybe that's appropriate?).
Focusing on option 3, I'm trying to understand what you mean by "set the cell size against the full range of the AHPS HRAP data set" using the "nws_precip_allpoint_tar" shapefile. How can a vector file have a cell size? Are you just referring to setting the extent of the vector to raster conversion tools in the Environment settings to the allpoint shapefile? Or, is it the cell size taken from the allpoint that's been converted to a raster? If so, do you just use the Feature to Raster Tool and leave the default cell size? Otherwise, re-projection of raster and intersection with vector data seems straightforward. I'm just confused on the best way to convert these shapfiles in a rather obscure projection to a raster useful in analysis. Thanks!!
- Josh
- Mark as New
- Bookmark
- Subscribe
- Mute
- Subscribe to RSS Feed
- Permalink
- Report Inappropriate Content
Wow! thanks! Yes, that is the data I am working with. I was given this data by an individual, so I did not realize it was available on the web. I am terribly sorry to ask more about this, but I have never worked with data that wasn't already defined in a normal coordinate system. When I bring in this HRAP shapefile, it is shifted approximately 7 miles east. When I look at the properties of the file, I do not see the coordinates for the center point that you were speaking of. I'm just guessing that I could use the SHIFT tool in ArcInfo? I'm only an intermediate user, so learning how to do this would be a big help.
Jessie