- Home
- :
- All Communities
- :
- Industries
- :
- Water Resources
- :
- Water Resources Questions
- :
- Re: An issue regarding Flow Direction from a PhD s...
- Subscribe to RSS Feed
- Mark Topic as New
- Mark Topic as Read
- Float this Topic for Current User
- Bookmark
- Subscribe
- Mute
- Printer Friendly Page
An issue regarding Flow Direction from a PhD student
- Mark as New
- Bookmark
- Subscribe
- Mute
- Subscribe to RSS Feed
- Permalink
- Report Inappropriate Content
Hello,
I am a PhD student in the UK and my project currently involves assessing how a certain species selects habitats. One variable of mine that is incredibly important (towards the species) regards water systems (mostly rivers and streams). So, I have a DEM (30 metre resolution) and from that, I was able to create a river and stream map for the area (as there is no available data on these variables for that region). Here is exactly what I did:
- got the DEM (30 m resolution and used fill)
- used the fill data to get flow direction
- flow direction to flow accumulation
- used raster calculator to assess accumulation grid (log10 ("accumulation grid data")
- took that log10 accumulation data (thus showing the smaller drainage areas)
- considered hill slope via raster calculator CON(log10data >=2, log10data)
So, that actually worked for the most part. I forgot to mention that there is an old map with river and stream systems and they match up very well. However! There is one huge issue. It turns out..the saltpans in the area (which I guess are very flat, although, I never visited them) have been completely distorted. When I complete the watershed analysis, it essentially, creates a huge (and weird) region where the saltpans are filled. I have asked a GIS specialist at my department and he was unsure how to fix this. my projections are correct, and in so far, I cannot think on how to fix this. I'v attached some photos (and links to photos) below that display my results. I have been pondering about this for quite some time and any suggestions would be incredibly appreciated.
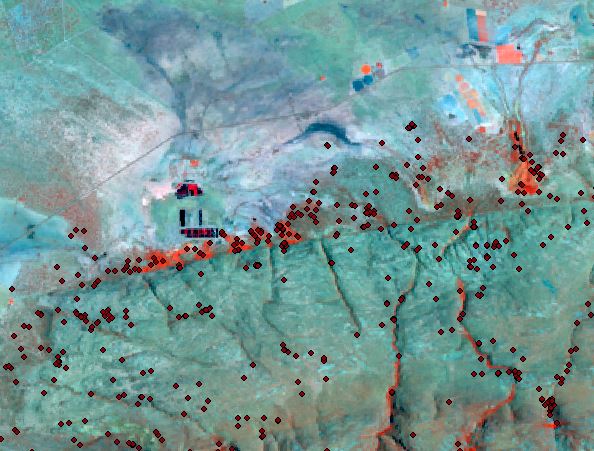
these are the saltpans
[here is the flow direction pic]http://i.imgur.com/ukuOEoT.jpg[/img]
- Mark as New
- Bookmark
- Subscribe
- Mute
- Subscribe to RSS Feed
- Permalink
- Report Inappropriate Content
From the help
Flow Direction—Help | ArcGIS for Desktop
It may be important to consider that in the flatish areas, there may be some confusion
- If a cell has the same change in z-value in multiple directions and is not part of a sink, the flow direction is assigned with a lookup table defining the most likely direction. See Greenlee (1987).
Did you compute the optional output drop raster to assess...
"The drop raster returns the ratio of the maximum change in elevation from each cell along the direction of flow to the path length between centers of cells, expressed in percentages."
It may be worth examining/isolating the areas that you know aren't going to yield similar results to those with more pronounced terrain variations.
- Mark as New
- Bookmark
- Subscribe
- Mute
- Subscribe to RSS Feed
- Permalink
- Report Inappropriate Content
Thank you so much for your response.
I am pretty new at GIS so could you explain how to isolate these areas? (even if its from a youtube video or something)
- Mark as New
- Bookmark
- Subscribe
- Mute
- Subscribe to RSS Feed
- Permalink
- Report Inappropriate Content
I'm not entirely sure that the flow direction grid is incorrect. The way the salt flats are represented look very similar to how a water body would be represented, which makes sense. A lot of what was within the salt flats may have been filled in as a depression.
Also, i would look at the year the DEM was created vs the year the imagery was created. It looks like there is some sort of levee or road through the salt marsh that i'm not seeing in the aerial imagery. Can i get a long/lat for the location of this image.
- Mark as New
- Bookmark
- Subscribe
- Mute
- Subscribe to RSS Feed
- Permalink
- Report Inappropriate Content
Overall,
the flow direction is actually very much spot on! (which I am happy to say about!)
It is only for this region..and I guess, I only really notice that the salt pans stick out when I calculate the flow direction (as it is more pronounced).
Since I am a novice at GIS, I can only give you a datapoint for one of the collared focal species while he is near the salt flats. here it is:
X 737394.8092
Y 7458358.817
I am working in South Africa (WGS 1984 UTM 35S)
- Mark as New
- Bookmark
- Subscribe
- Mute
- Subscribe to RSS Feed
- Permalink
- Report Inappropriate Content
Here's the coords in dd if it helps anyone:
-22.95694, 29.31528
- Mark as New
- Bookmark
- Subscribe
- Mute
- Subscribe to RSS Feed
- Permalink
- Report Inappropriate Content
thank you, Chris
- Mark as New
- Bookmark
- Subscribe
- Mute
- Subscribe to RSS Feed
- Permalink
- Report Inappropriate Content
Hello,
I am still attempting how to work with this data to create this river and stream layer. In so far, no luck 😕
I tried several things including going into Raster Calculator and using flow acceleration > 3000, 2000, and 4000.
None of them had any impact on the smaller streams and only flow acceleration > 2000 got rid of the salt flats (with the expense of the smaller streams).
- Mark as New
- Bookmark
- Subscribe
- Mute
- Subscribe to RSS Feed
- Permalink
- Report Inappropriate Content
How are you sure that the flow direction pattern you are seeing for the salt flats isn't correct?
- Mark as New
- Bookmark
- Subscribe
- Mute
- Subscribe to RSS Feed
- Permalink
- Report Inappropriate Content
Hi Alec
I'm a GIS Engineer at Aurecon South Africa, Cape Town and I specialize in hydrological and hydraulic modelling. If you could send me shapefile or kml file of the extent of your study area, I'd like to see if I can help you out.