User Conference Blog

cancel
Showing results for 
Show  only  | Search instead for 
Did you mean: 

Other Boards in This Place

Latest Activity

(126 Posts)
CandaceLoya
Occasional Contributor III

We wrapped up Day 3 with a few evening activities. Check out the Esri UC 2018 Day 3 Daily Updates‌.

And in case you missed any of our other updates, enjoy.

https://community.esri.com/community/events/user-conference/blog/2018/07/02/live-from-the-2018-user-... 

https://community.esri.com/community/events/user-conference/blog/2018/07/09/live-from-the-2018-user-...

https://community.esri.com/community/events/user-conference/blog/2018/07/09/live-from-the-2018-user-...

https://community.esri.com/community/events/user-conference/blog/2018/07/10/esri-uc-day-2-updates?sr... 

https://community.esri.com/community/events/user-conference/blog/2018/07/13/esri-uc-2018-the-final-a...

@EsriGeoNet

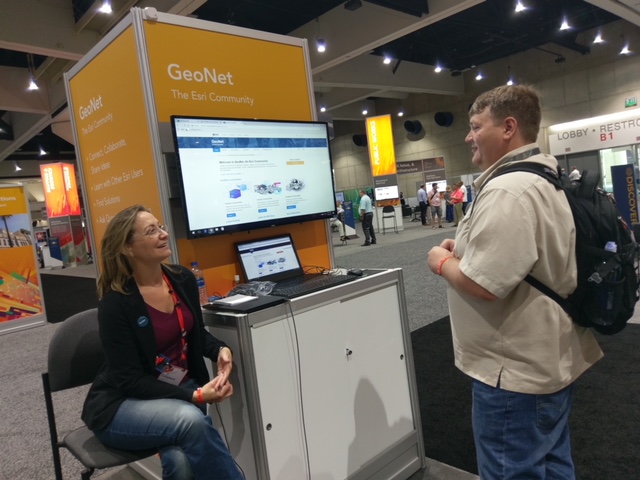
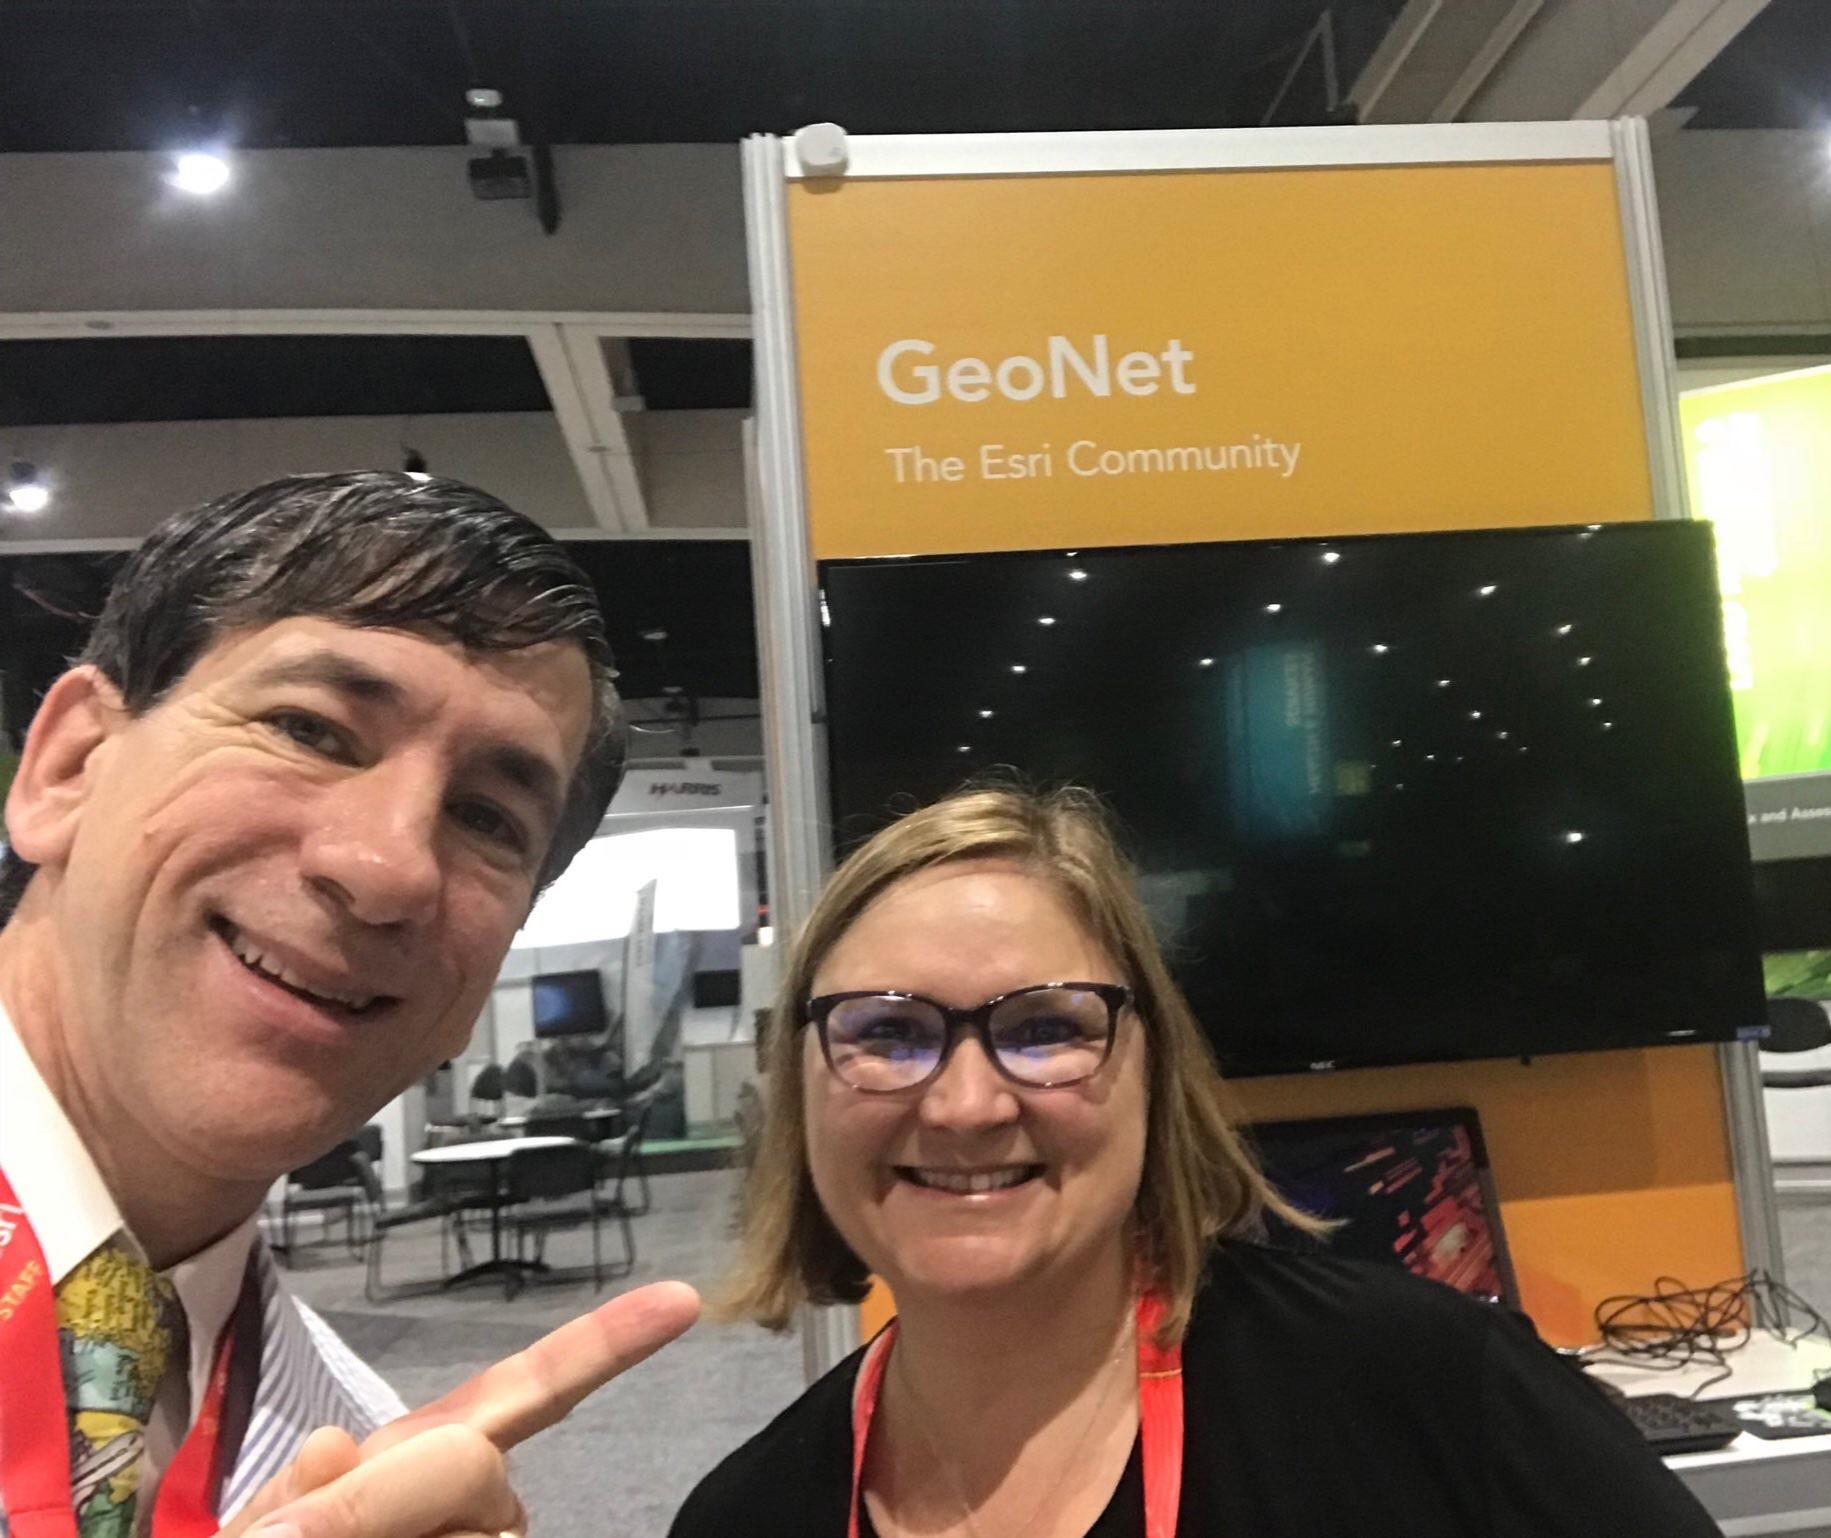
As we quickly approach the final few activities of the User Conference, we spent a few hours at the GeoNet Expo booth meeting with so many attendees and GeoNet members.

Michelle and Chris helping Chris DiDio

Michelle and Chris are helping Chris Di Dio‌.

Candace answering questions

Candace Loya‌ answering questions about GeoNet.

Final GeoNet Meet-Up for UC 2018 

We said farewell to our GeoNet members and non-members at the last GeoNet Meet-Up of the week.

GeoNet Meet-up 071222018

Chris Catania is‌ leading a chat with GeoNet members at the Thursday GeoNet meet-up.

GeoNet Meet-Up Photo with member at UC 2018

GeoNet members are finally putting a face to the names they see in the Community.

GeoNet Meet-Up Photo at UC 2018

Chatting with GeoNet Champion Adrian Welsh

GeoNet meet-up with members

Chris Catania‌ talks GeoNet with Andrew

MOOC Meet-Up

Written by Adena Schutzberg, MOOC Program Manager


The MOOC team hosted its first MOOC Meet-Up at the Esri User Conference. We so enjoyed meeting our online students face to face!


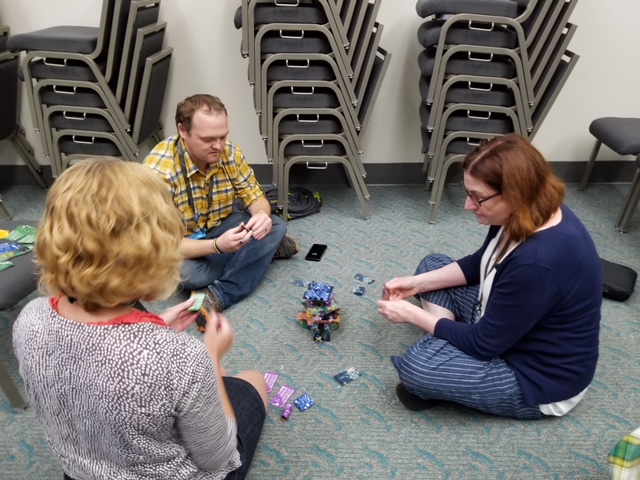
In our MOOCs, we encourage students to help one another out and to learn together. We brought that spirit to the MeetUp and urged attendees to team up to build structures with our multicolored MOOC business cards. Among the entrees were a replica of Padres Stadium, a model of the recent Hawaii earthquakes, a woven tapestry and a campground. We awarded each member of the team behind our favorite creation, which used the cards in multiple ways, a copy of Ken Field’s new Cartography. Book.

Build something winners

The winning team rolled, bent and flexed MOOC business cards into this 3D structure.

I shared a few facts and figures about our MOOC students in the past four years:


  • Our instructor taught 133, 000 students
  • Students earned 27,000 Certificates of Completion
  • We’ve offered 22 MOOCs


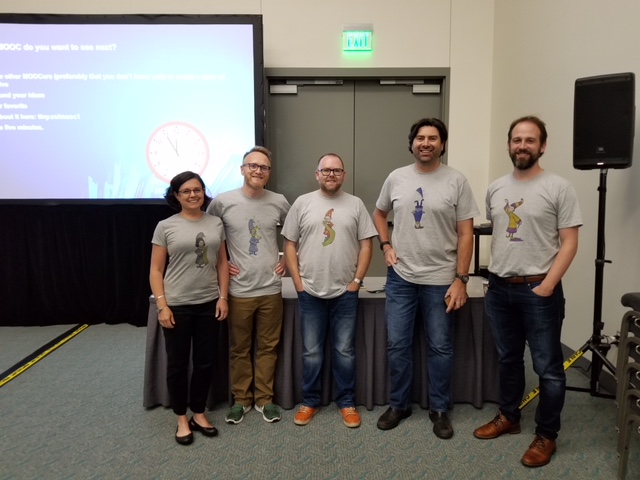
The highlight for attendees, I think, was meeting their instructors, and some of the “behind the scenes” MOOC team members. The five Cartography. Instructors, decked out in their “wizard” T-shirts said hello, as did Brendan O’Neill, instructor of Do-it-Yourself Geo Apps and Kevin Butler, instructor of Earth Imagery at Work. Linda Beale, who set the bar high with the Esri’s first MOOC, Going Places with Spatial Analysis, literally ran in from another meeting to greet students, and confirm her commitment to developing “season two” of that course. Every instructor gave the nod to longtime MOOC instructional designer Nancy Matheny, who shared that her favorite part of the role was interacting with the very motivated MOOC students in the course forums.


Carto Wizards - MOOC

The five instructors of Cartography. came dressed in their cartography wizards T-shirts. Wesley Jones, far right, drew the cartoons which now grace buttons and stickers.

Our attendees provided some great ideas for future MOOCs that we’ll take into consideration. The MOOC team appreciates students coming out to spend time with us and their passion for learning and helping one another learn. With that good energy, we are ready to get back to work and update existing  MOOCs and make new ones!


Esri MOOCs are free multi-week courses open to anyone. Esri provides all the needed software and licenses, and students can work at their own pace whenever they choose to complete the course content.

Register today to join us for one of our upcoming MOOCs!

Starting September 5 (registration ends September 20)

    
Starting October 31 (registration ends November 15)
   

Thursday Night Party

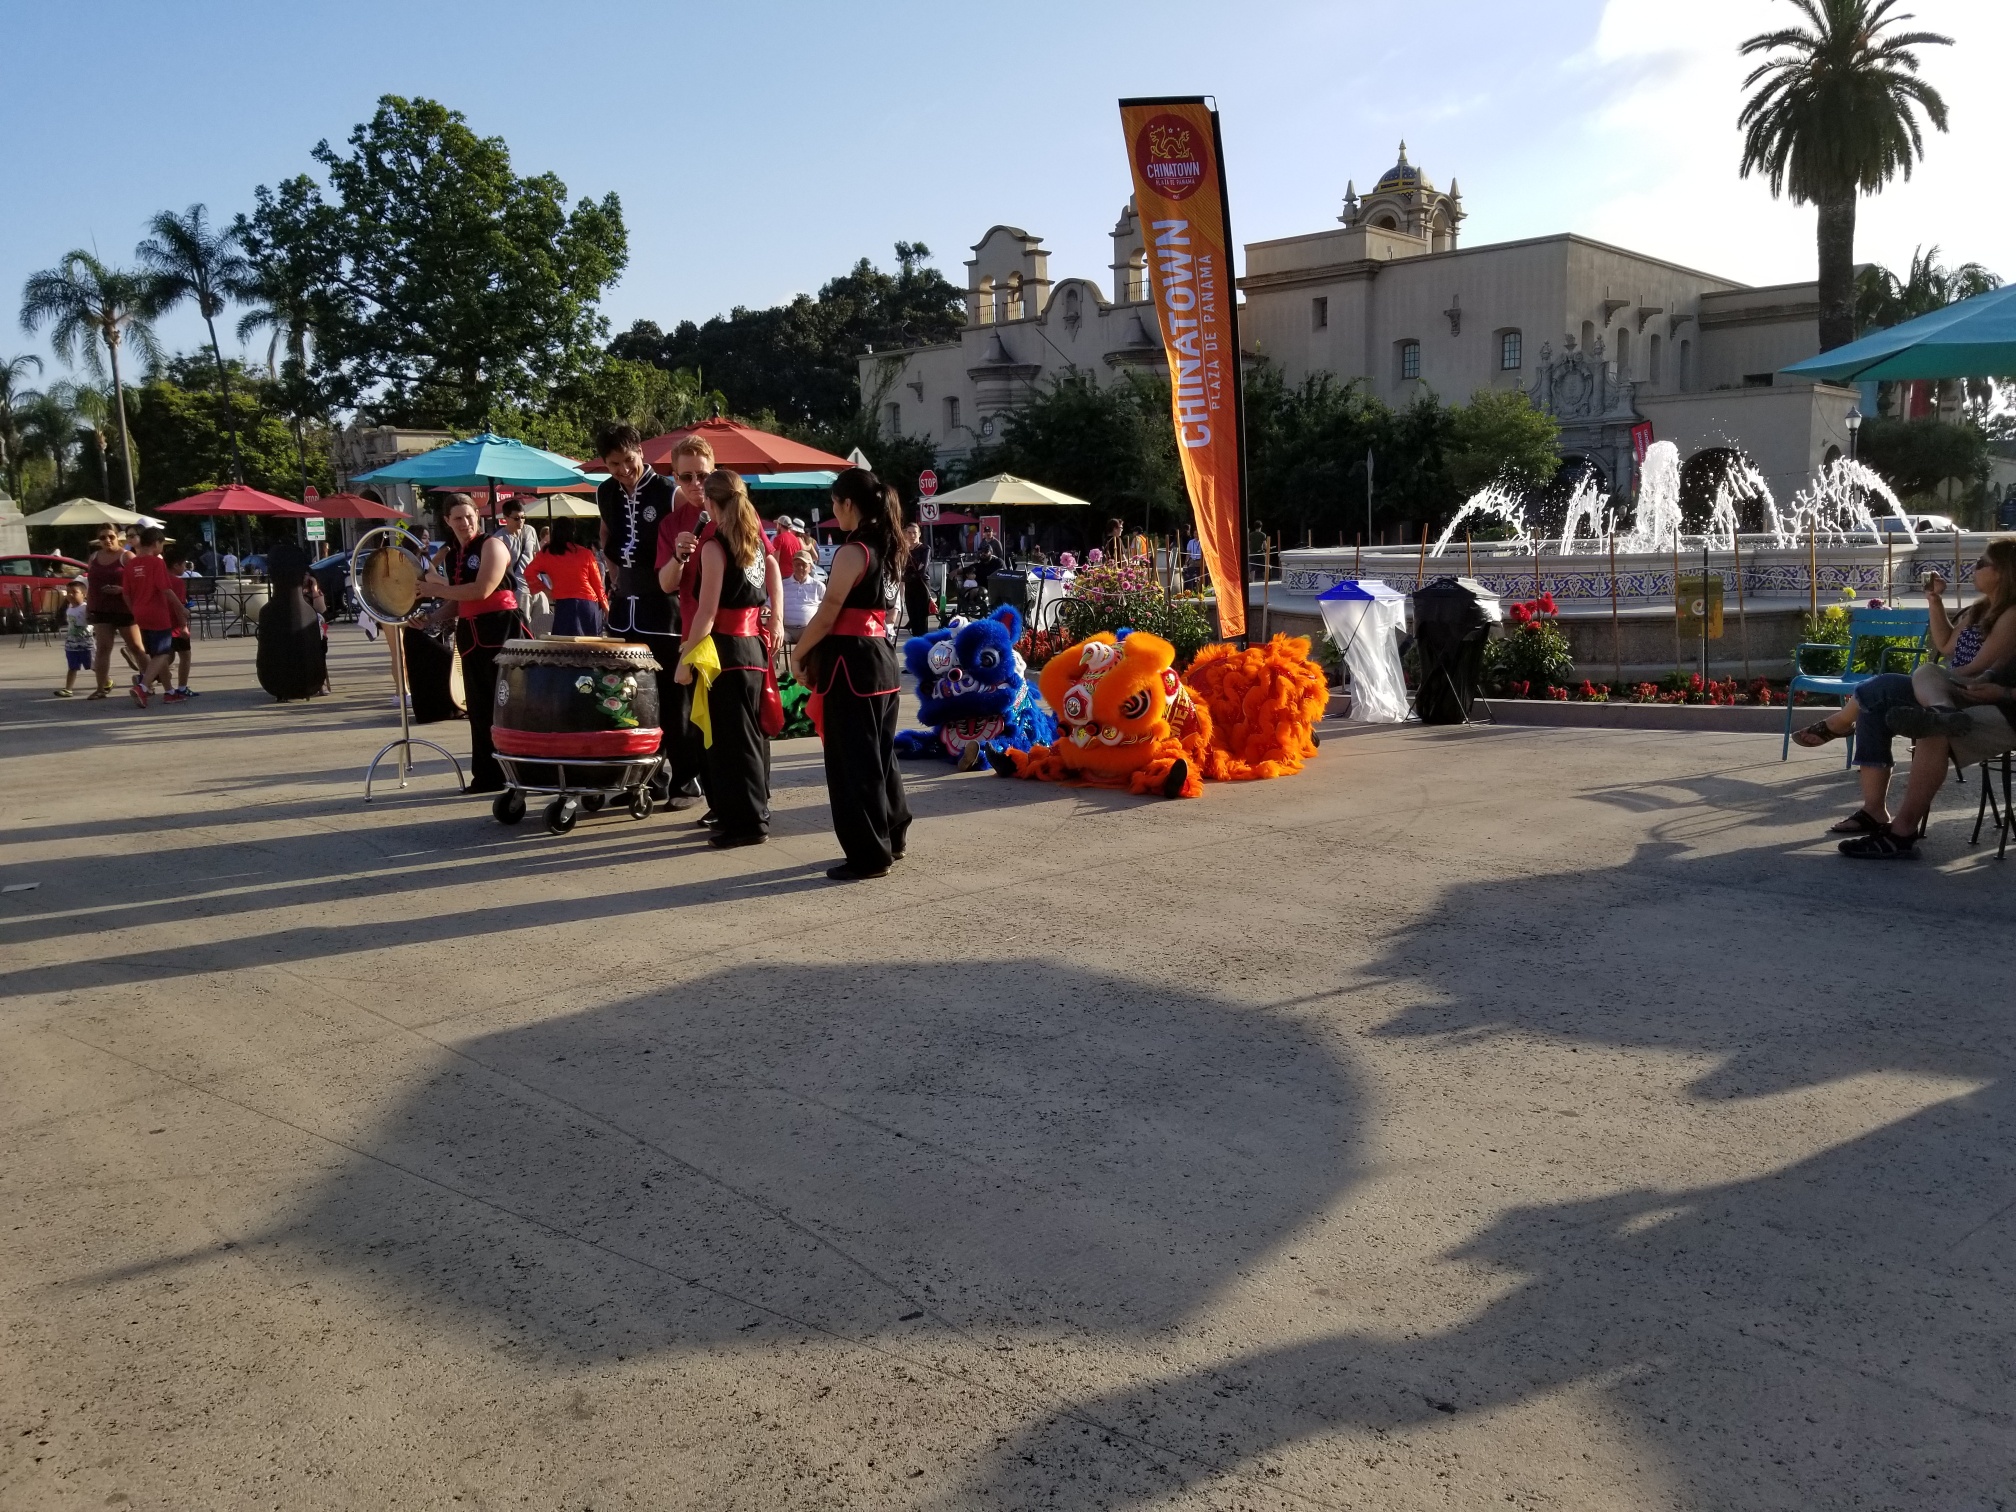
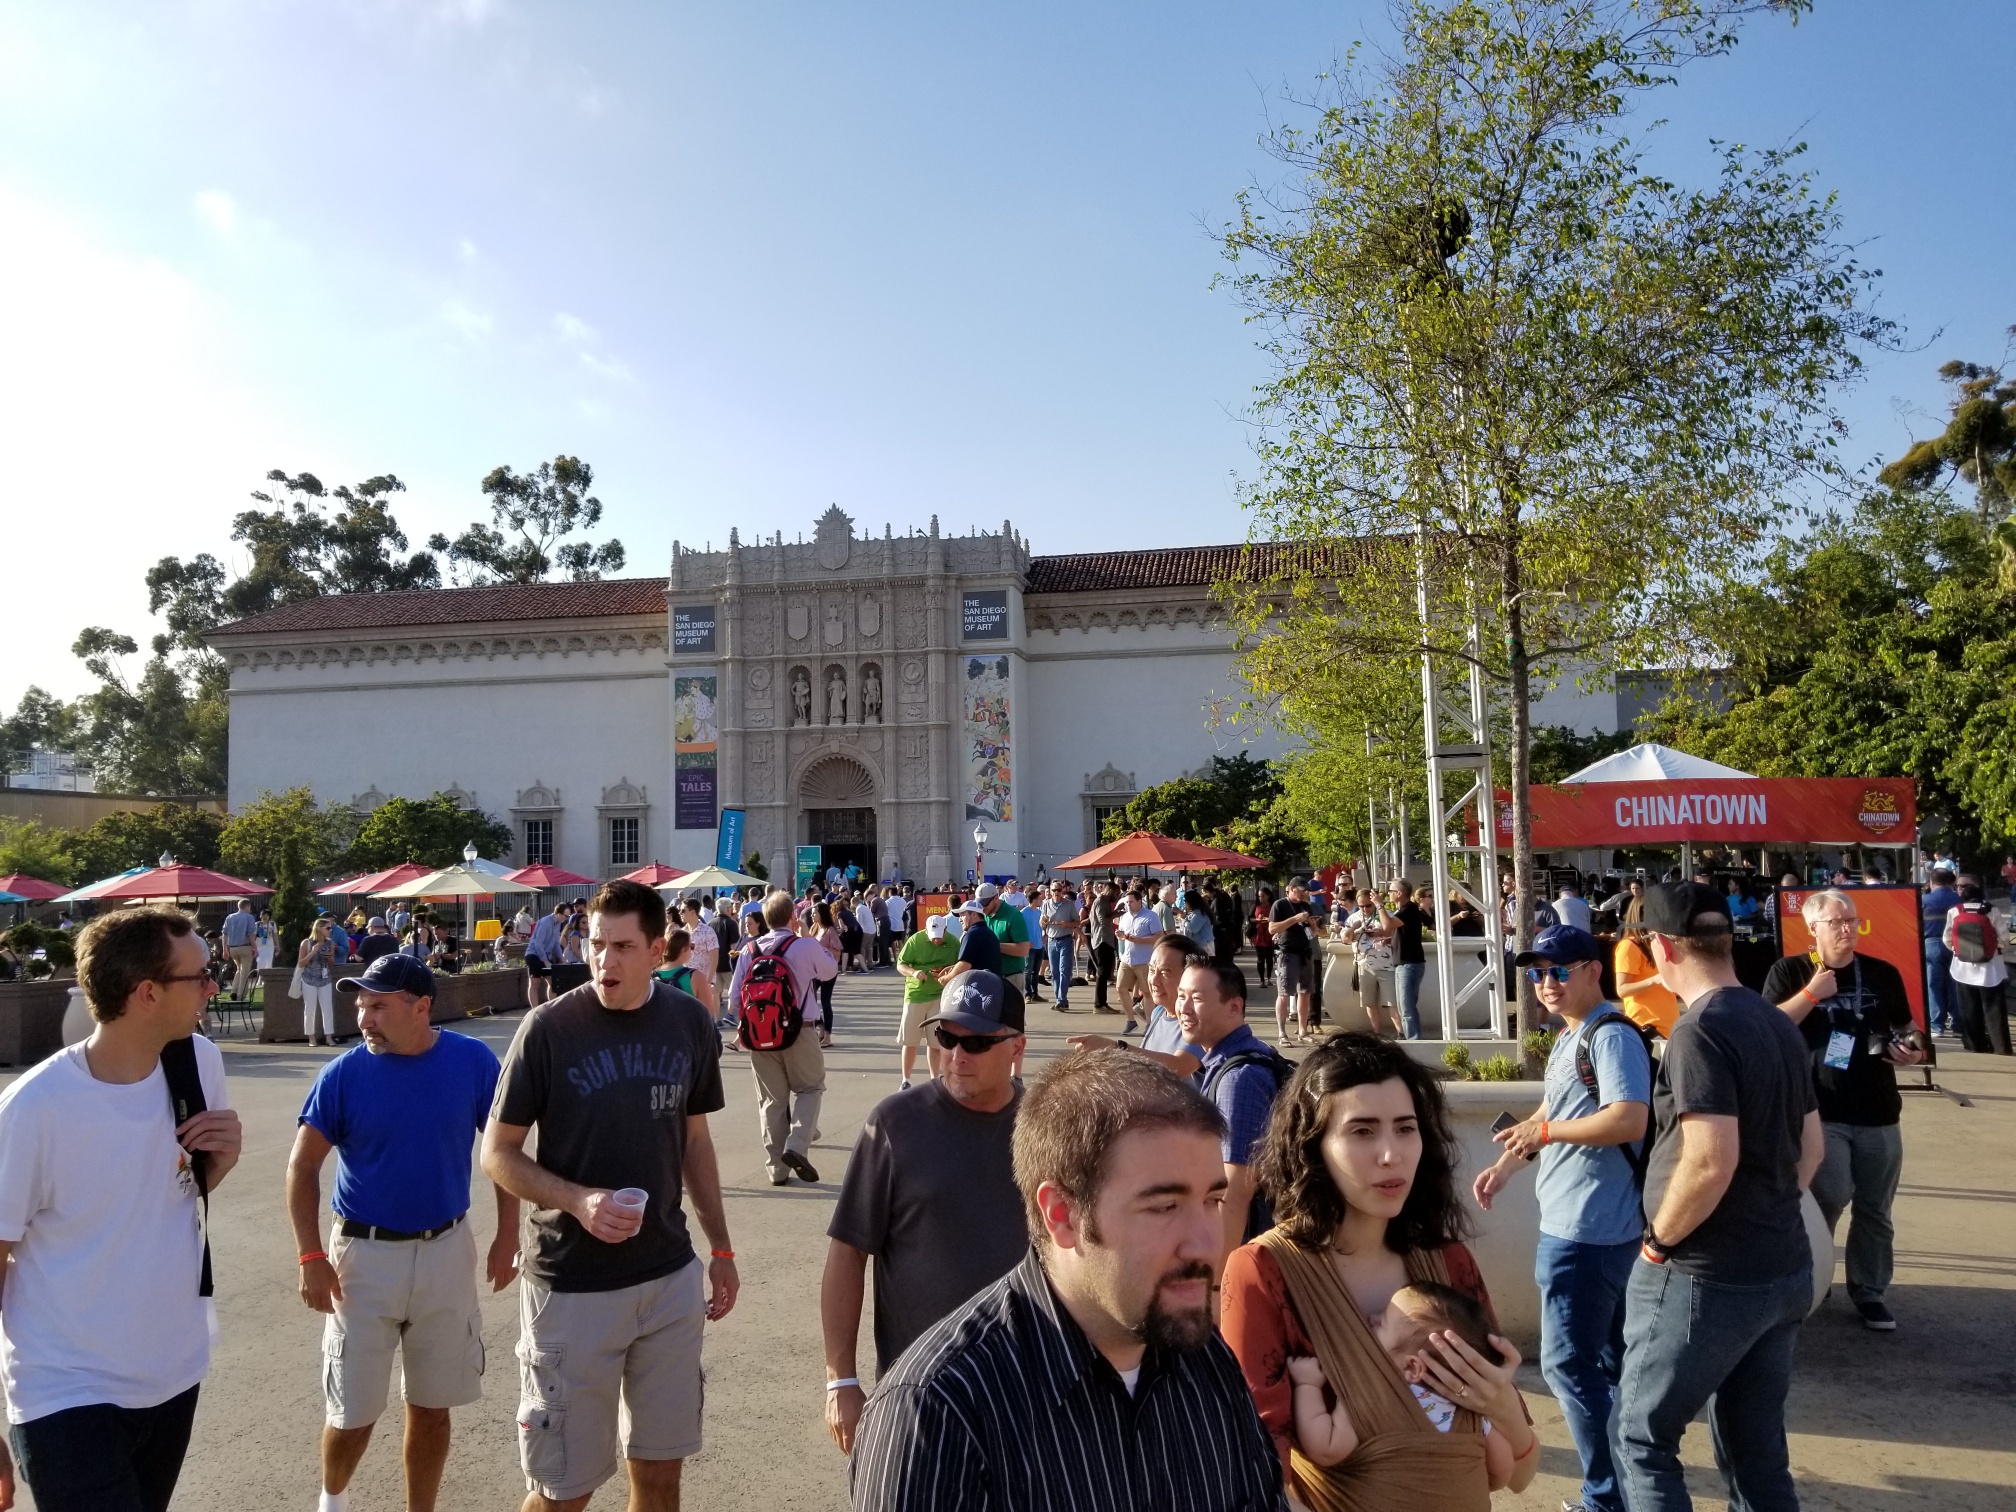
Attendees and Esri staff had some well-earned fun at the Thursday Night party. Many attendees, many families, cute ducklings, so much food, music, museums, and fun.

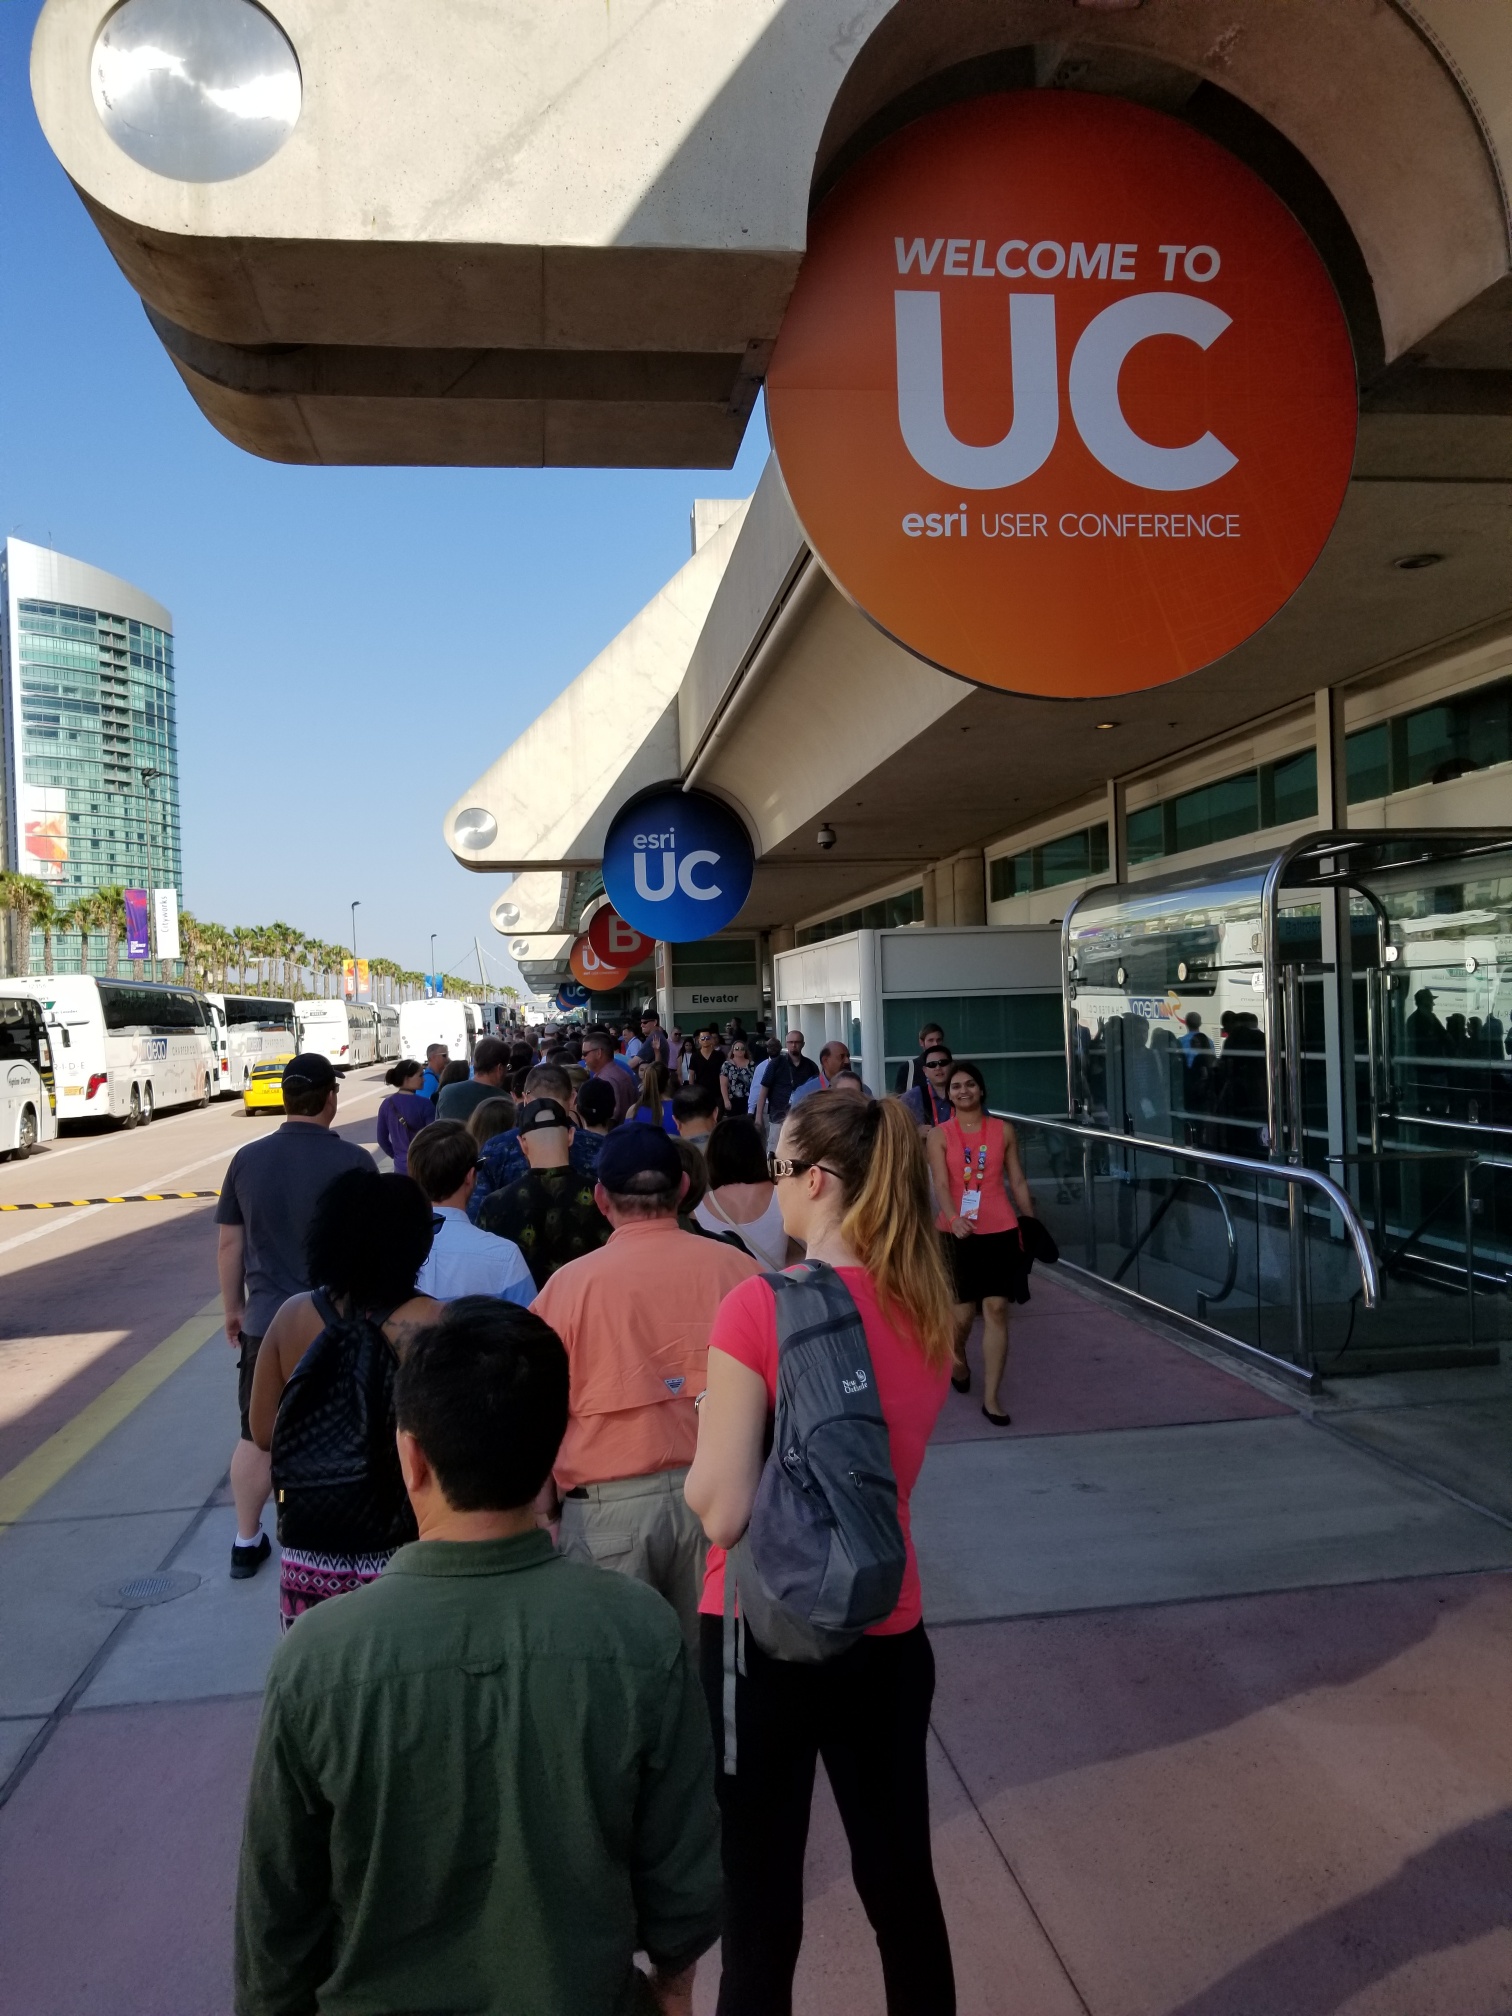
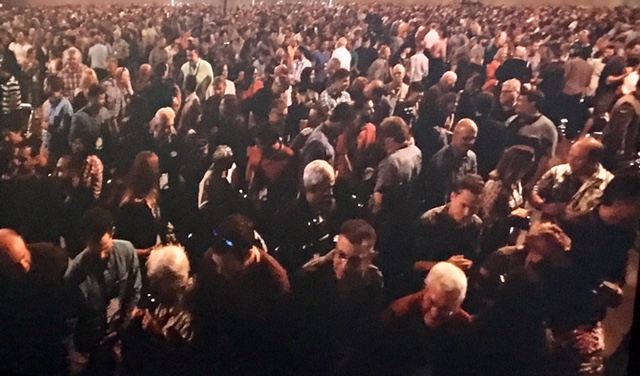
In line for the party bus.

Hundreds of attendees were waiting in line for the party bus outside the convention center. The excitement was in the air.

Romeo

O' Romeo, Romeo. Wherefore art' thou Romeo?

Ducklings at the Esri UC Party

Ducklings at the Esri UC Party

Dragon Dancers

Dragon Dancers in the China Town area

Where is Lara Croft?

Where is Lara Croft?

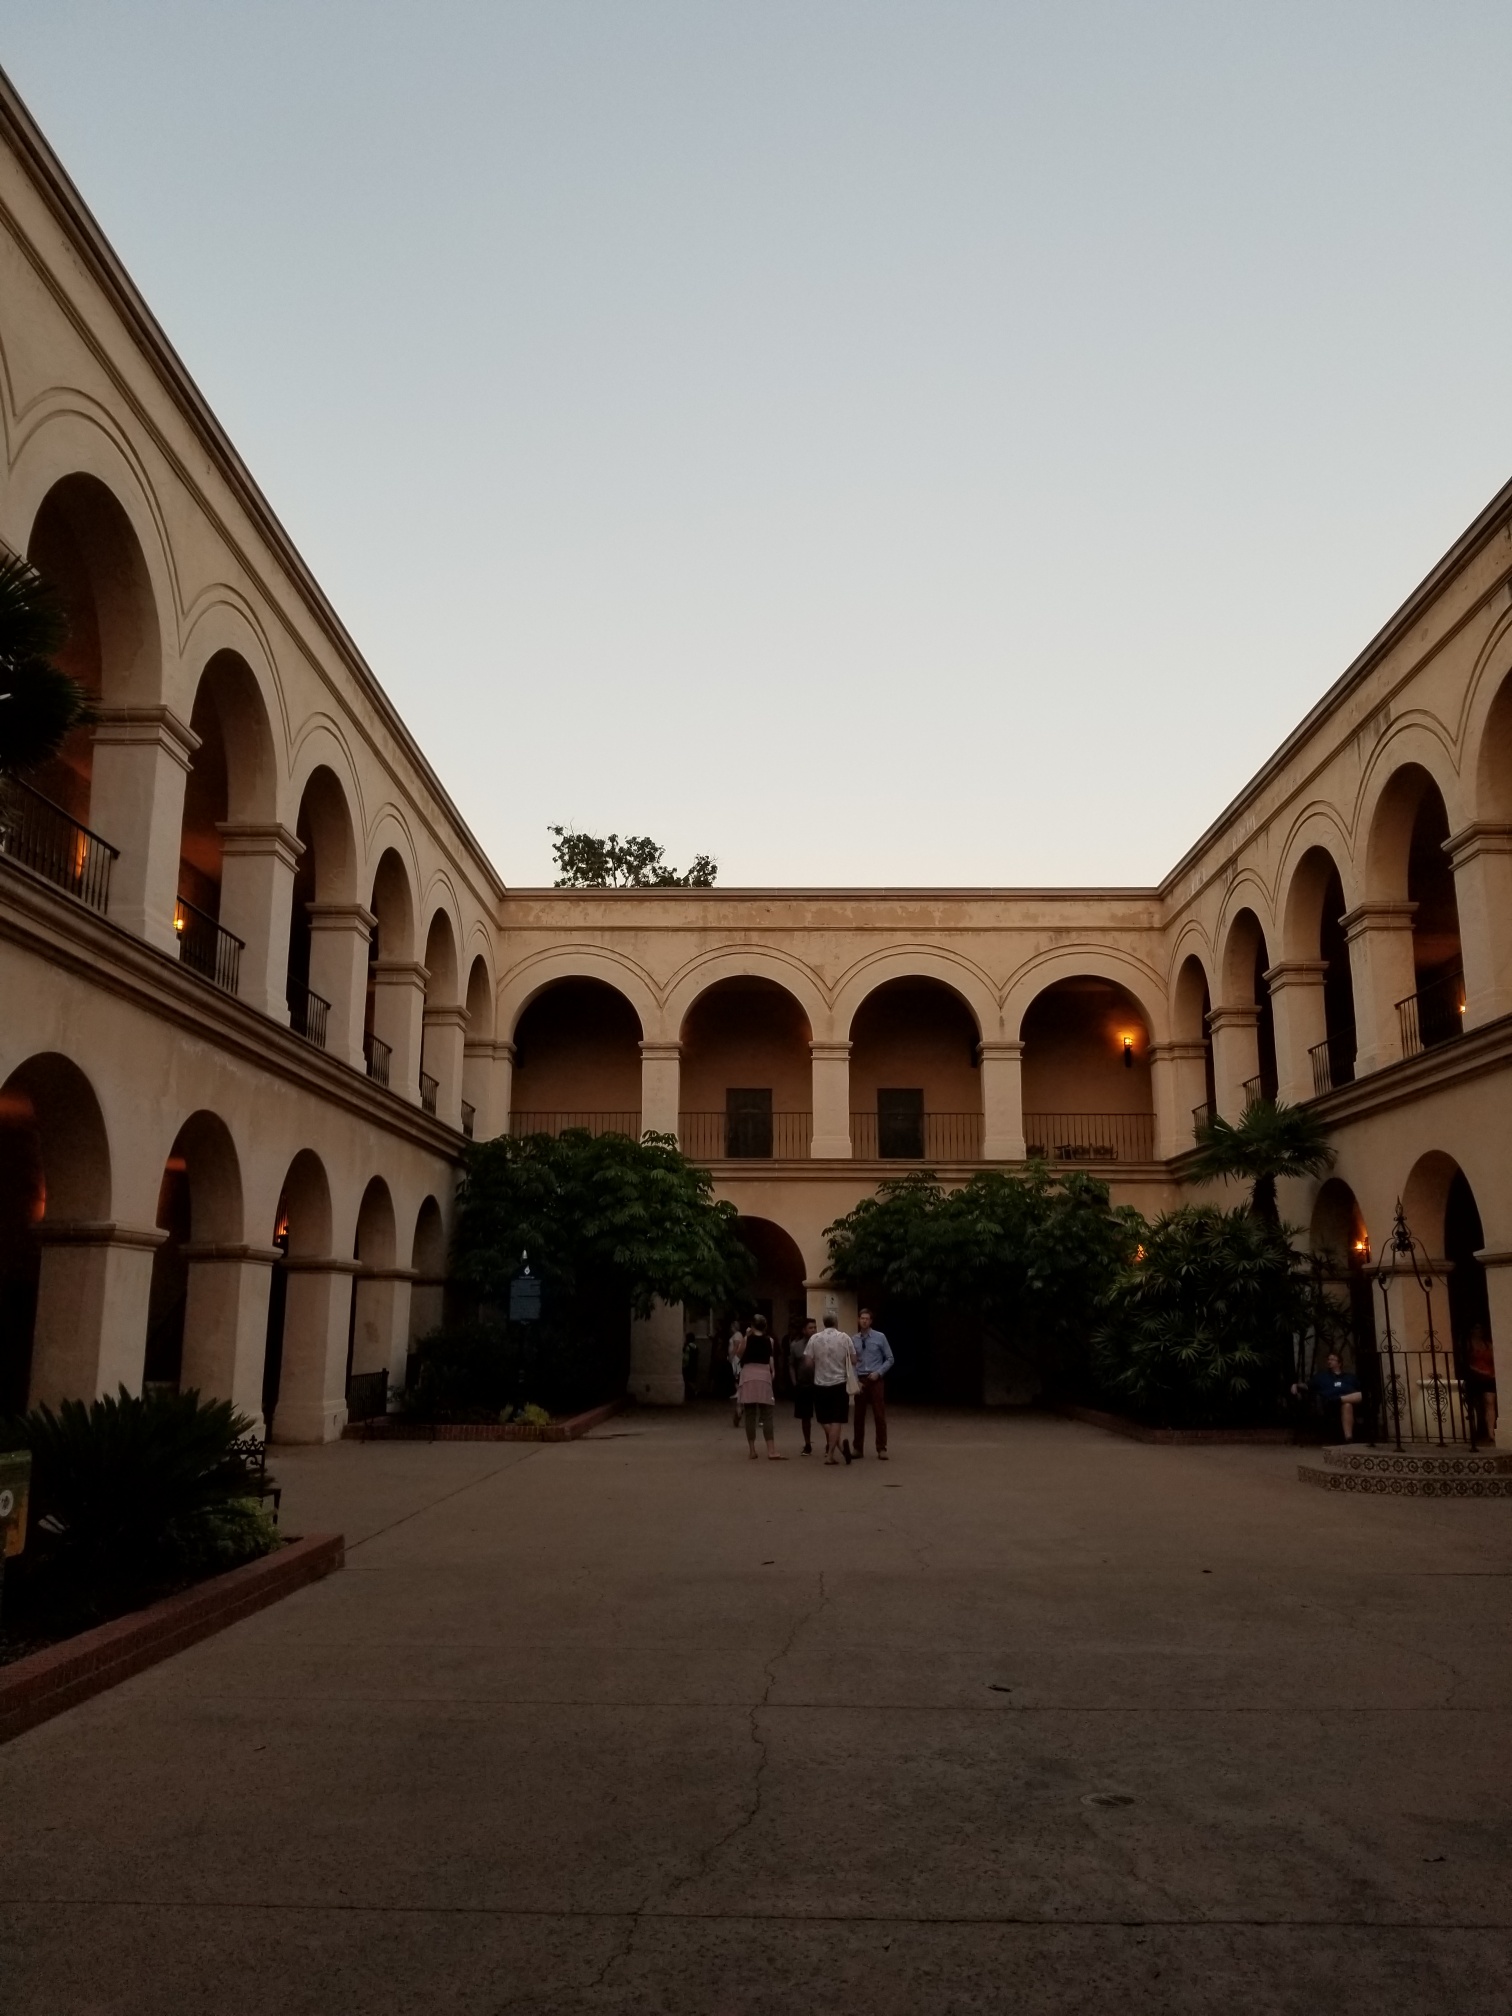
Beautiful architecture

The beautiful architecture was everywhere to behold.

So many attendees

So many attendees. Recognize anyone?

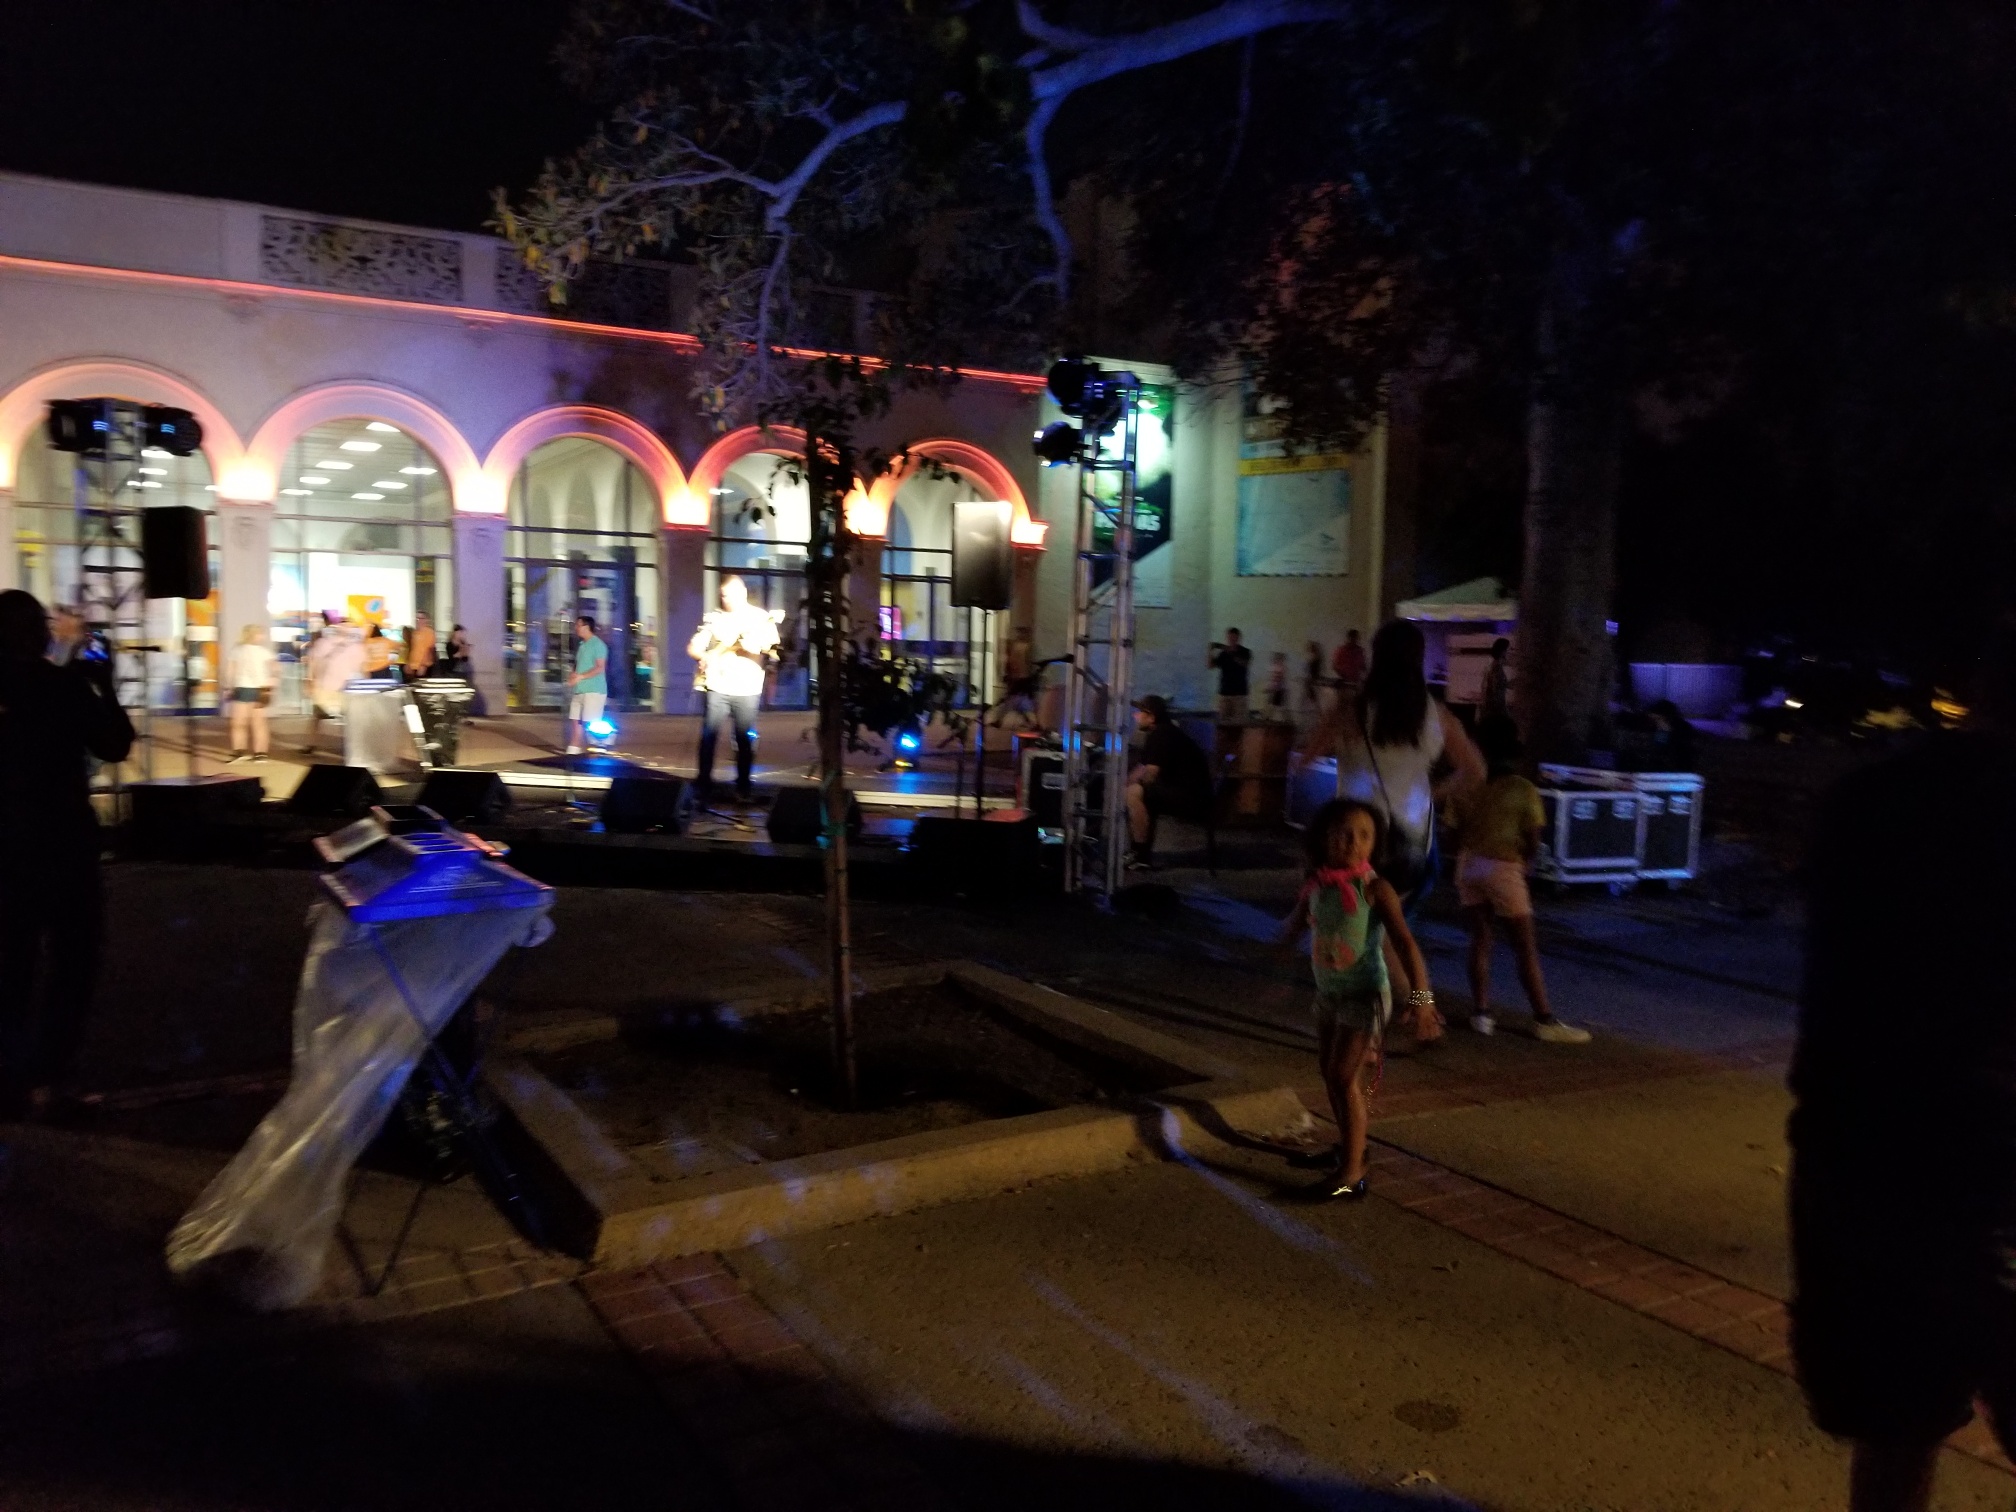
Live music

Live music and beach balls.

Children dancing

Even the kids were dancing.

Shark pool

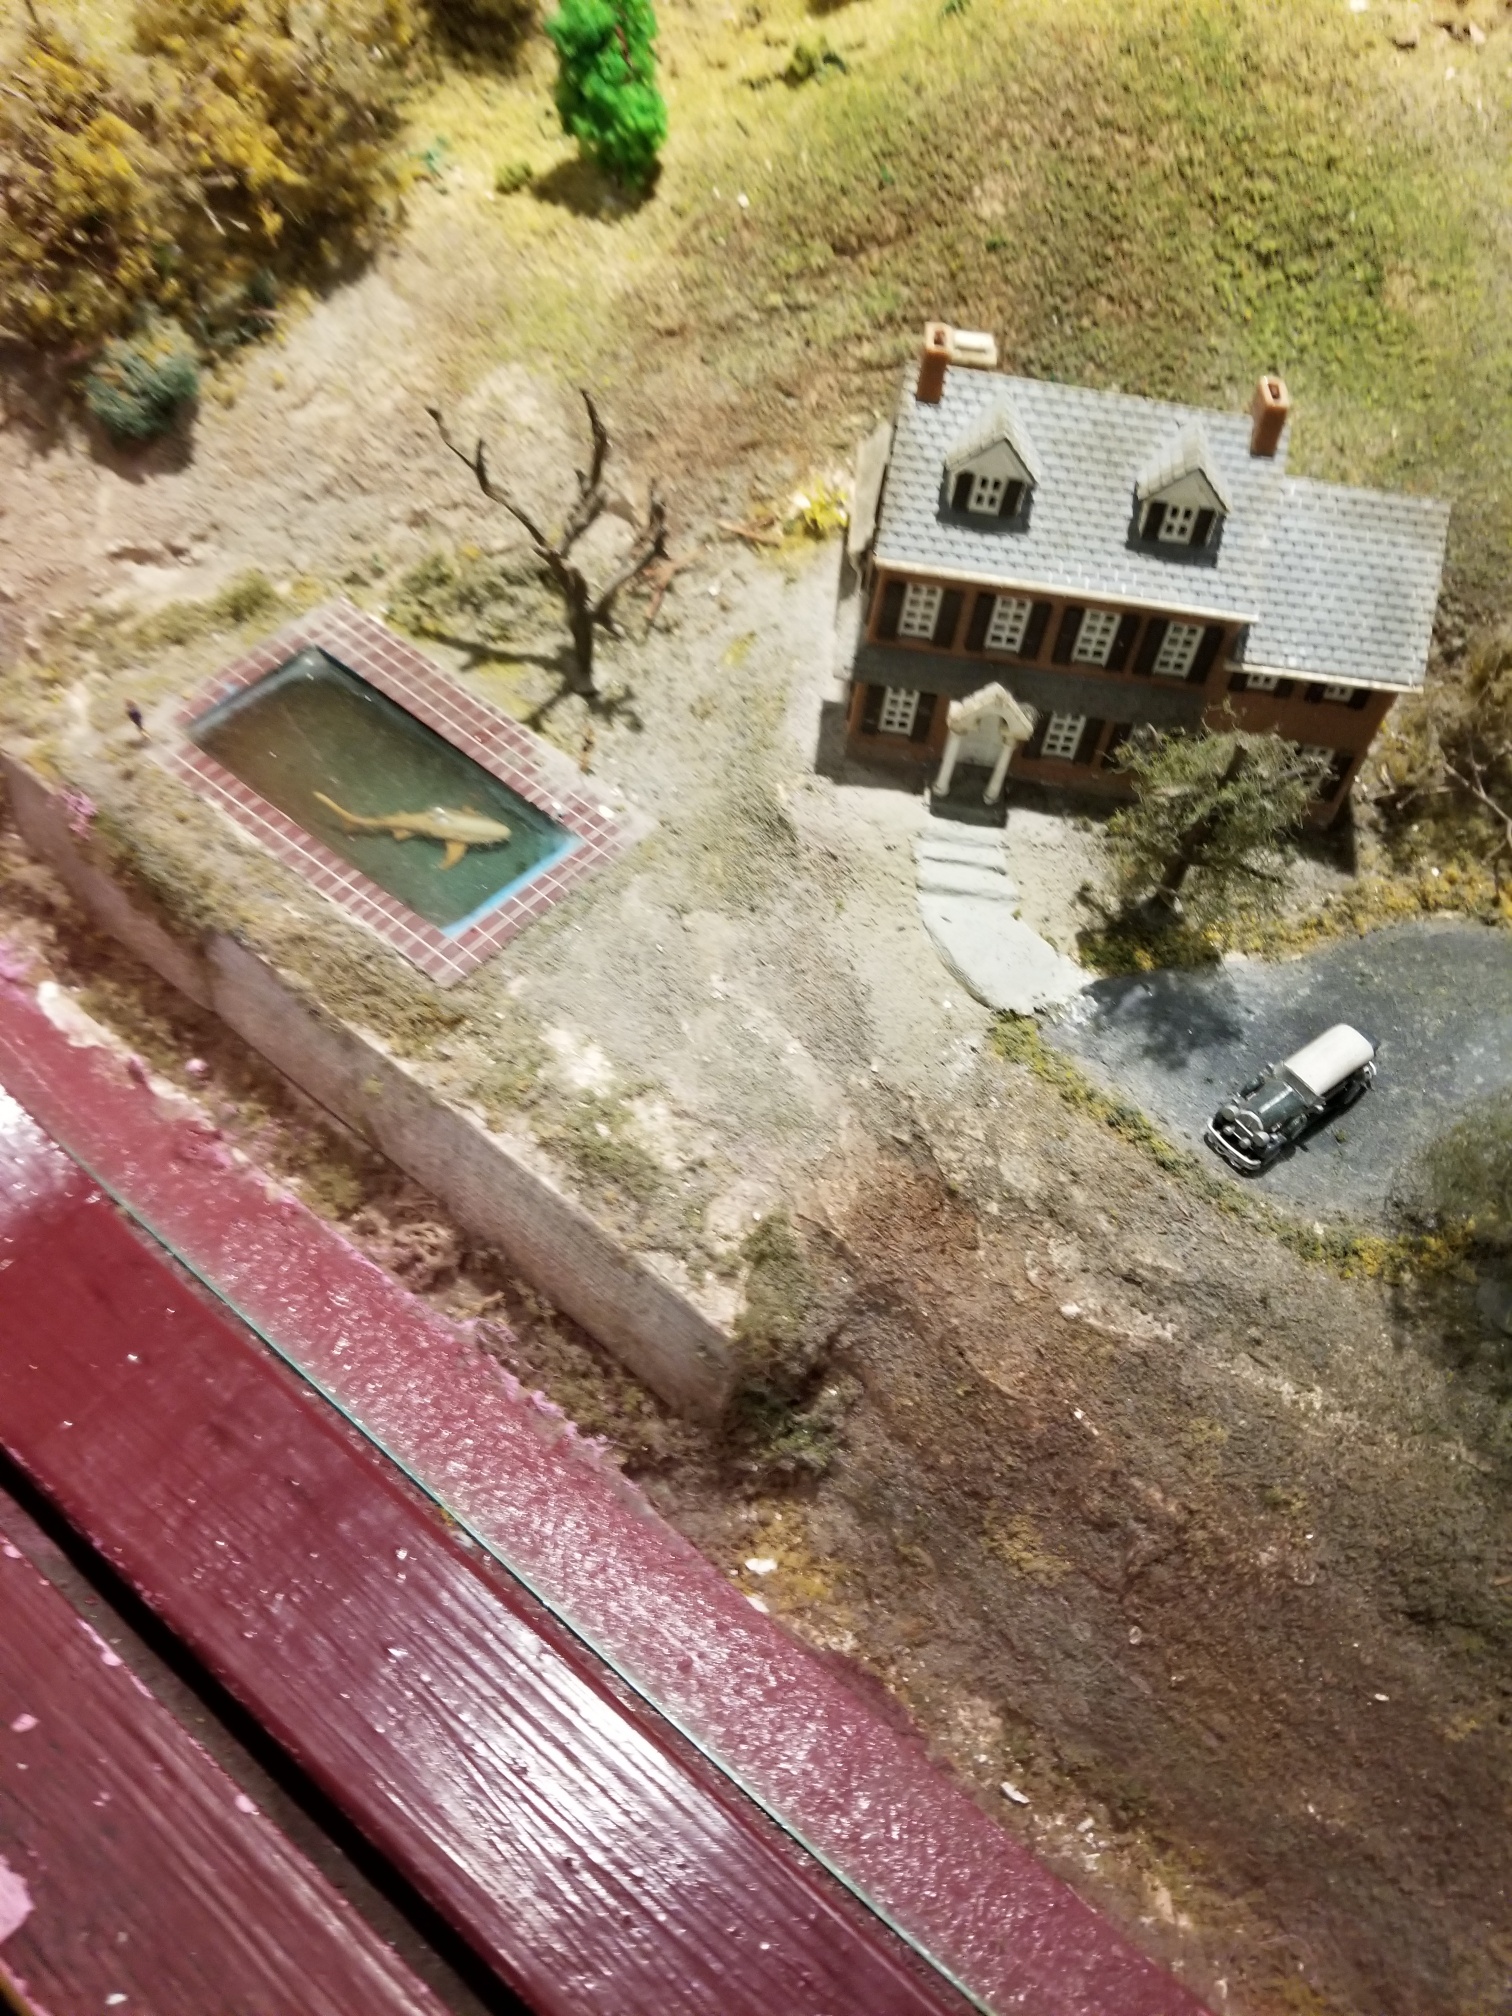
Did you find Waldo at the Train Museum? We know where the Shark was hiding.

And tomorrow we will have the closing session - https://community.esri.com/community/events/user-conference/blog/2018/07/13/esri-uc-2018-the-final-a.... Stay tuned for the final day. 

more
3 2 1,905
CandaceLoya
Occasional Contributor III

Day-3 and we have walked many steps over the last few days. How many of you are reaching more than 15,000 steps before 5 p.m.? Think of all the calories you are burning this week.

We wrapped day 2 with great conversations at the GeoDev Meetup‌ last night. Thank you for the engaging discussion, John Hickok‌. Be sure to tell your students and co-workers about GeoNet. 

Today we bring you so much more as it is our busiest day at the User Conference. The GeoNet team is on the move at our GeoNet Expo booth, at sessions, and at the events.

Esri 5K Run

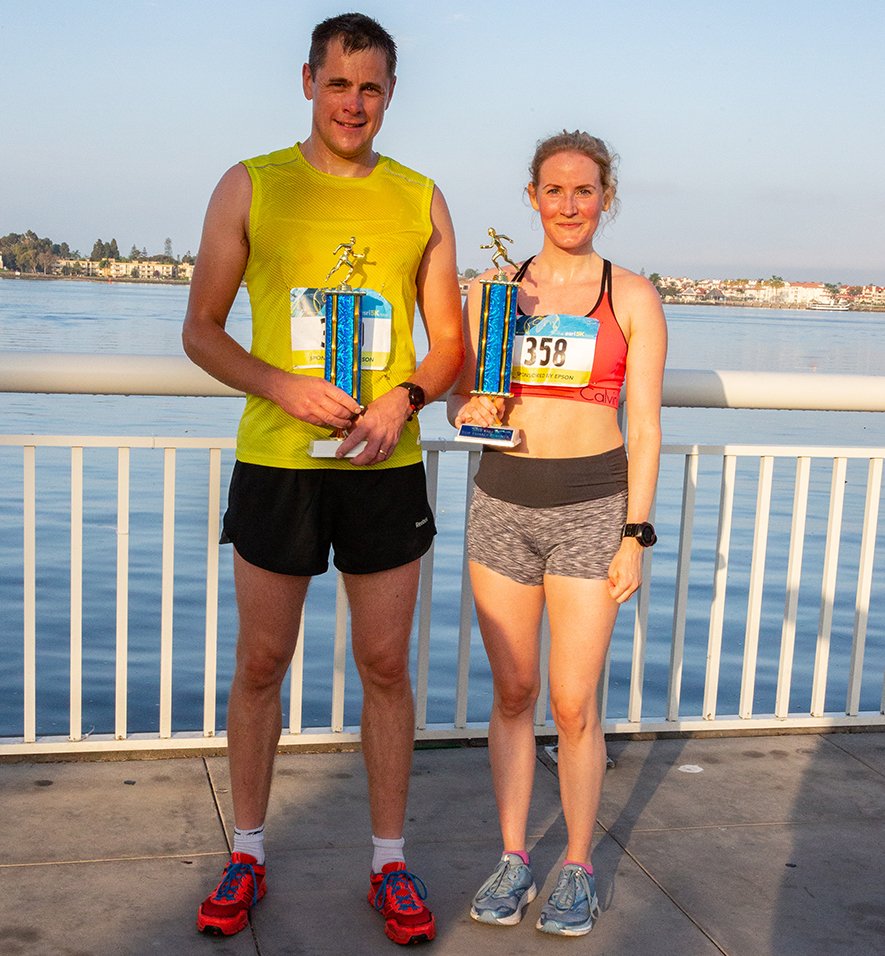
With the rise of the sun, Esri UC Attendees put on their running shoes and took a crisp run at the Esri UC 5k. You can watch the footage of the 5k Run on Instagram.

Esri 5k Runners

Congratulations to the runners and the winners!  Pictures courtesy of the @EsriUC on Twitter.

Winner of Esri 5k UC Run

WeCan and Women in GIS Activities

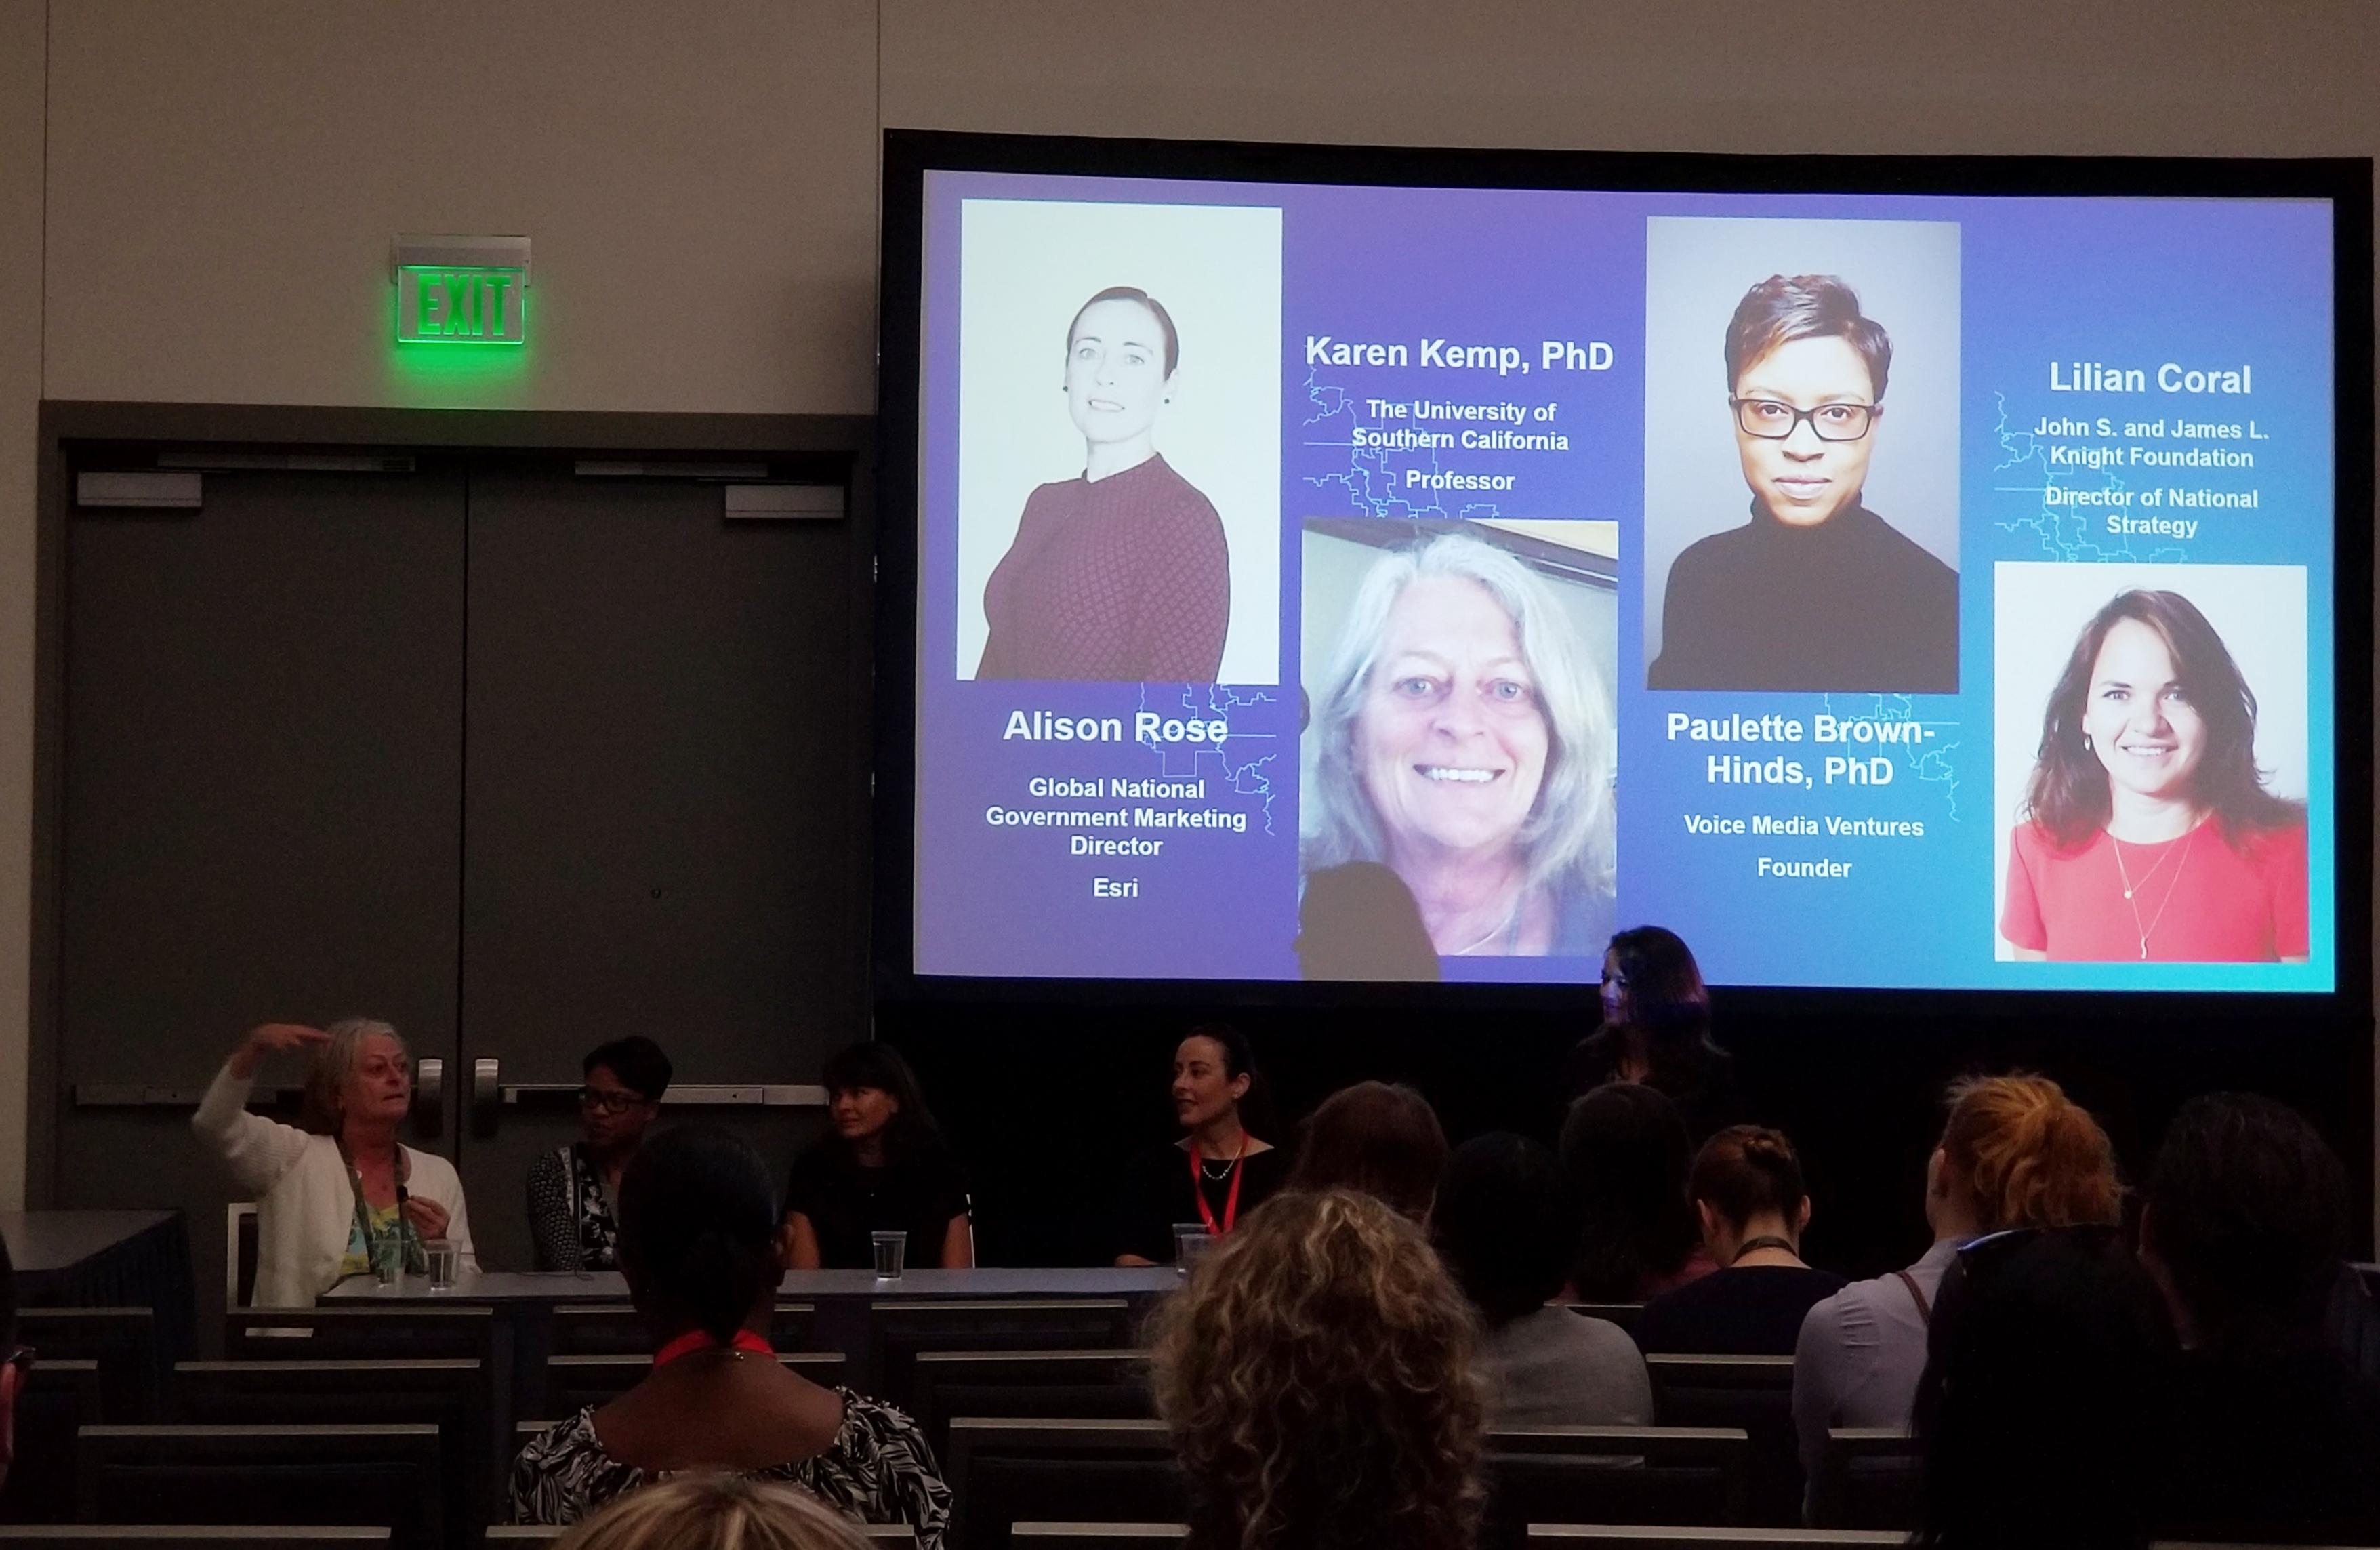
We kicked off the morning at the "WeCan Empower Your Voice" workshop where we met with many amazing women in tech and heard from Ali Rose‌, Karen Kemp‌, Lilian Coral‌, and Paulette Brown-Hinds discuss empowerment, having to speak up and how having a voice has impacted their careers in the positive and negative.

WeCan Empower Your Voice Panel

Left to right: Karen Kemp, Ph.D., Paulette Brown-HInds, Ph.D., Lilian Coral, and Ali Rose

  • Ali Rose, GLobal National Government Marketing Director - Esri shares moment a defense meeting when she had to speak up at committee meetings to come up with a solution for a defense concern, "It was hard to speak up, but I did."
  • Lilian Coral, Director of National Strategy - John S. James L. Knight Foundation tells about the beginning of her career and her mission to improve public safety while she worked for a politician after grad school. Her defining moment was during this first role when she had to negotiate for pay increases for a unit that of poorly paid medical employees and she had to hold out for a satisfying pay for this unit.
  • Paulette Brown-HInds, Ph.D., Founder - Voice Media Ventures shares when she started writing editorials that were impactful, had the power to make changes and drew the attention of politicians and city officials. She realized then that her voice had a chance to make an impact. She became more of a civic leader as a result of using her voice in her editorials.
  • Karen Kemp, Ph.D., Professor - University of Southern California leads off with taking the opportunities and not knowing where it will take you. She says, "Follow your gut and follow your heart." She says she didn't realize that she was experiencing a life-changing event until later. She took a career on a GIS project that would evolve into the leading GIS curriculum for the next 20 years. 

Their advice for success: mentorship, clarity about what you want to do for your life, be mission-oriented, know what is important to you when it comes to your life and career, listen and be respectful, and don't fear change.

Women In GIS LuncheonIt was a full house at the Women in GIS Luncheon where Dawn Wright and others shared inspirational words with the women in the room. They gave a brief overview of WiGIS and a call to action for mentors, volunteers, and sponsorship opportunities.

If you want to know more about WeCAN (Esri’s own “Women’s Empowerment & Career Advancement Network”) please reach out to Margot Manasevit at MManasevit@esri.com. For information about WiGIS, you can send an email to admin@womeningis.org.

At the Expo

Throughout the day we had many visitors stop by the GeoNet Espo booth in the Lifelong Learning. 

Joseph Kerski and Michelle Mathias photo bomb the GeoNet booth.

Joseph Kerski and Michelle Mathias photobomb the GeoNet booth.

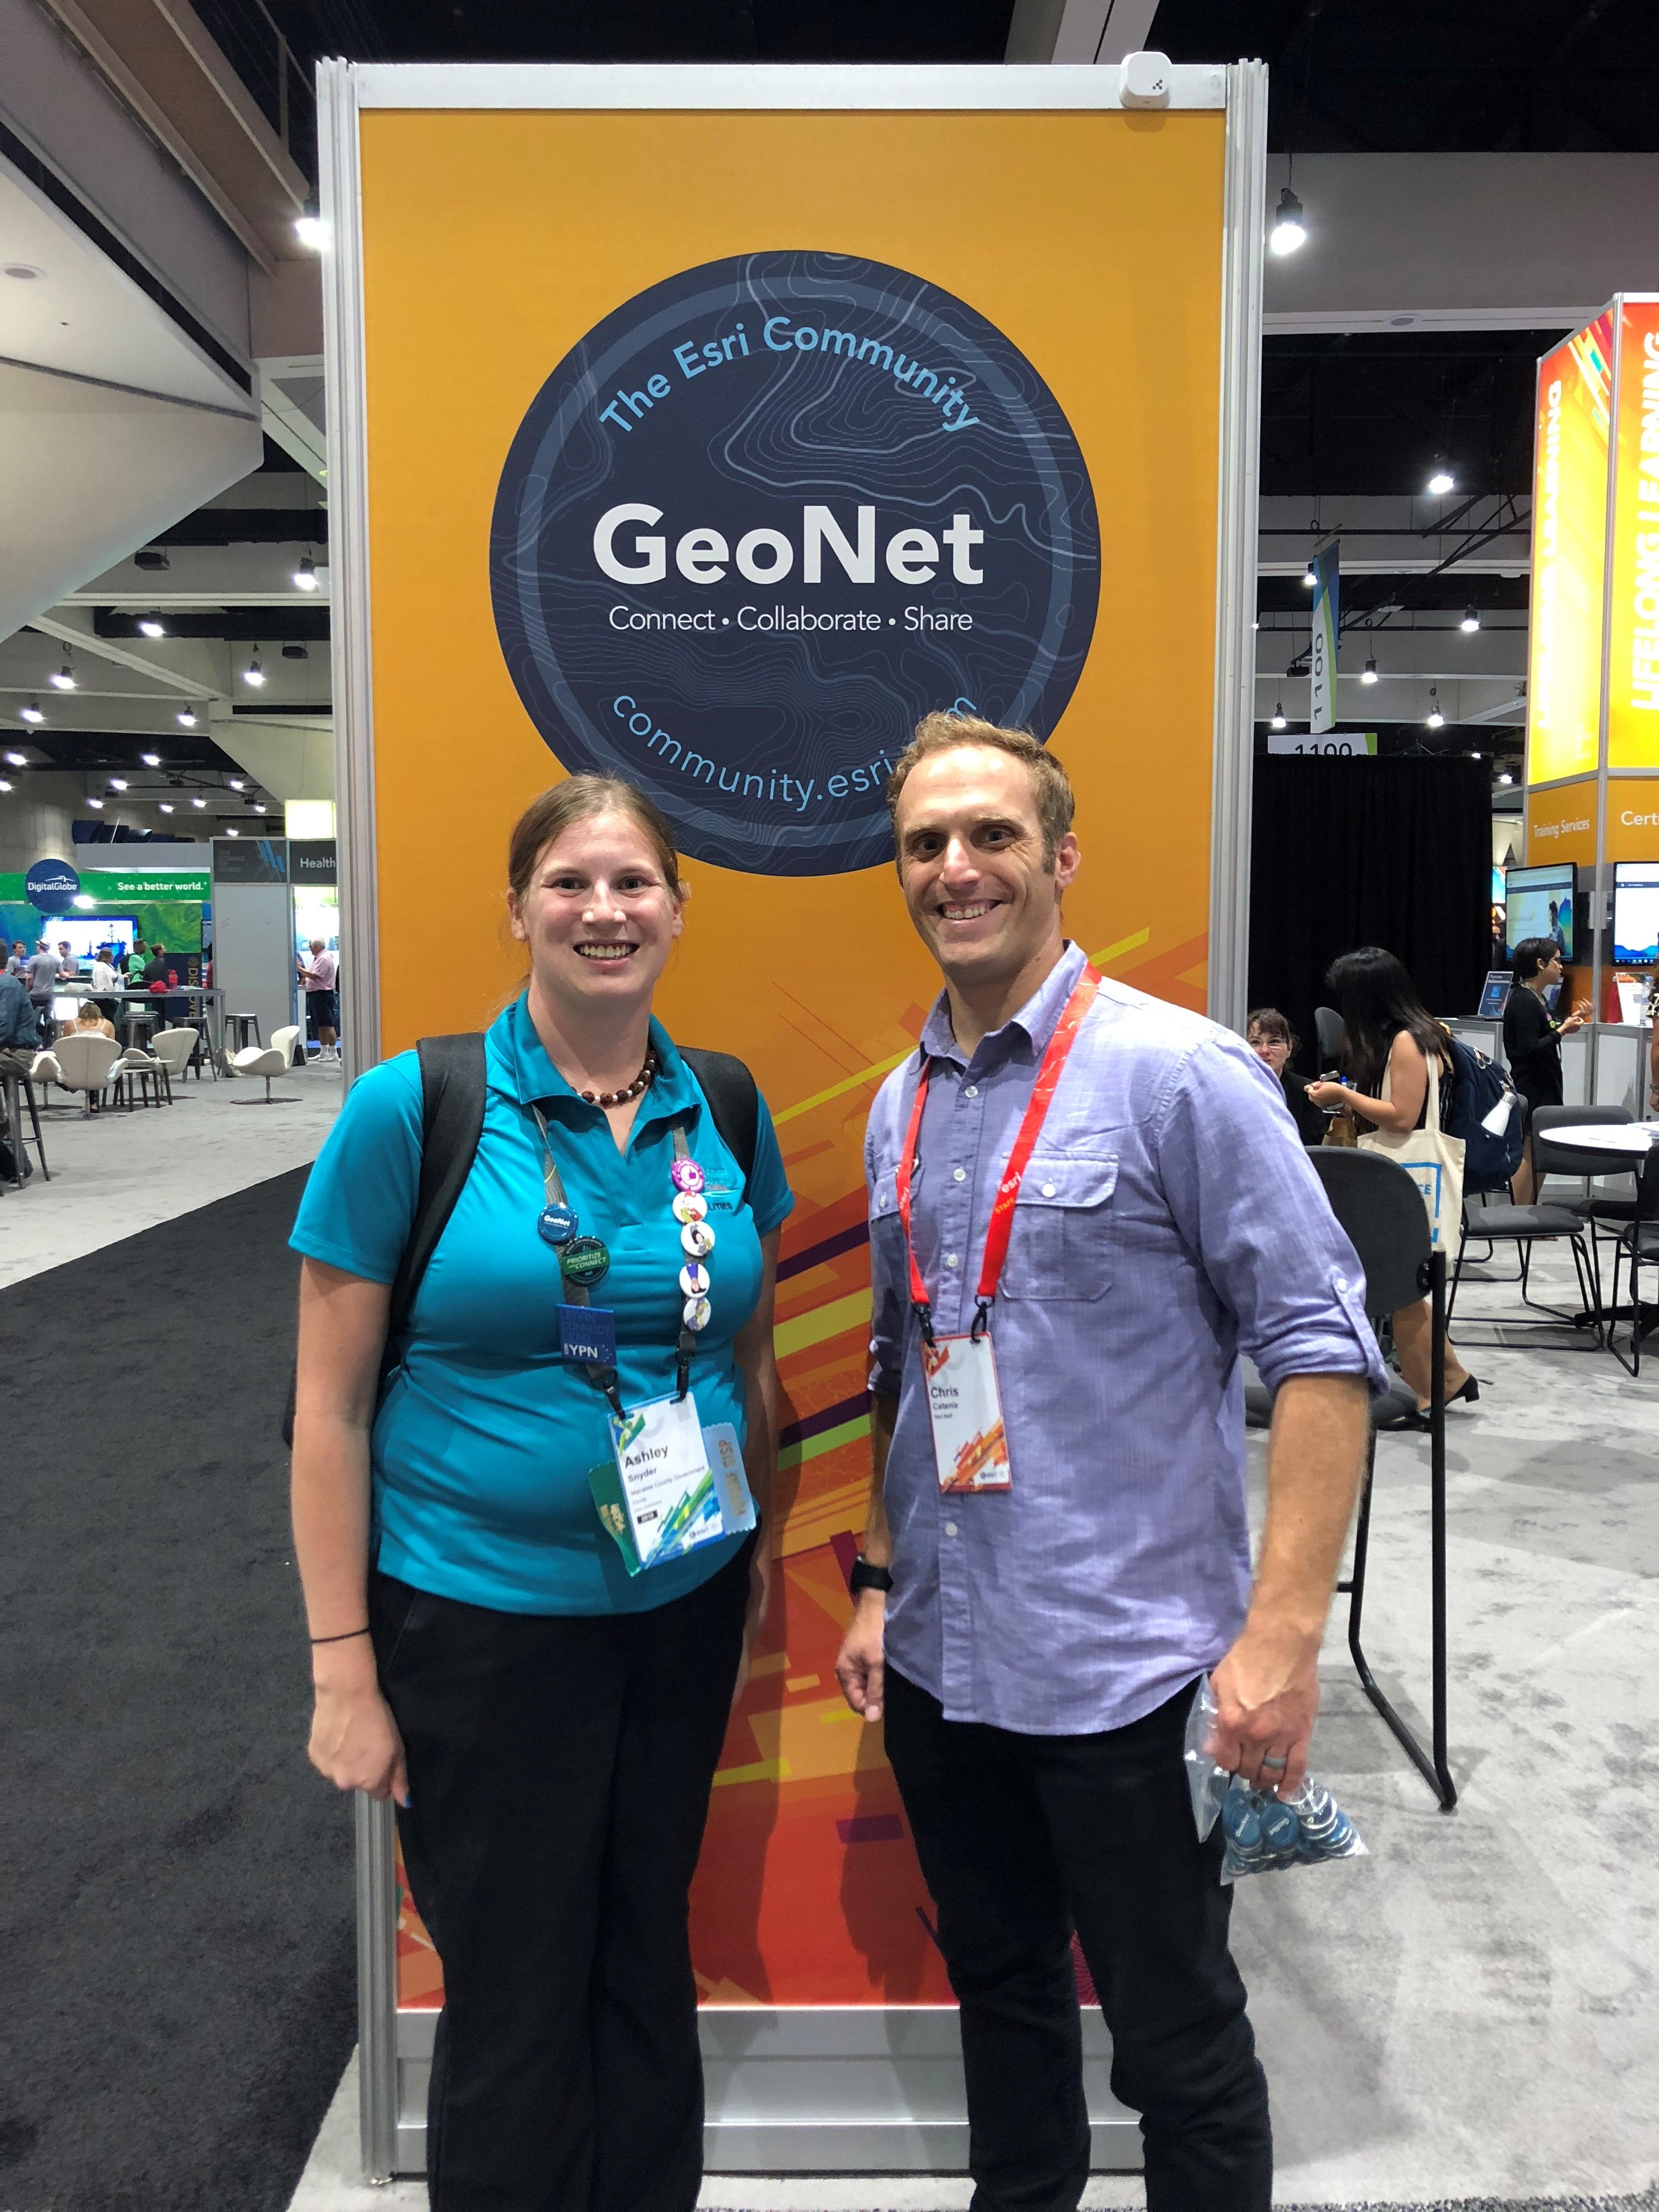
Ashley Snyder and Chris Catania

Ashley Snyder‌ and Chris Catania

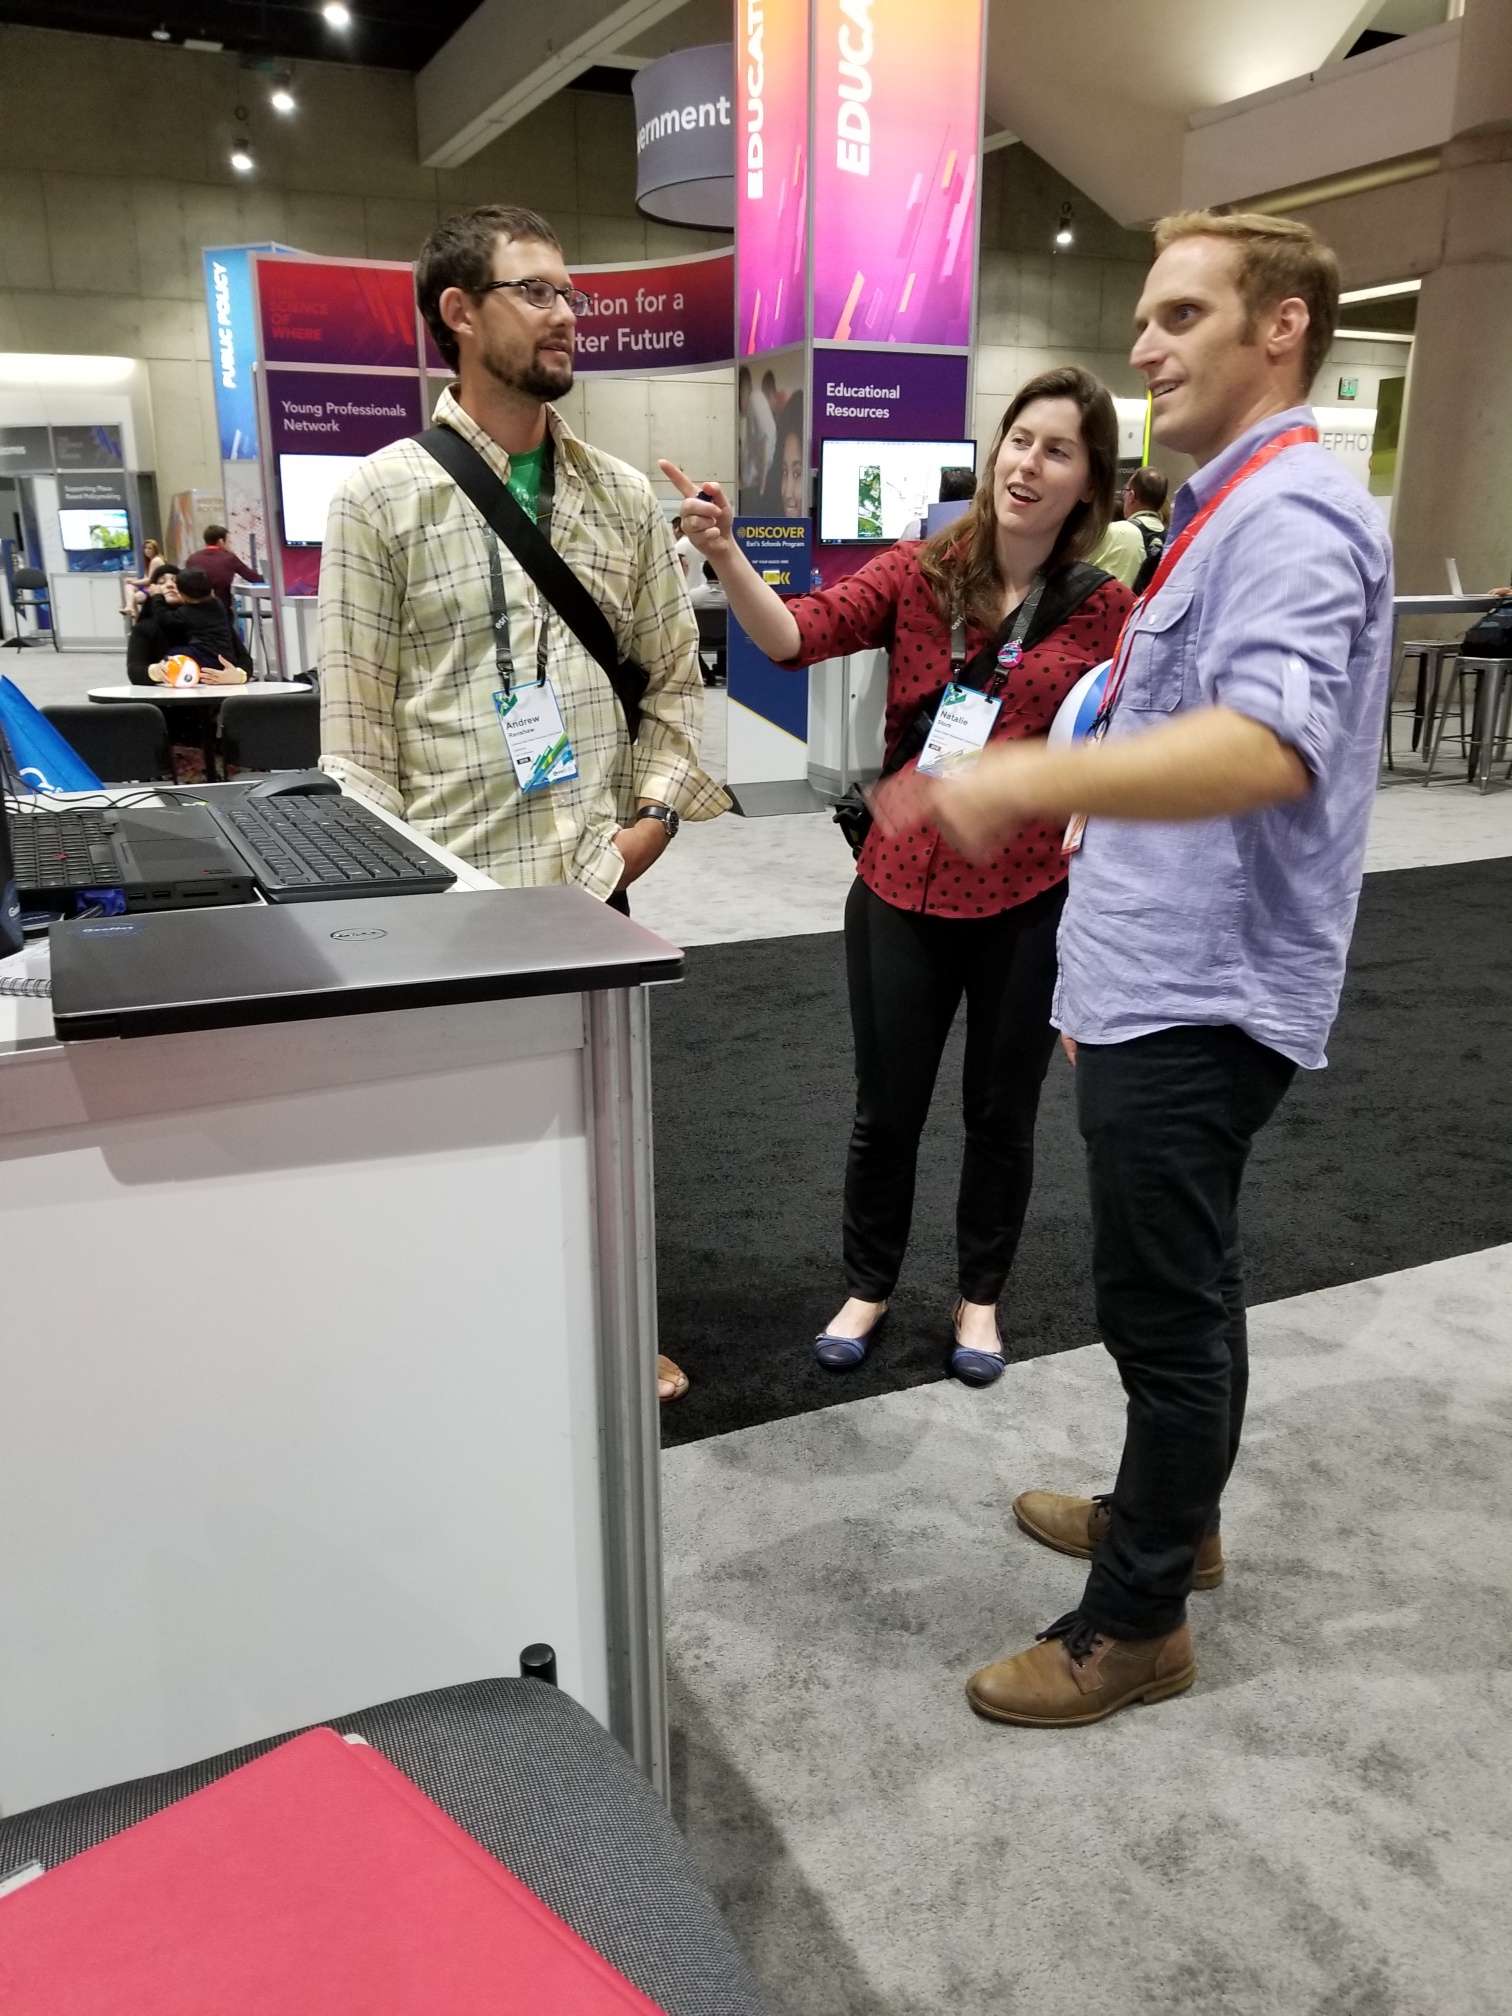
GeoNet demonstration by Chris Catania

Chris Catania‌ gives a quick demonstration of GeoNet to Natalie Stork and Andy Renshaw‌.

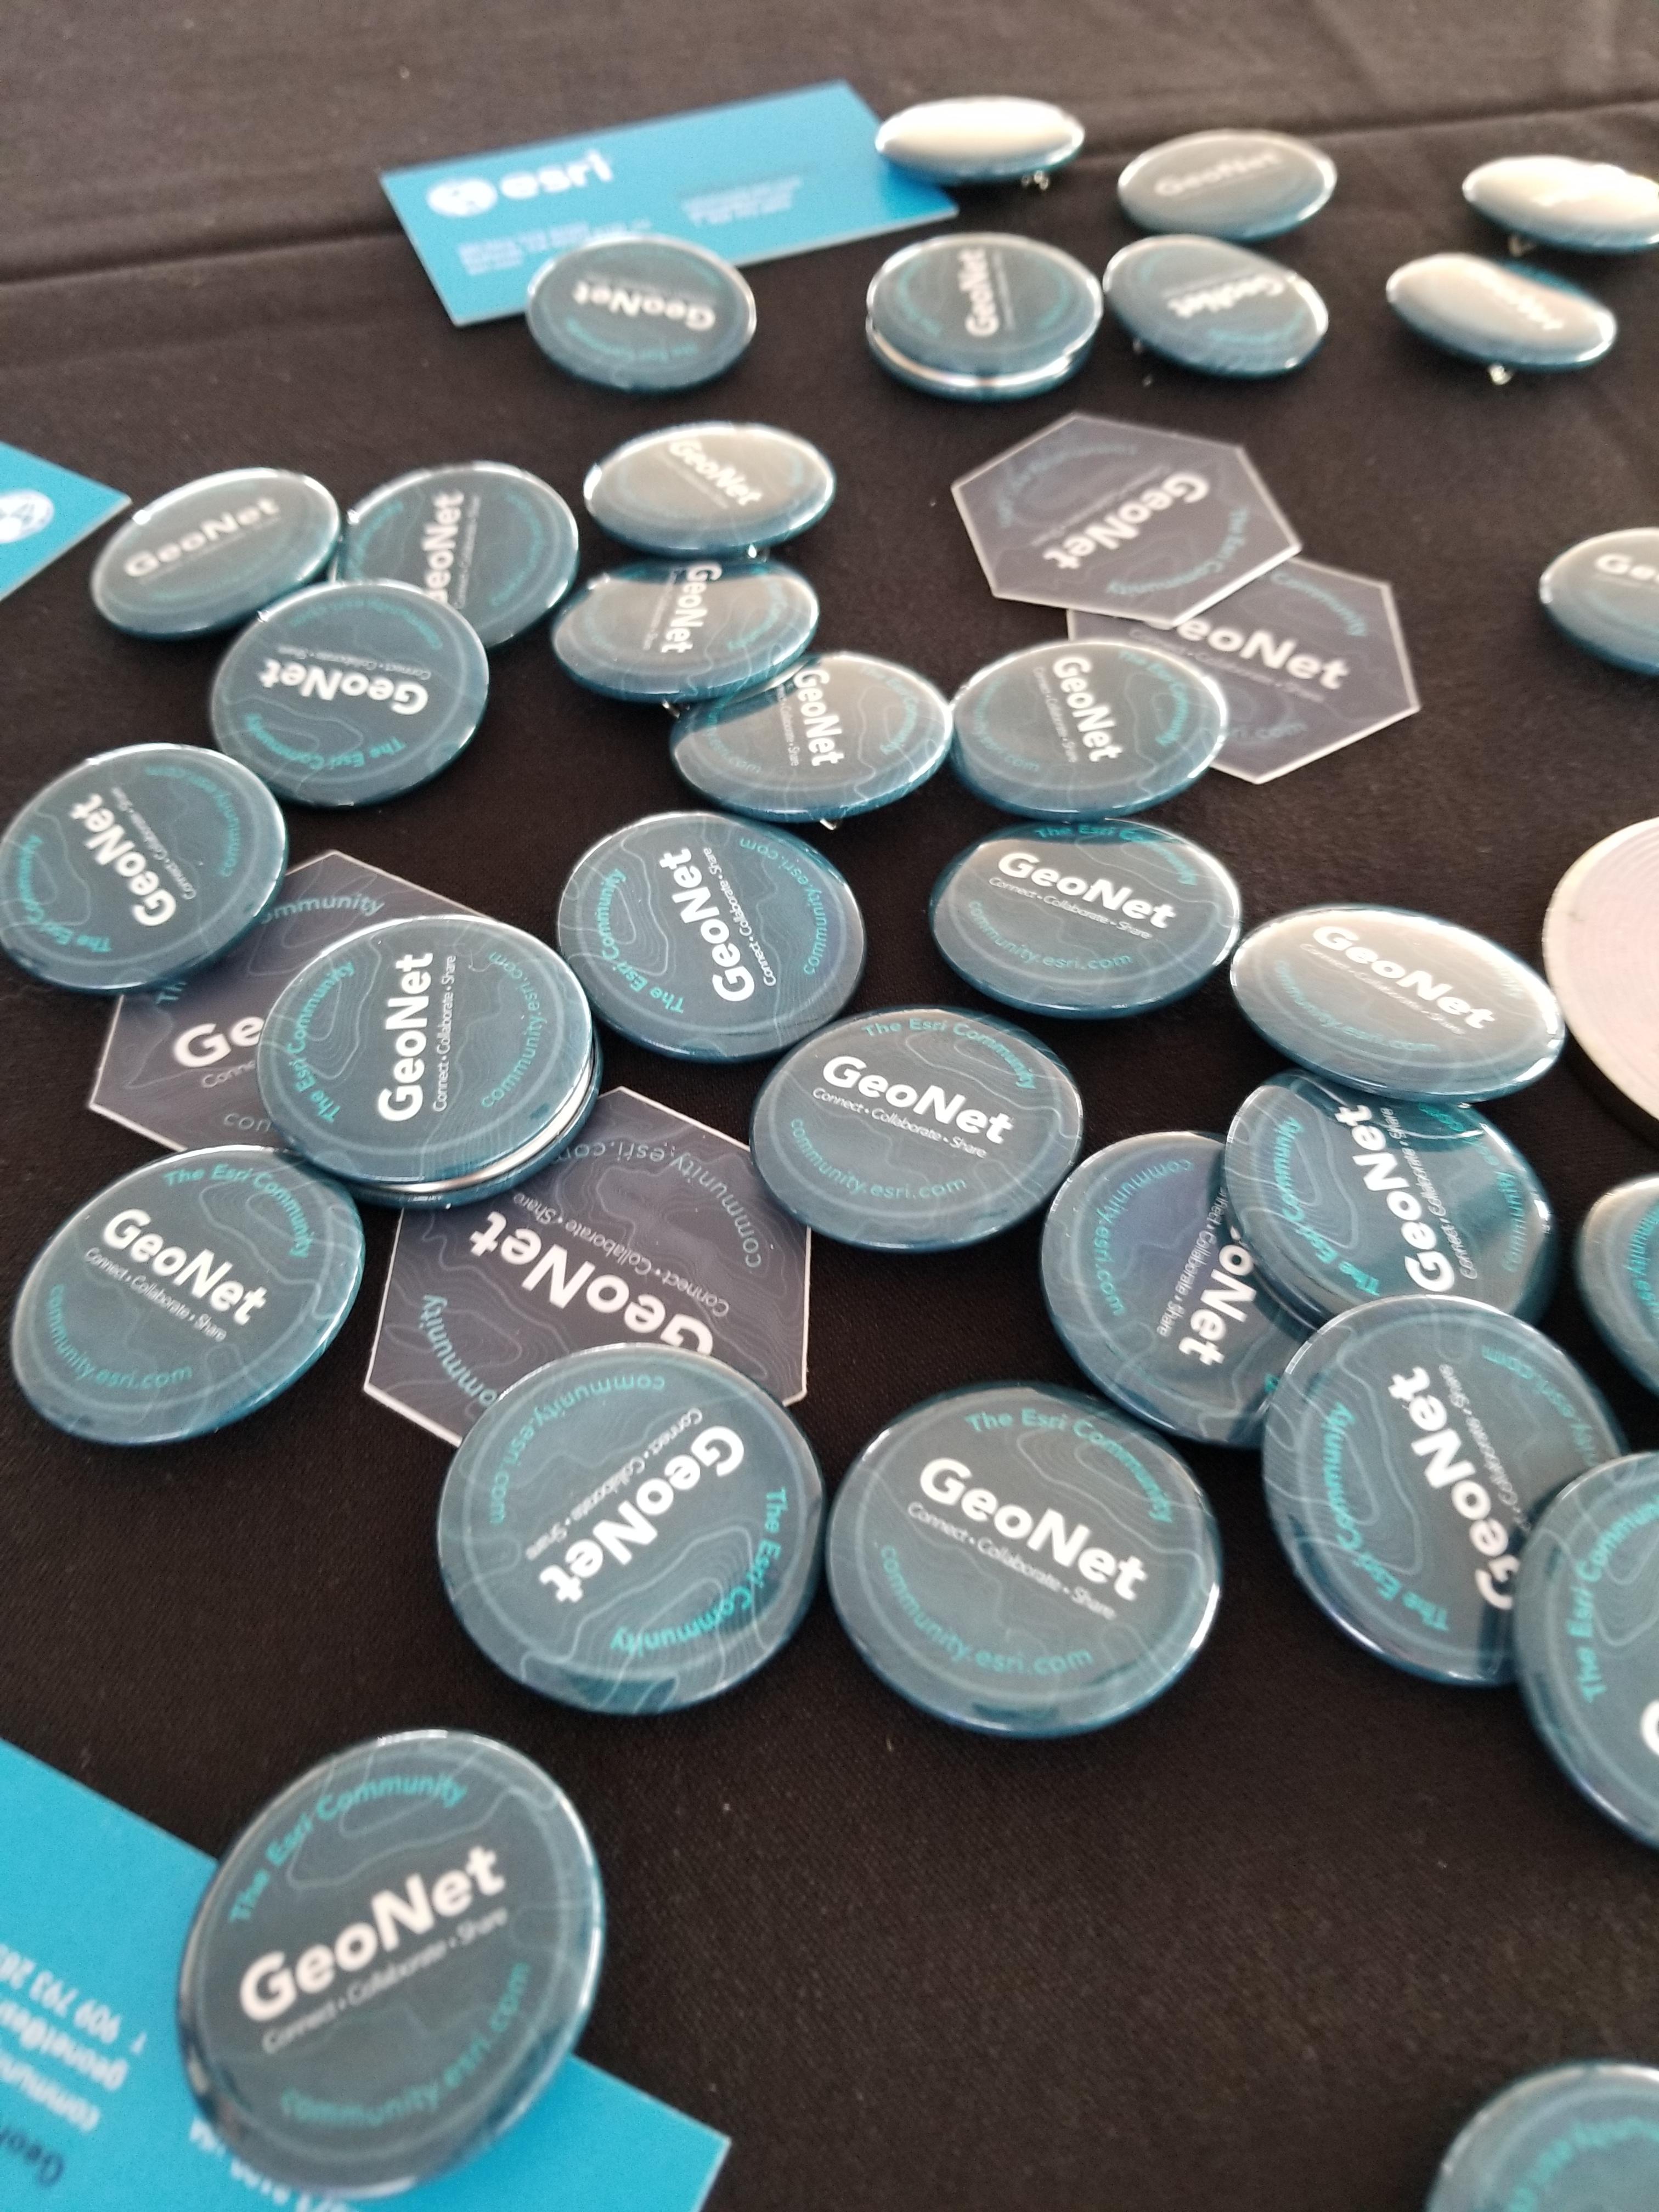
Buttons

If you didn't get a new GeoNet button, be sure to stop by tomorrow before the Expo closes.

Family Night

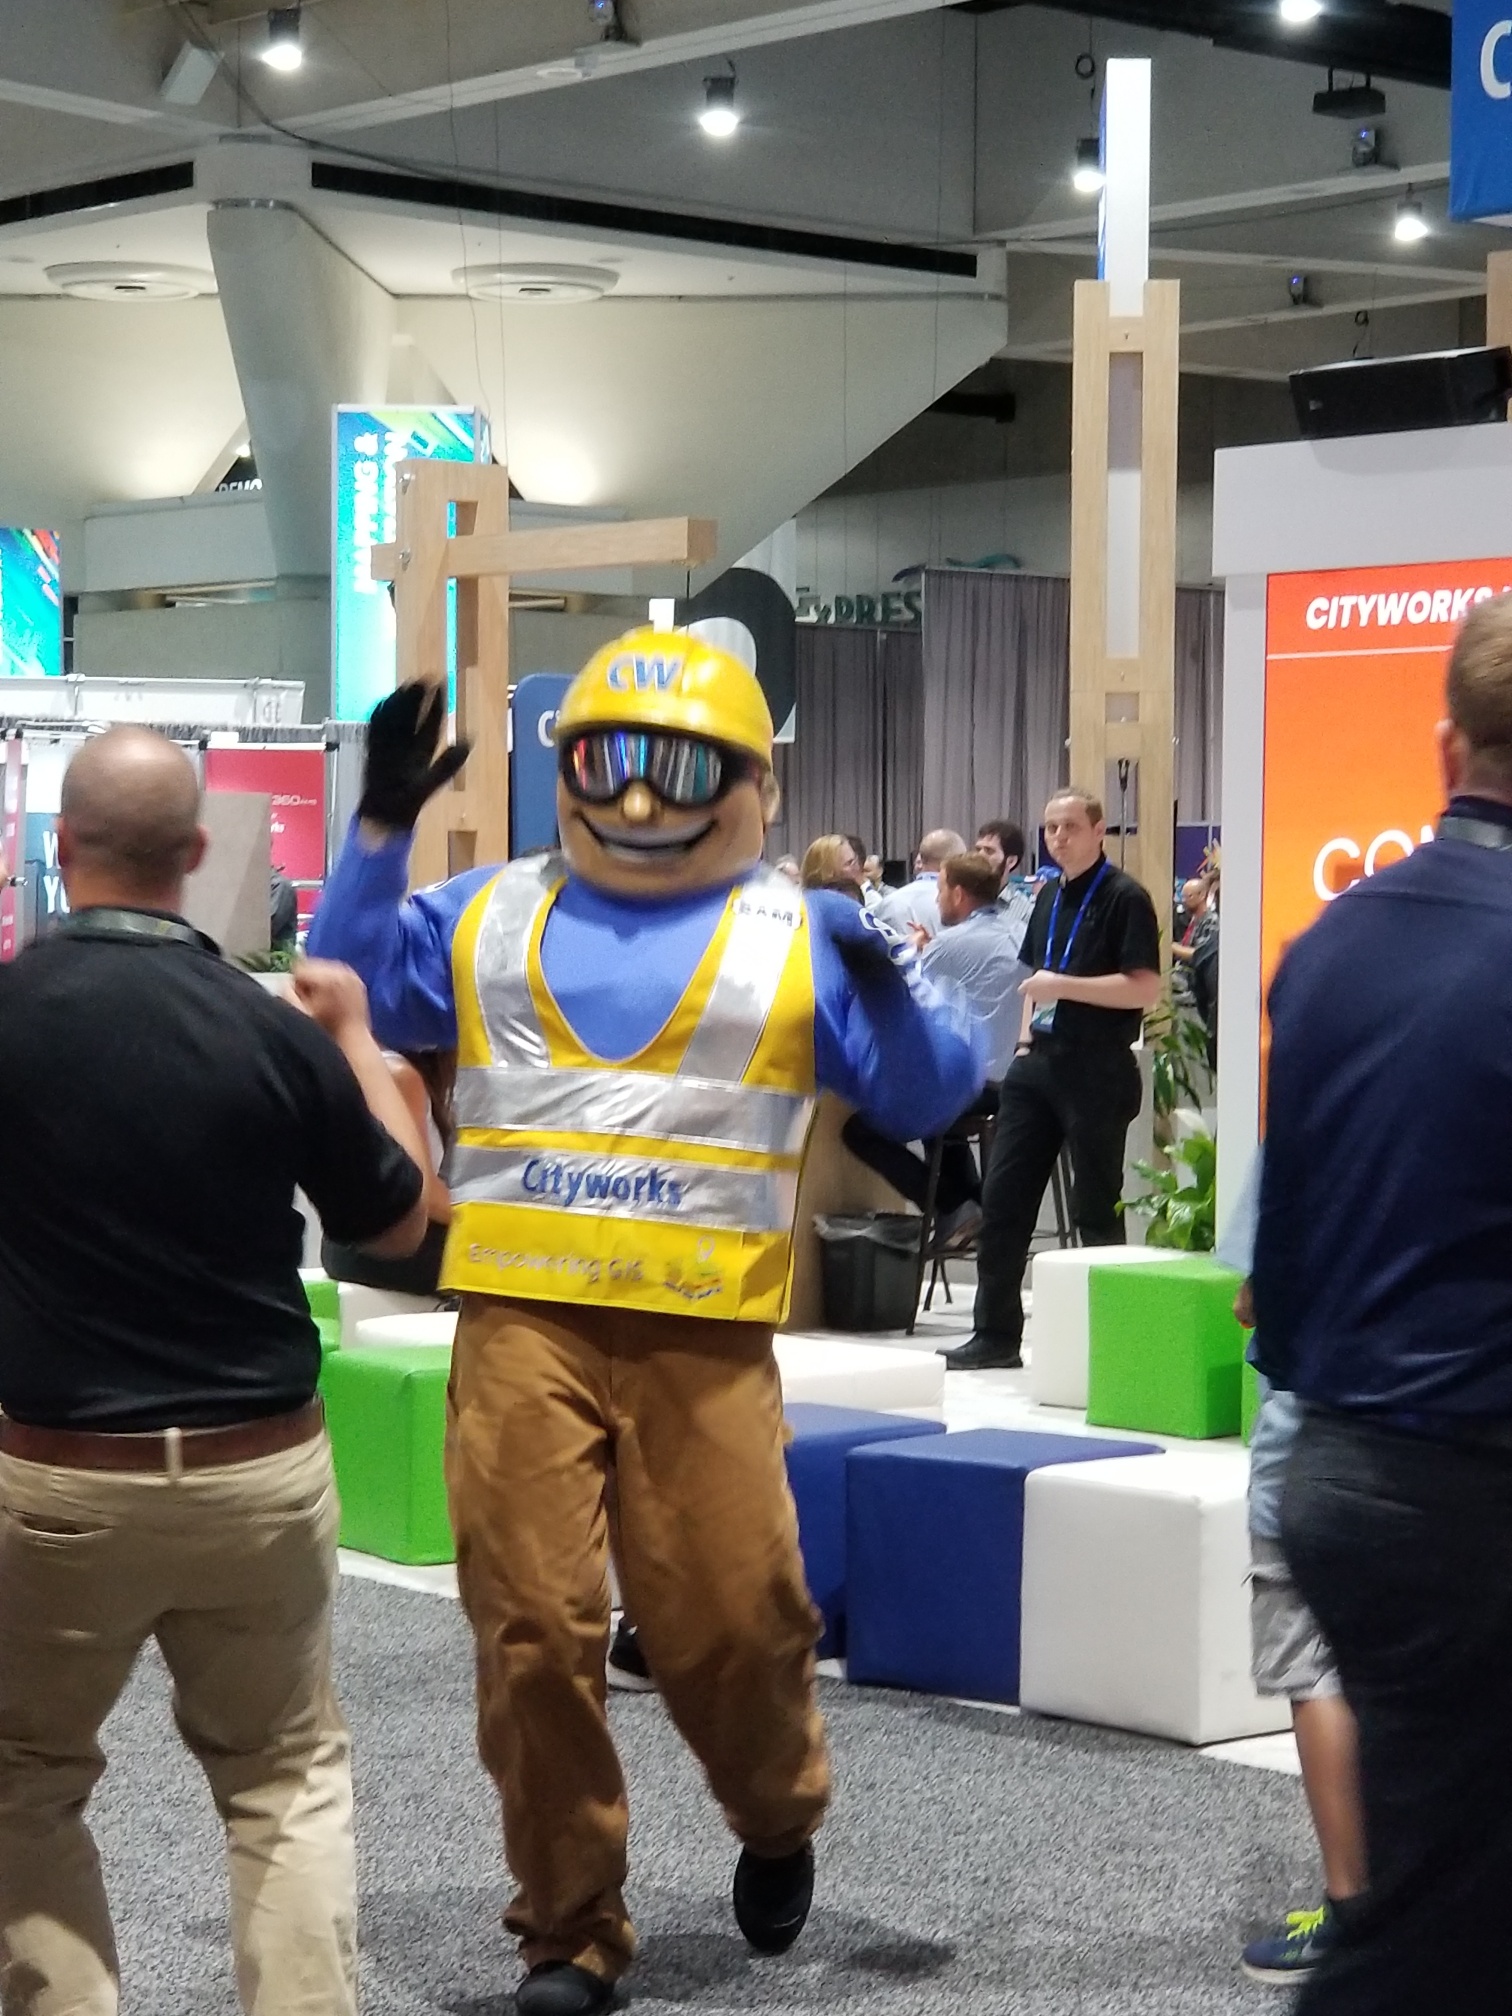
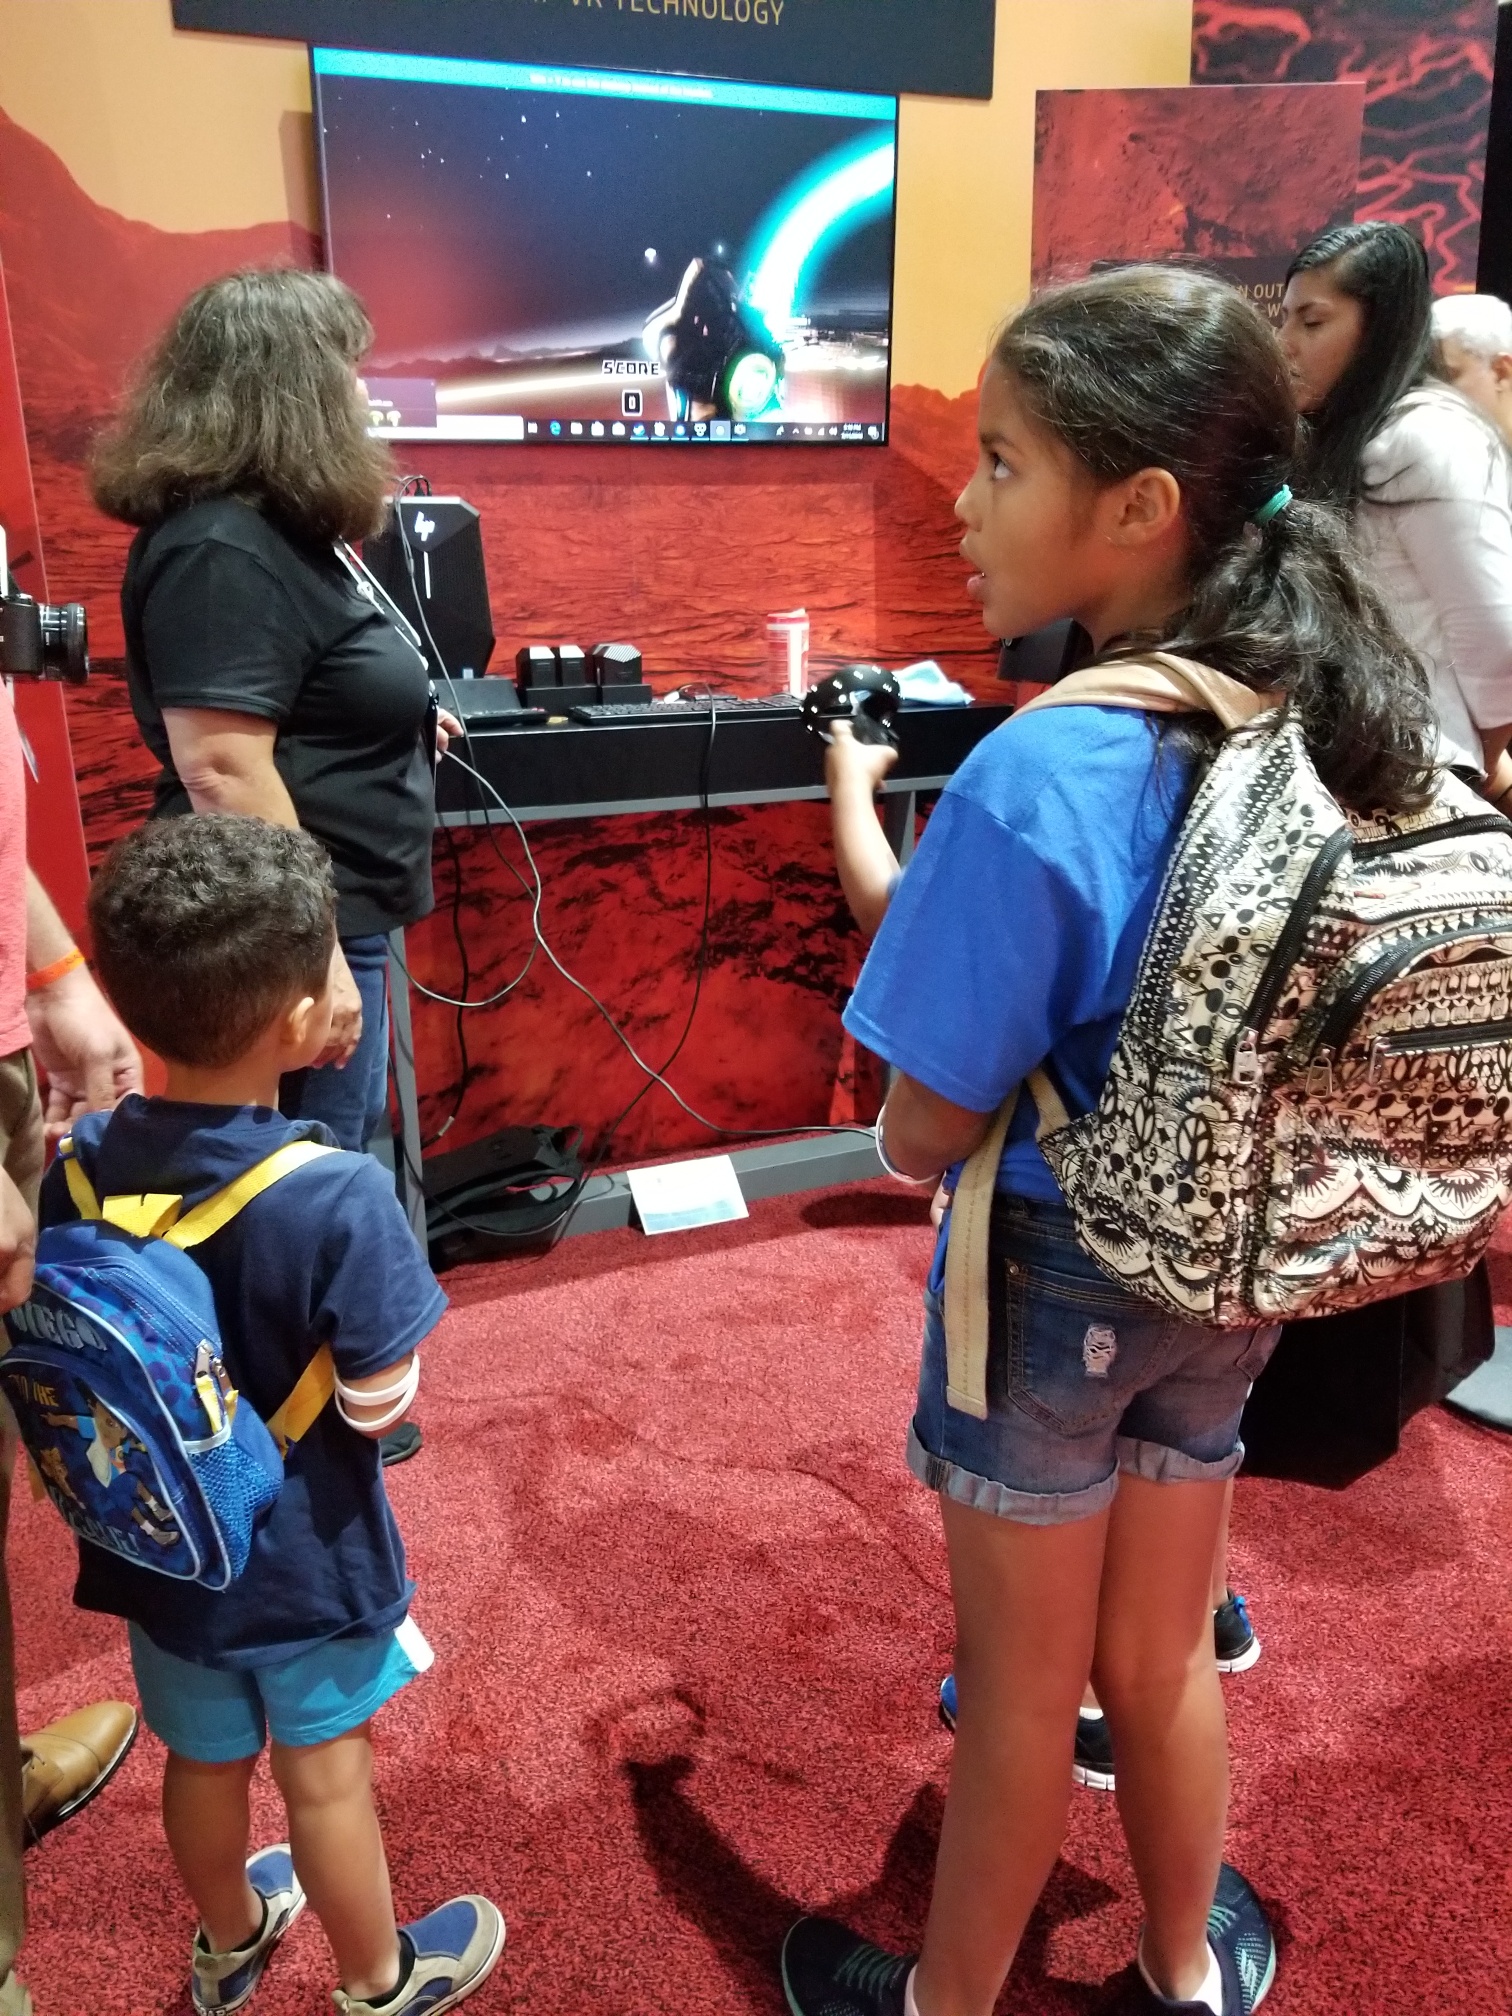
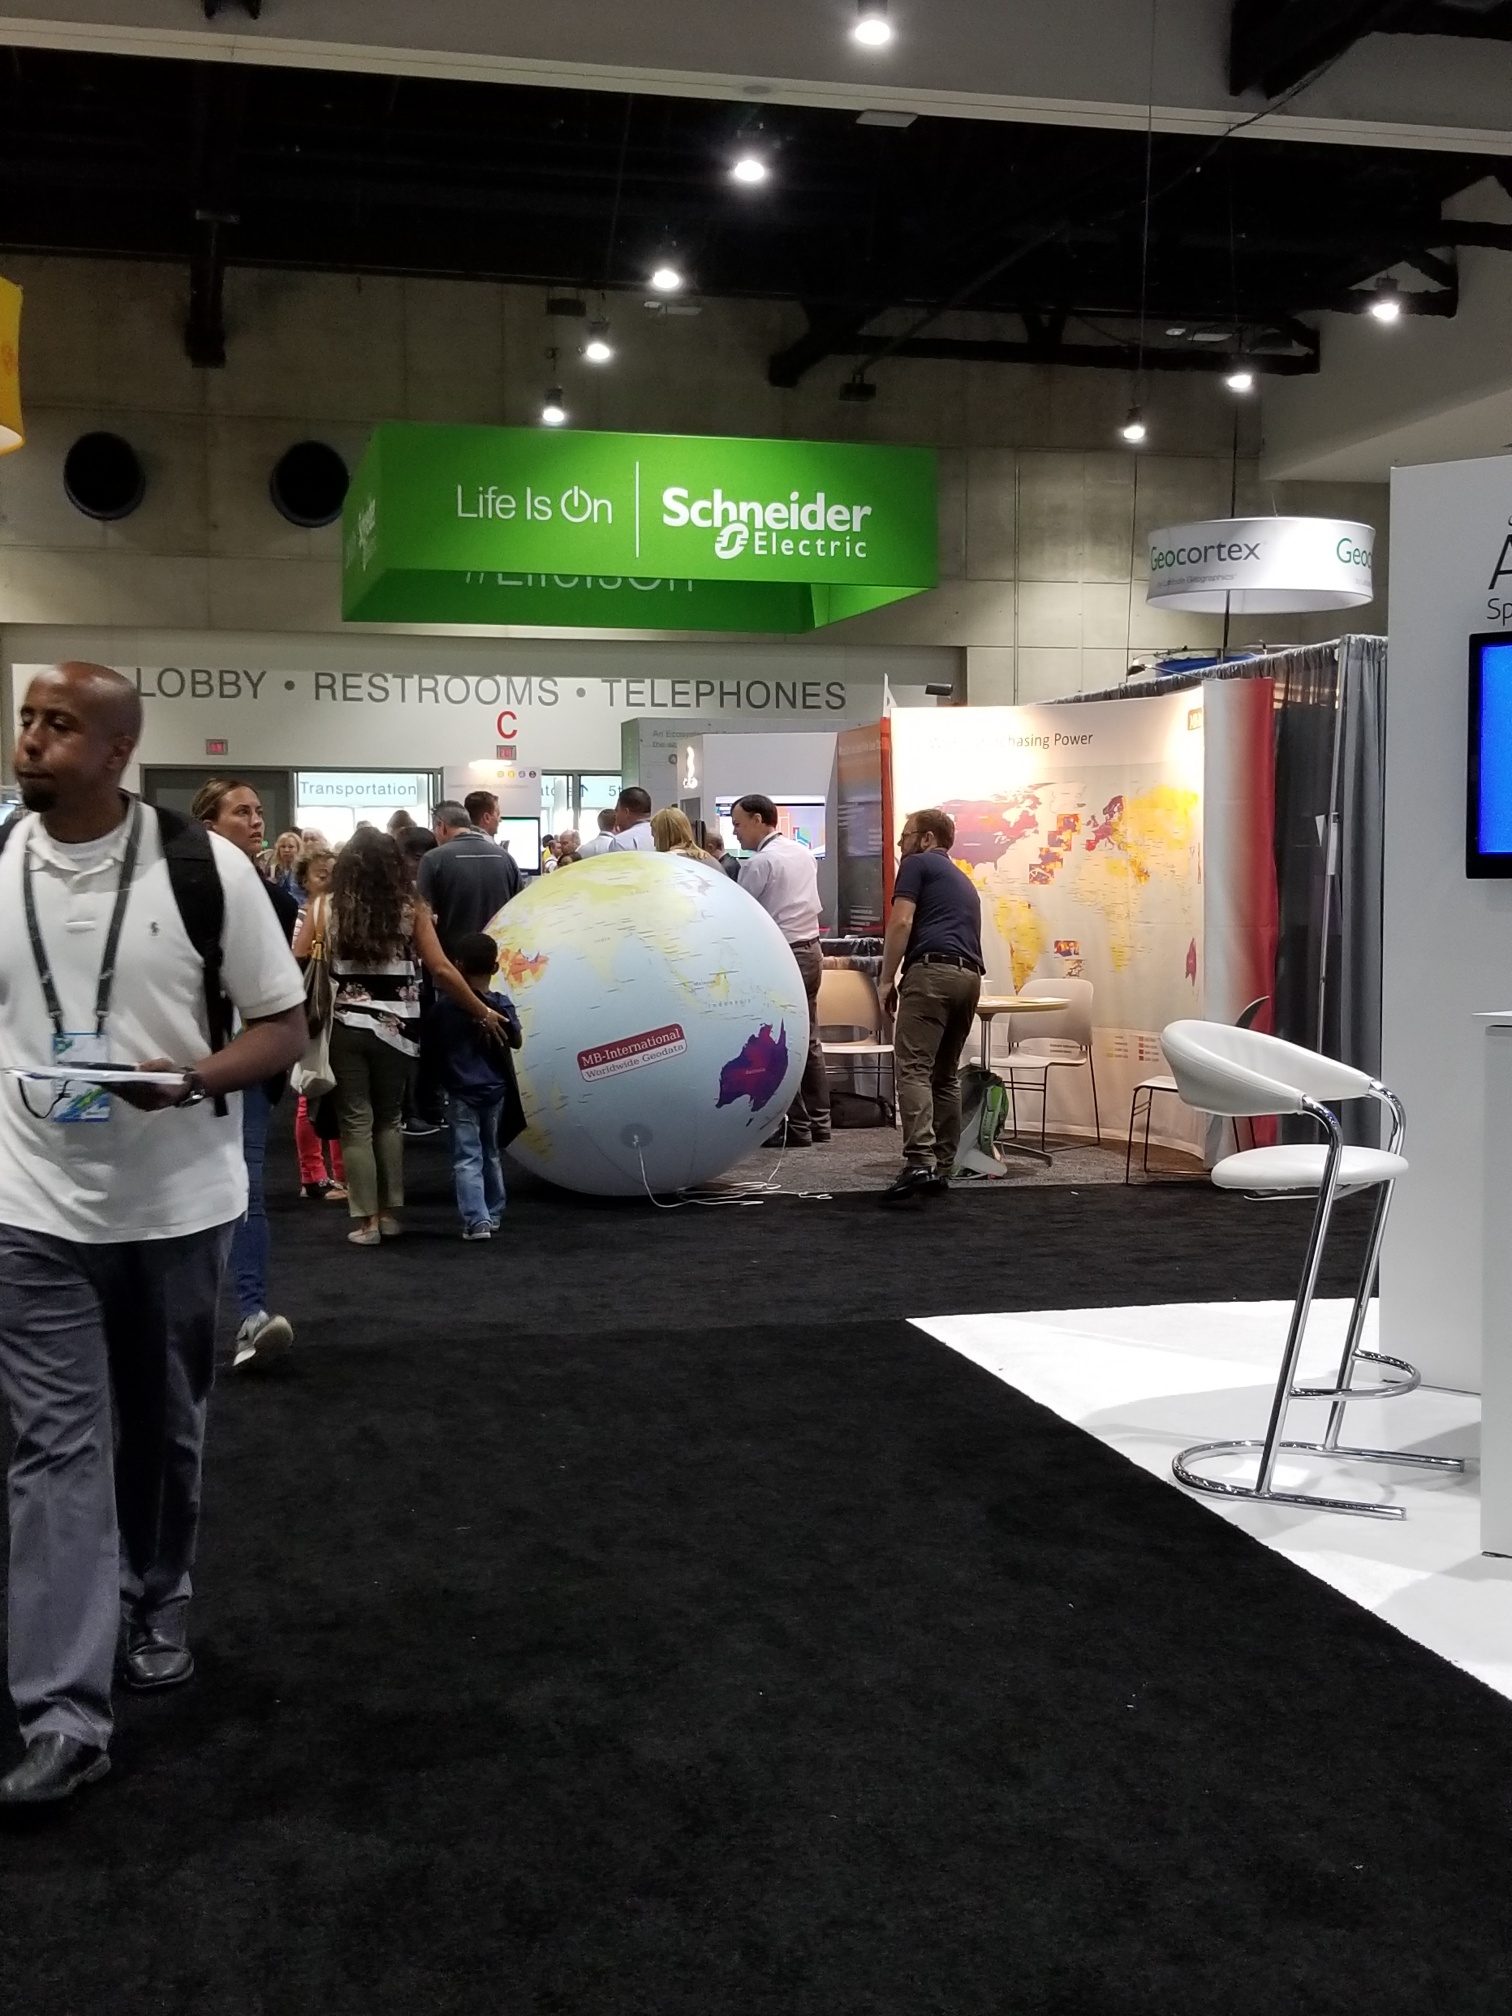
Michelle Mathias ‌and many UC attendees brought their families to the Family Night where they enjoyed activities, conversation and had a chance to see what makes their parents job so cool. It's not just about maps; there are pirates, Cityworks Sam, yo-yos, VR video games, and giant bouncing globes.

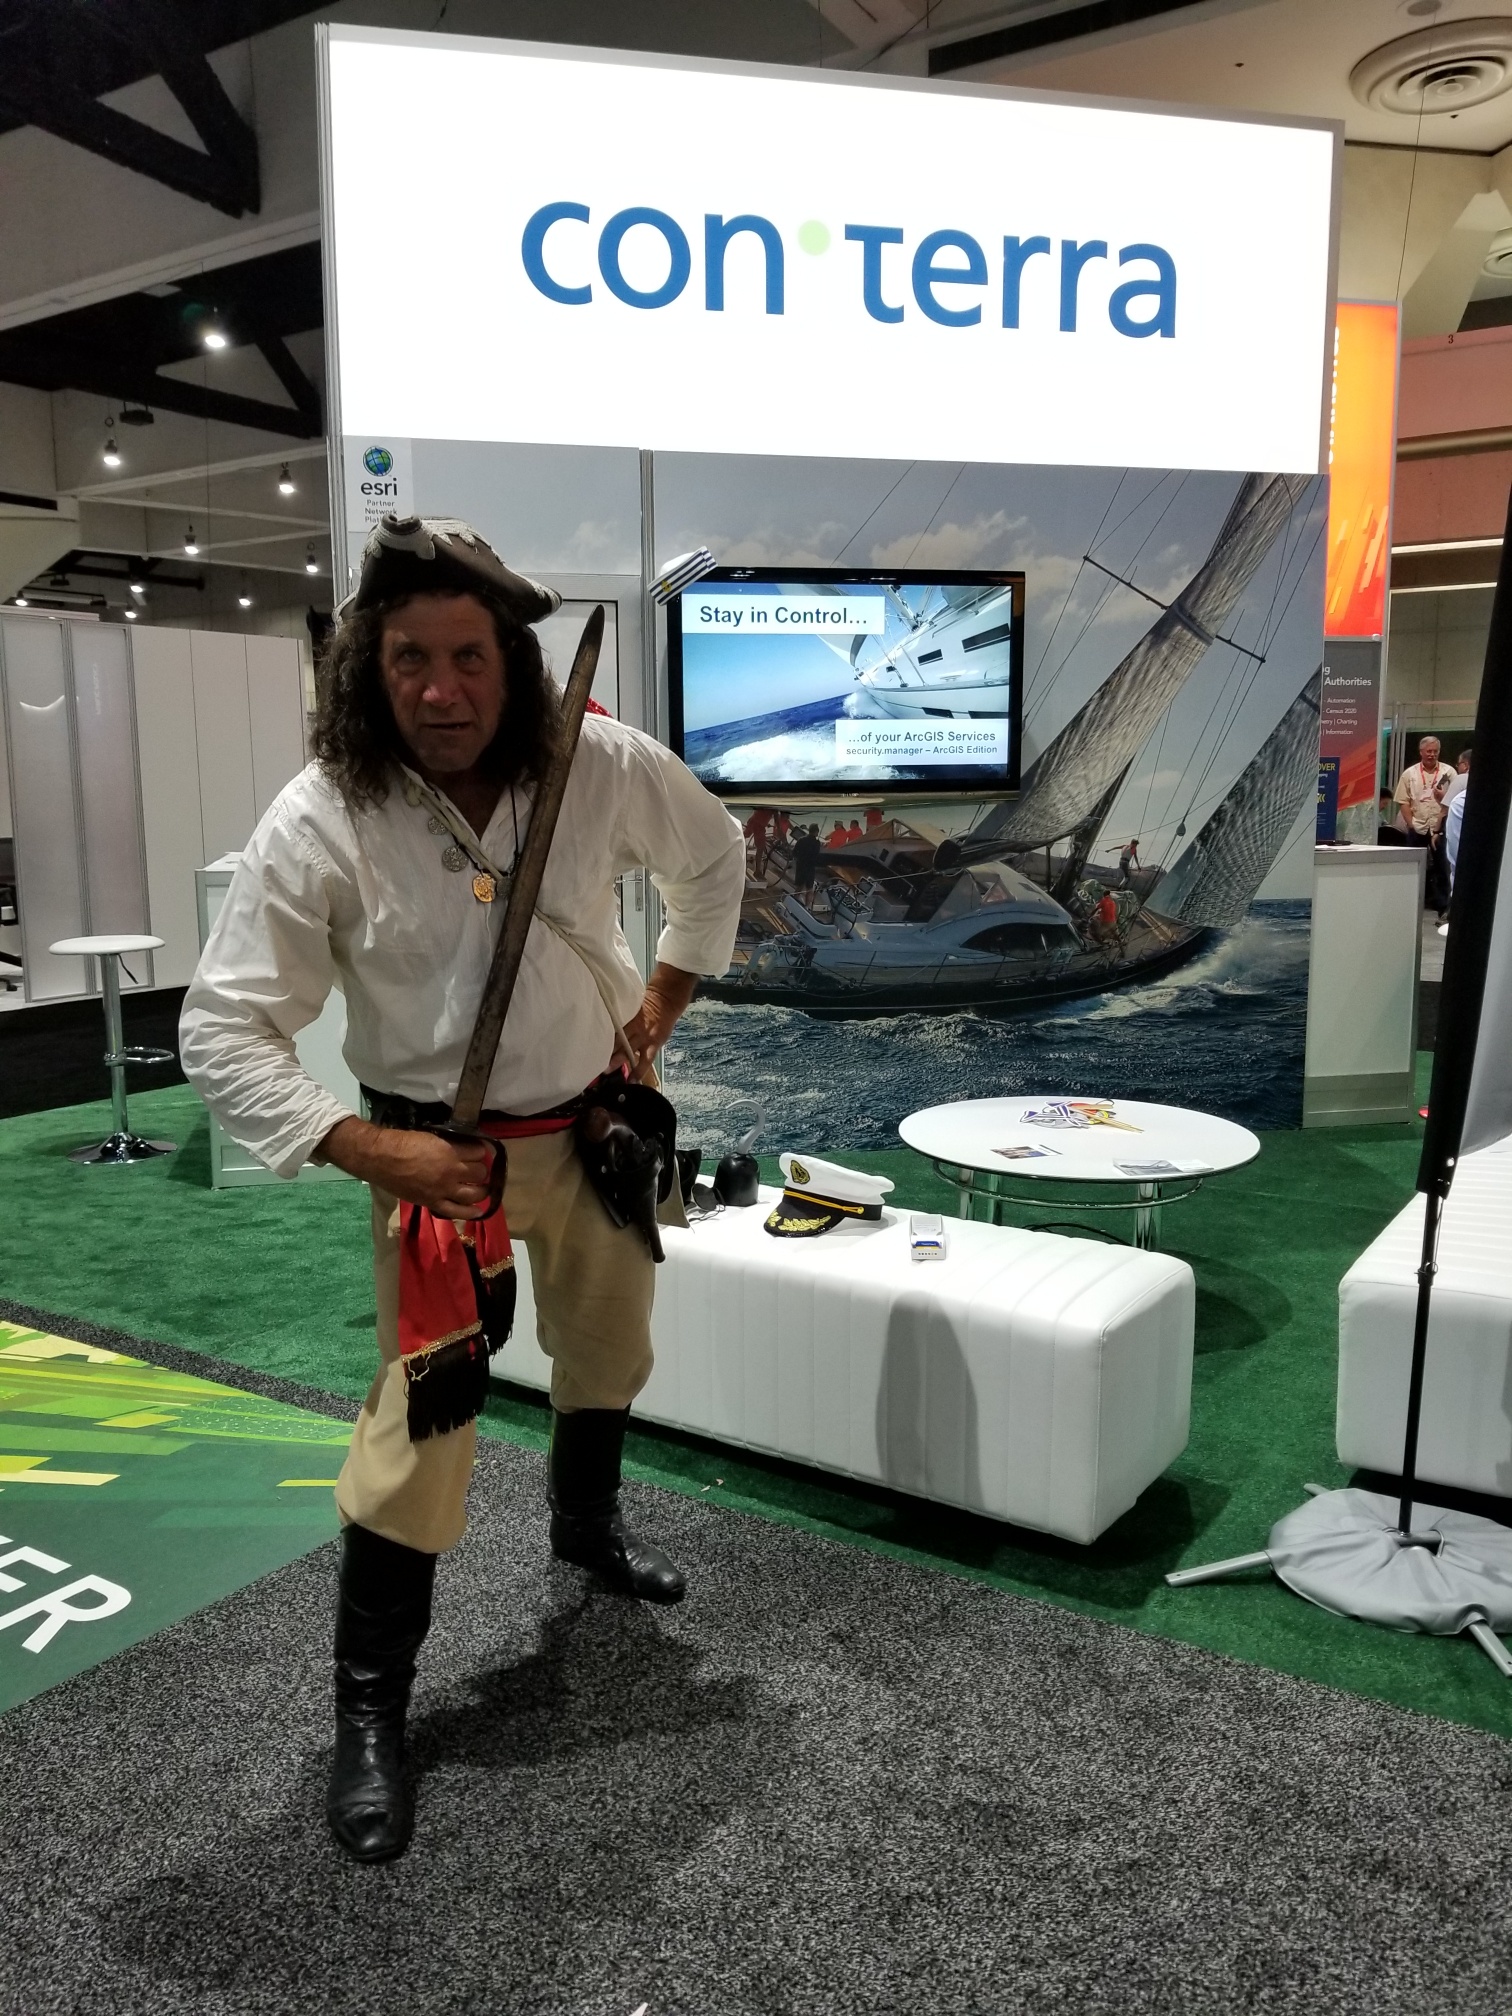
Conterra had Pirates at Family NIght

Conterra had Pirates at Family NIght

Cityworks Sam

Cityworks Sam danced with everyone.

Family Night VR Games

Pam brought her children to Family NIght for VR fun in the HP Expo Area. 

Schneider Electric globe

Schneider Electric had a giant globe. Imagine volleyball with that.

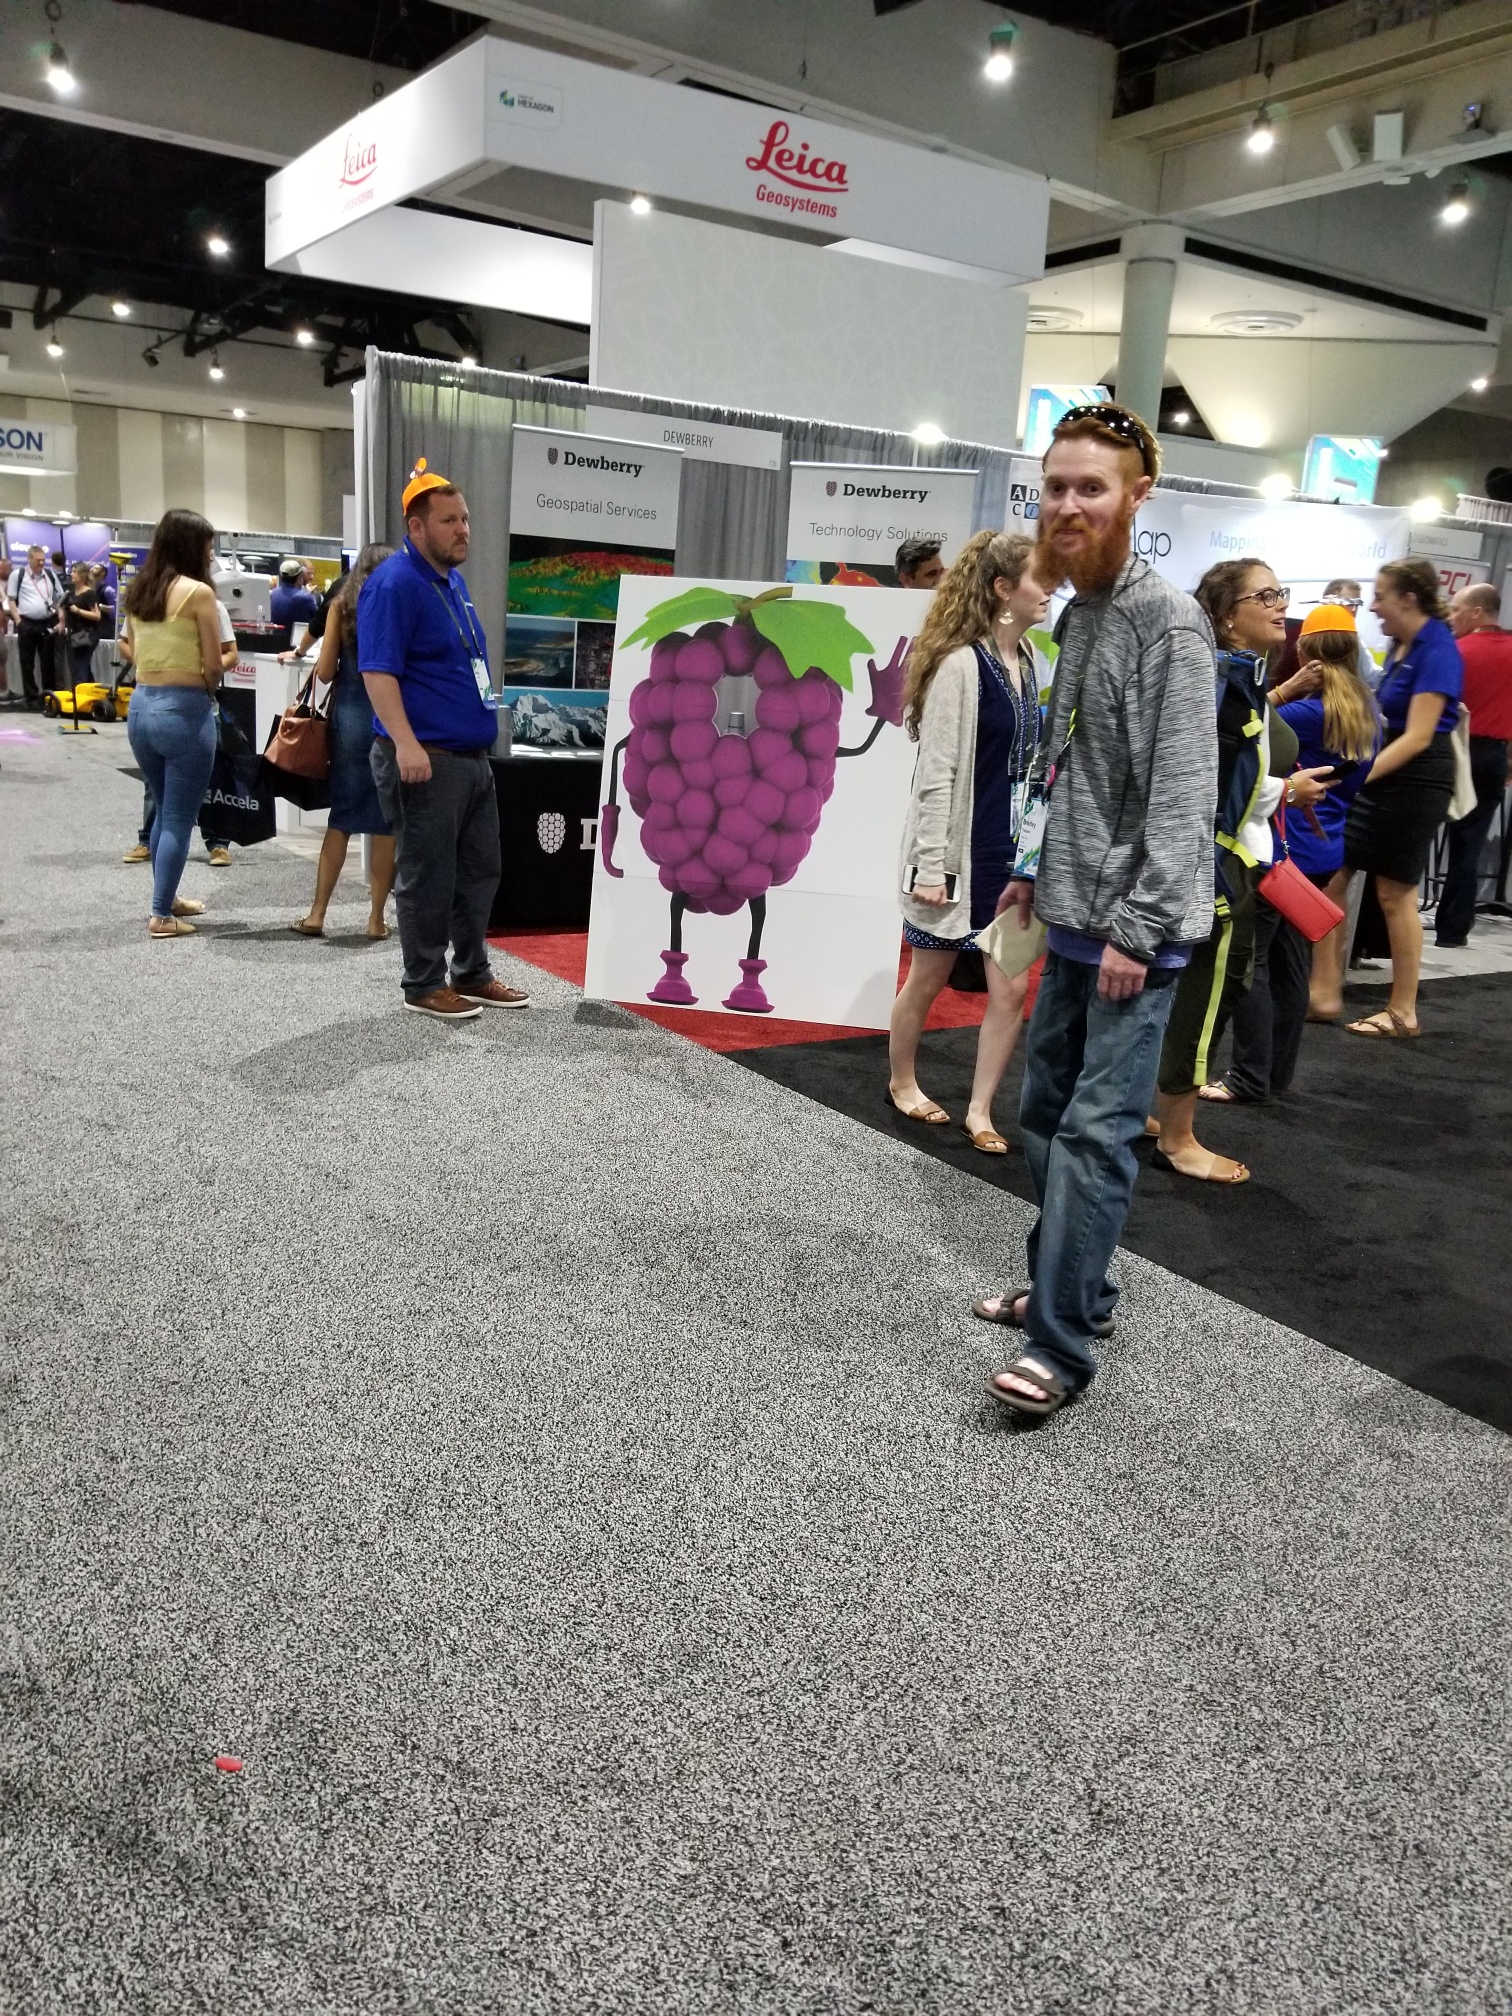
Grape photo booth

Grape photo displays at the Leica Expo area.

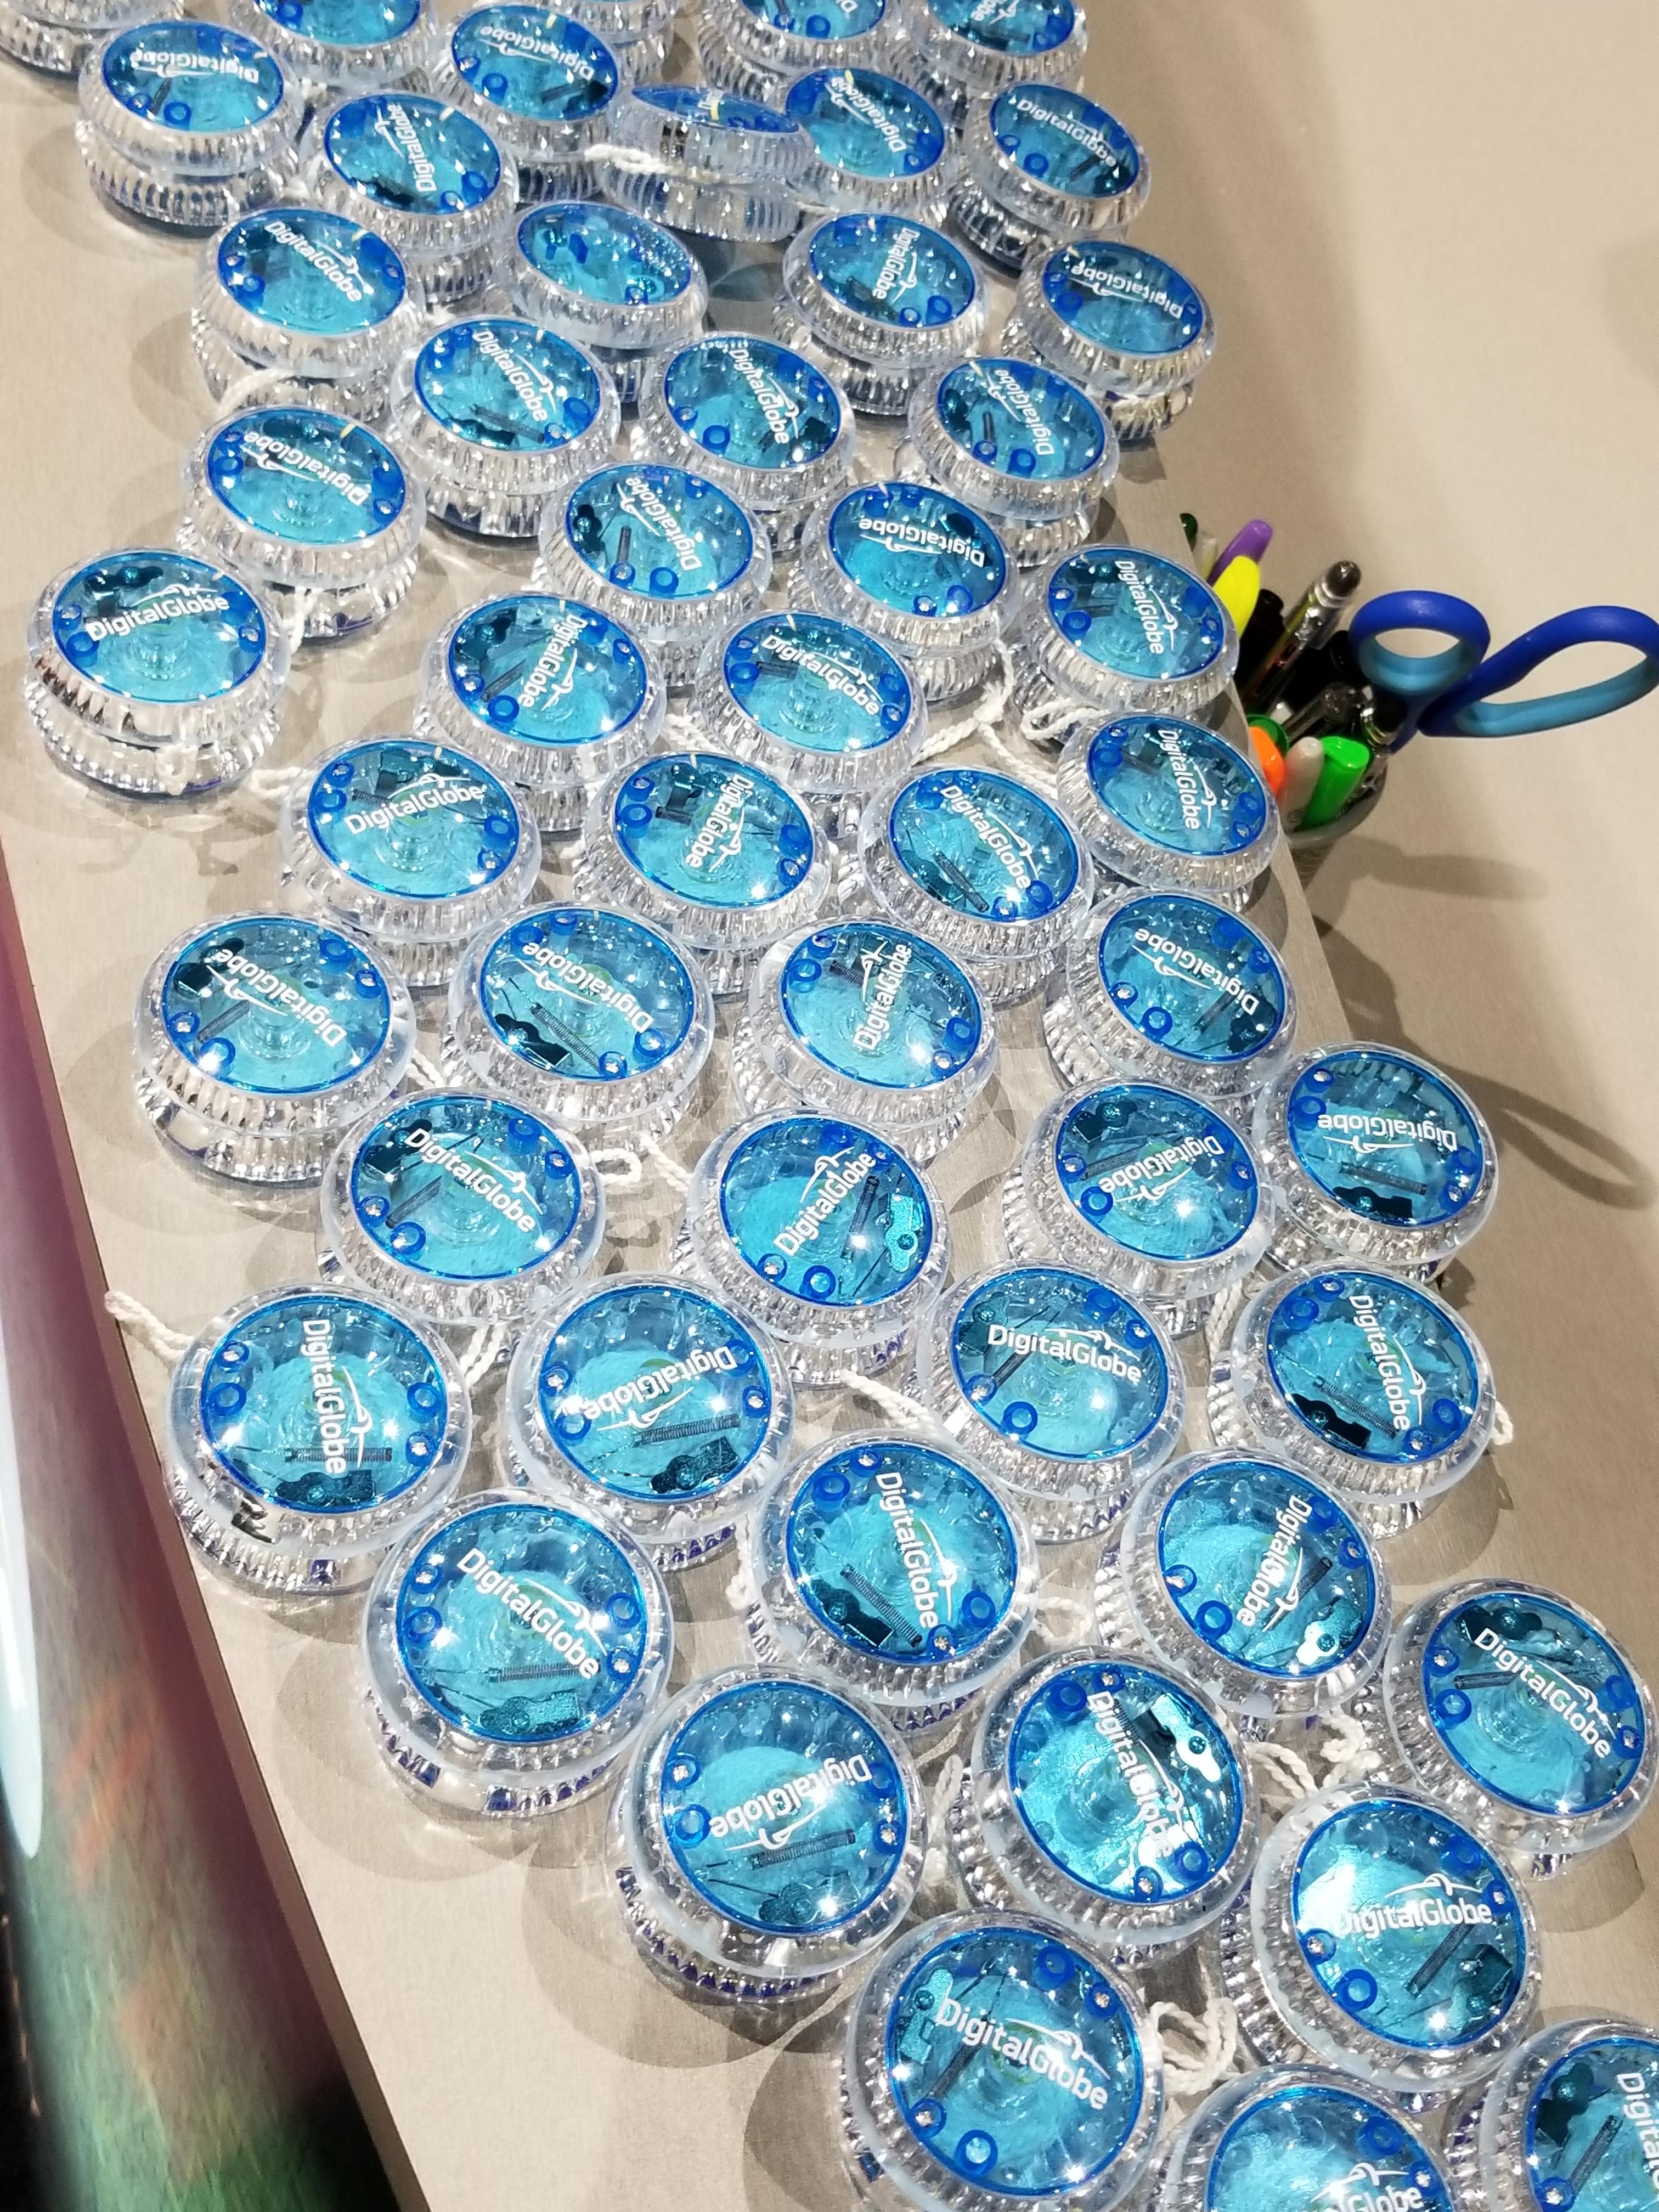
Yo-Yos at Digital Globe

Light-up yo-yos at the Digital Globe Expo area for the kids.

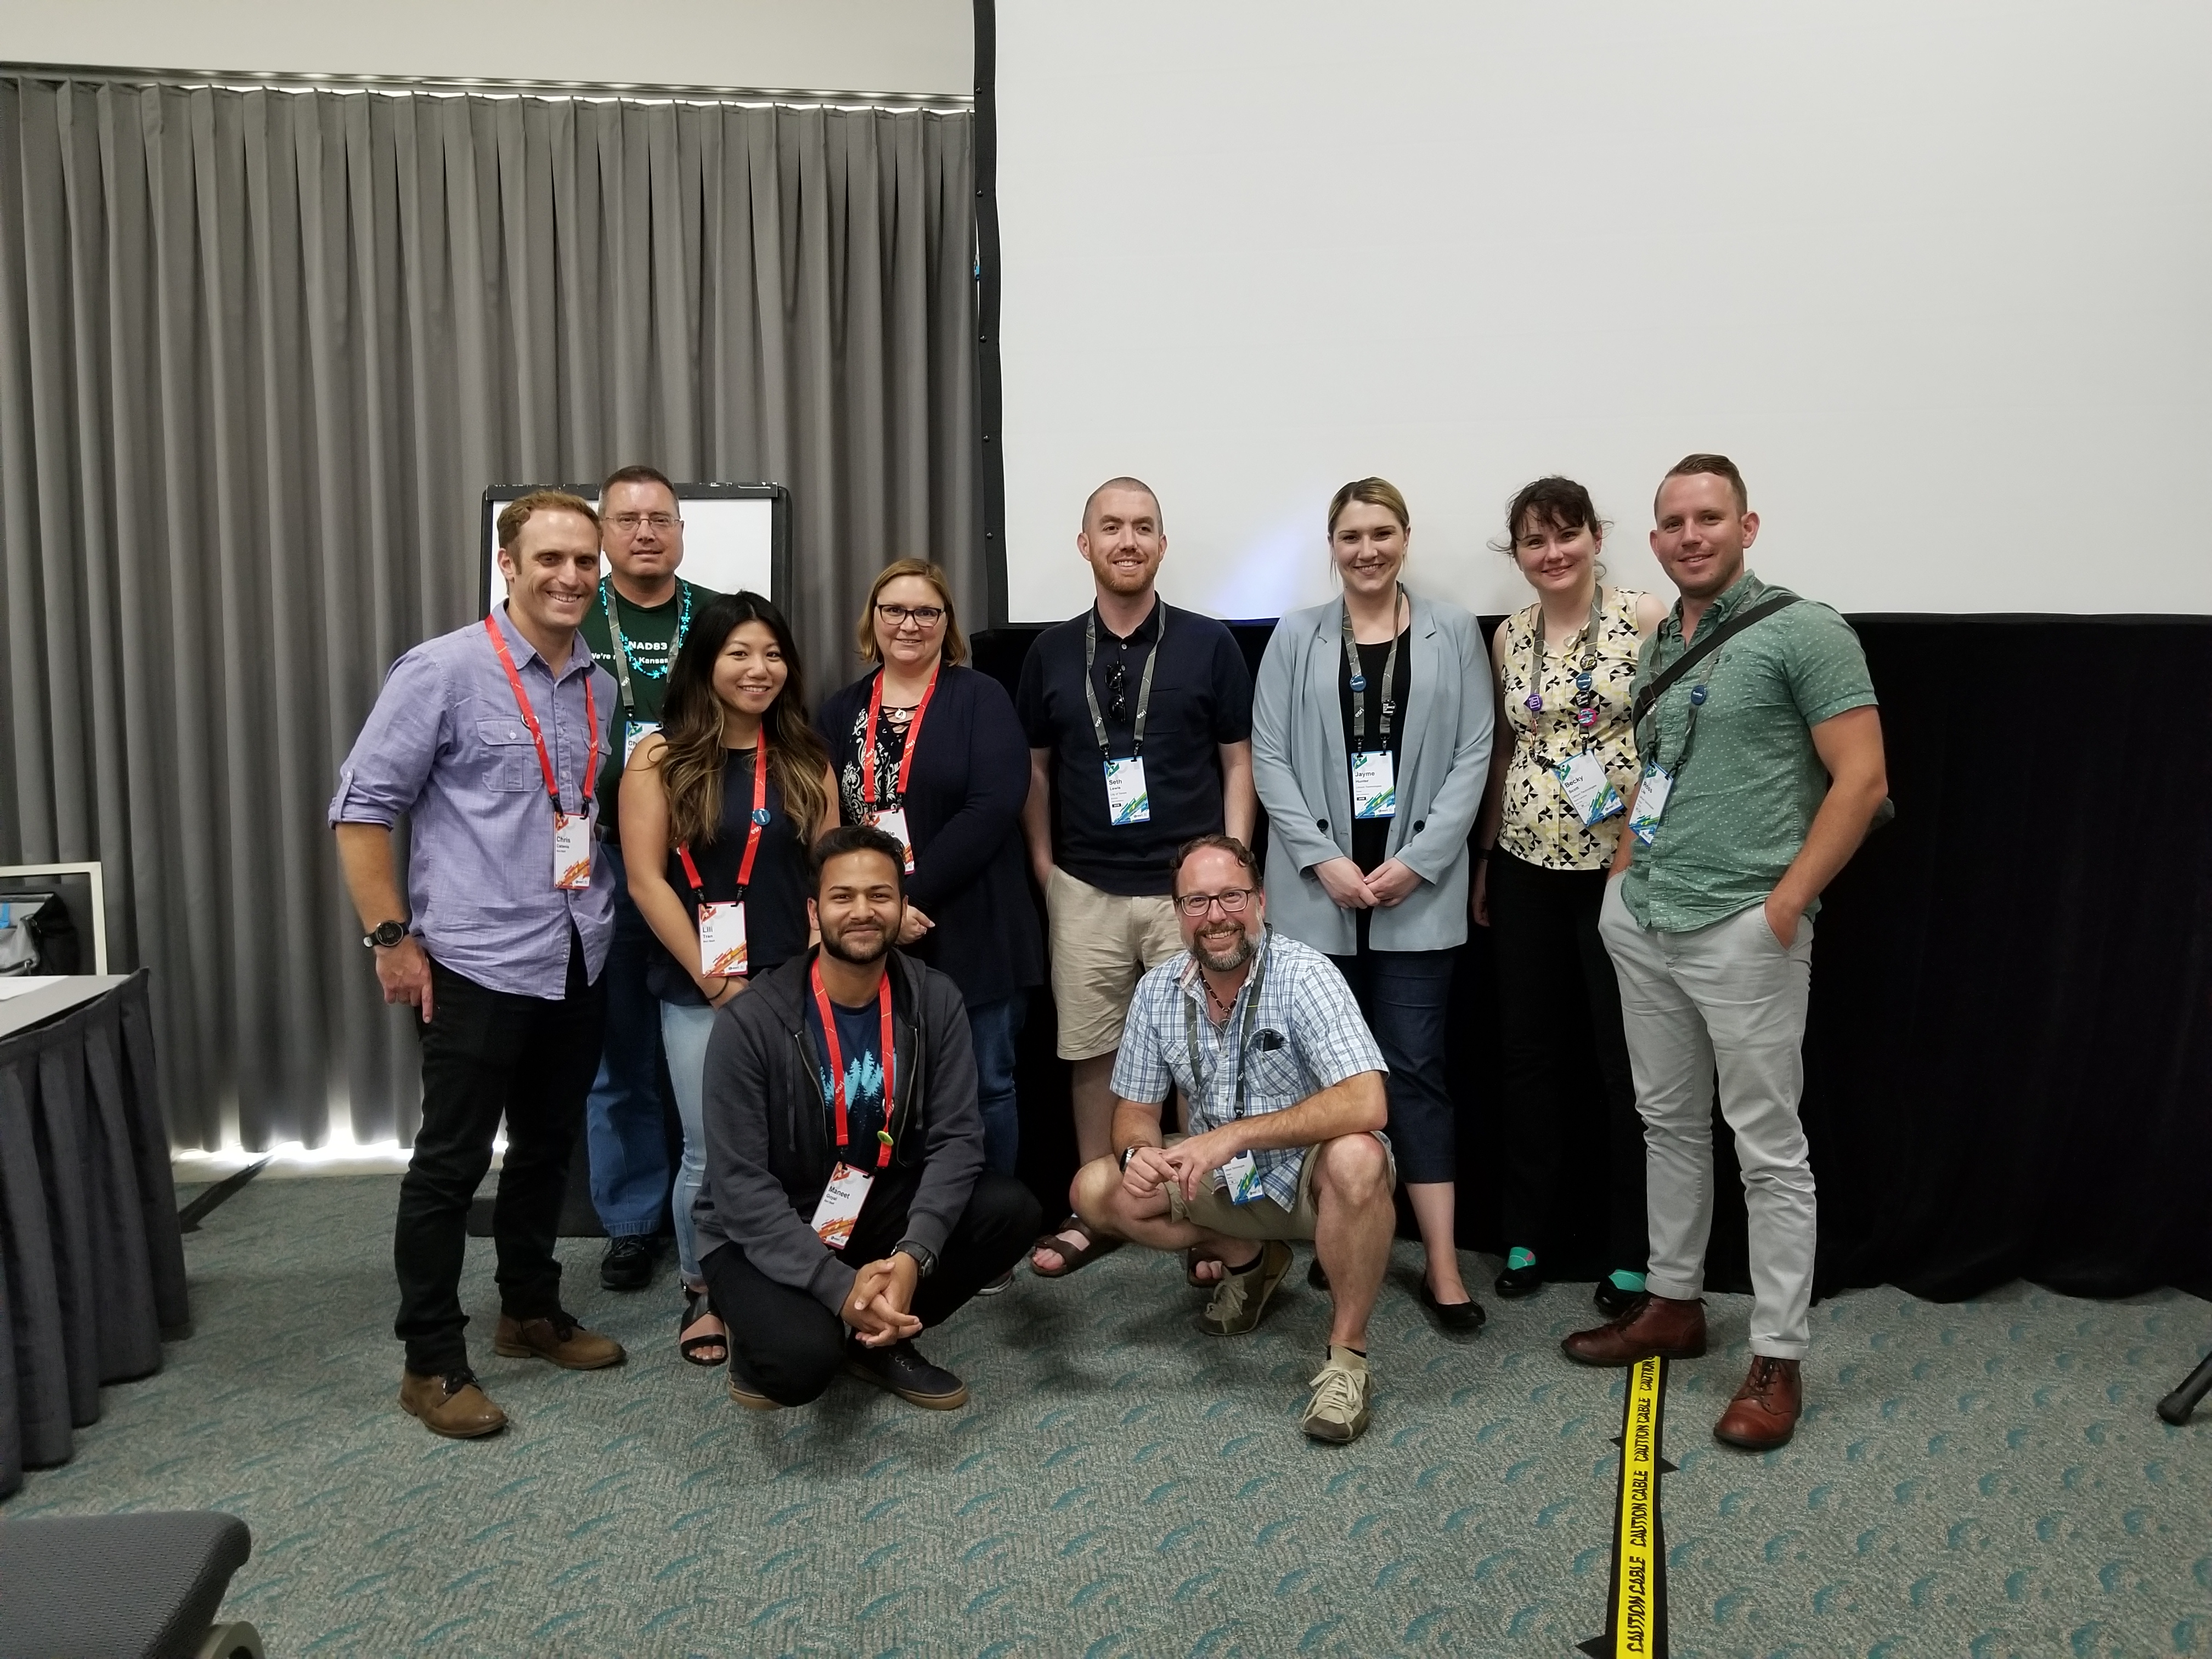
GeoNet Meet-Up

We were excited to meet our GeoNet members and learn more about why they visit GeoNet and hear their feedback about their GeoNet Community experience. Chris tells the attendees about GeoNet's recent accomplishments and statistics as well as what is to come. Thank you for coming and sharing. It is great to put faces to our members.Left-right: ChrisCatania‌, Chris Donohue, GISP‌, Lili Tran‌, Maneet Goyal‌, Michelle Mathias‌, Seth Lewis‌, and the Lithium Technologies Team -Brian, Jayme, Becky, and Ross.

GeoNet Meet-Up Group Photo at UC 2018

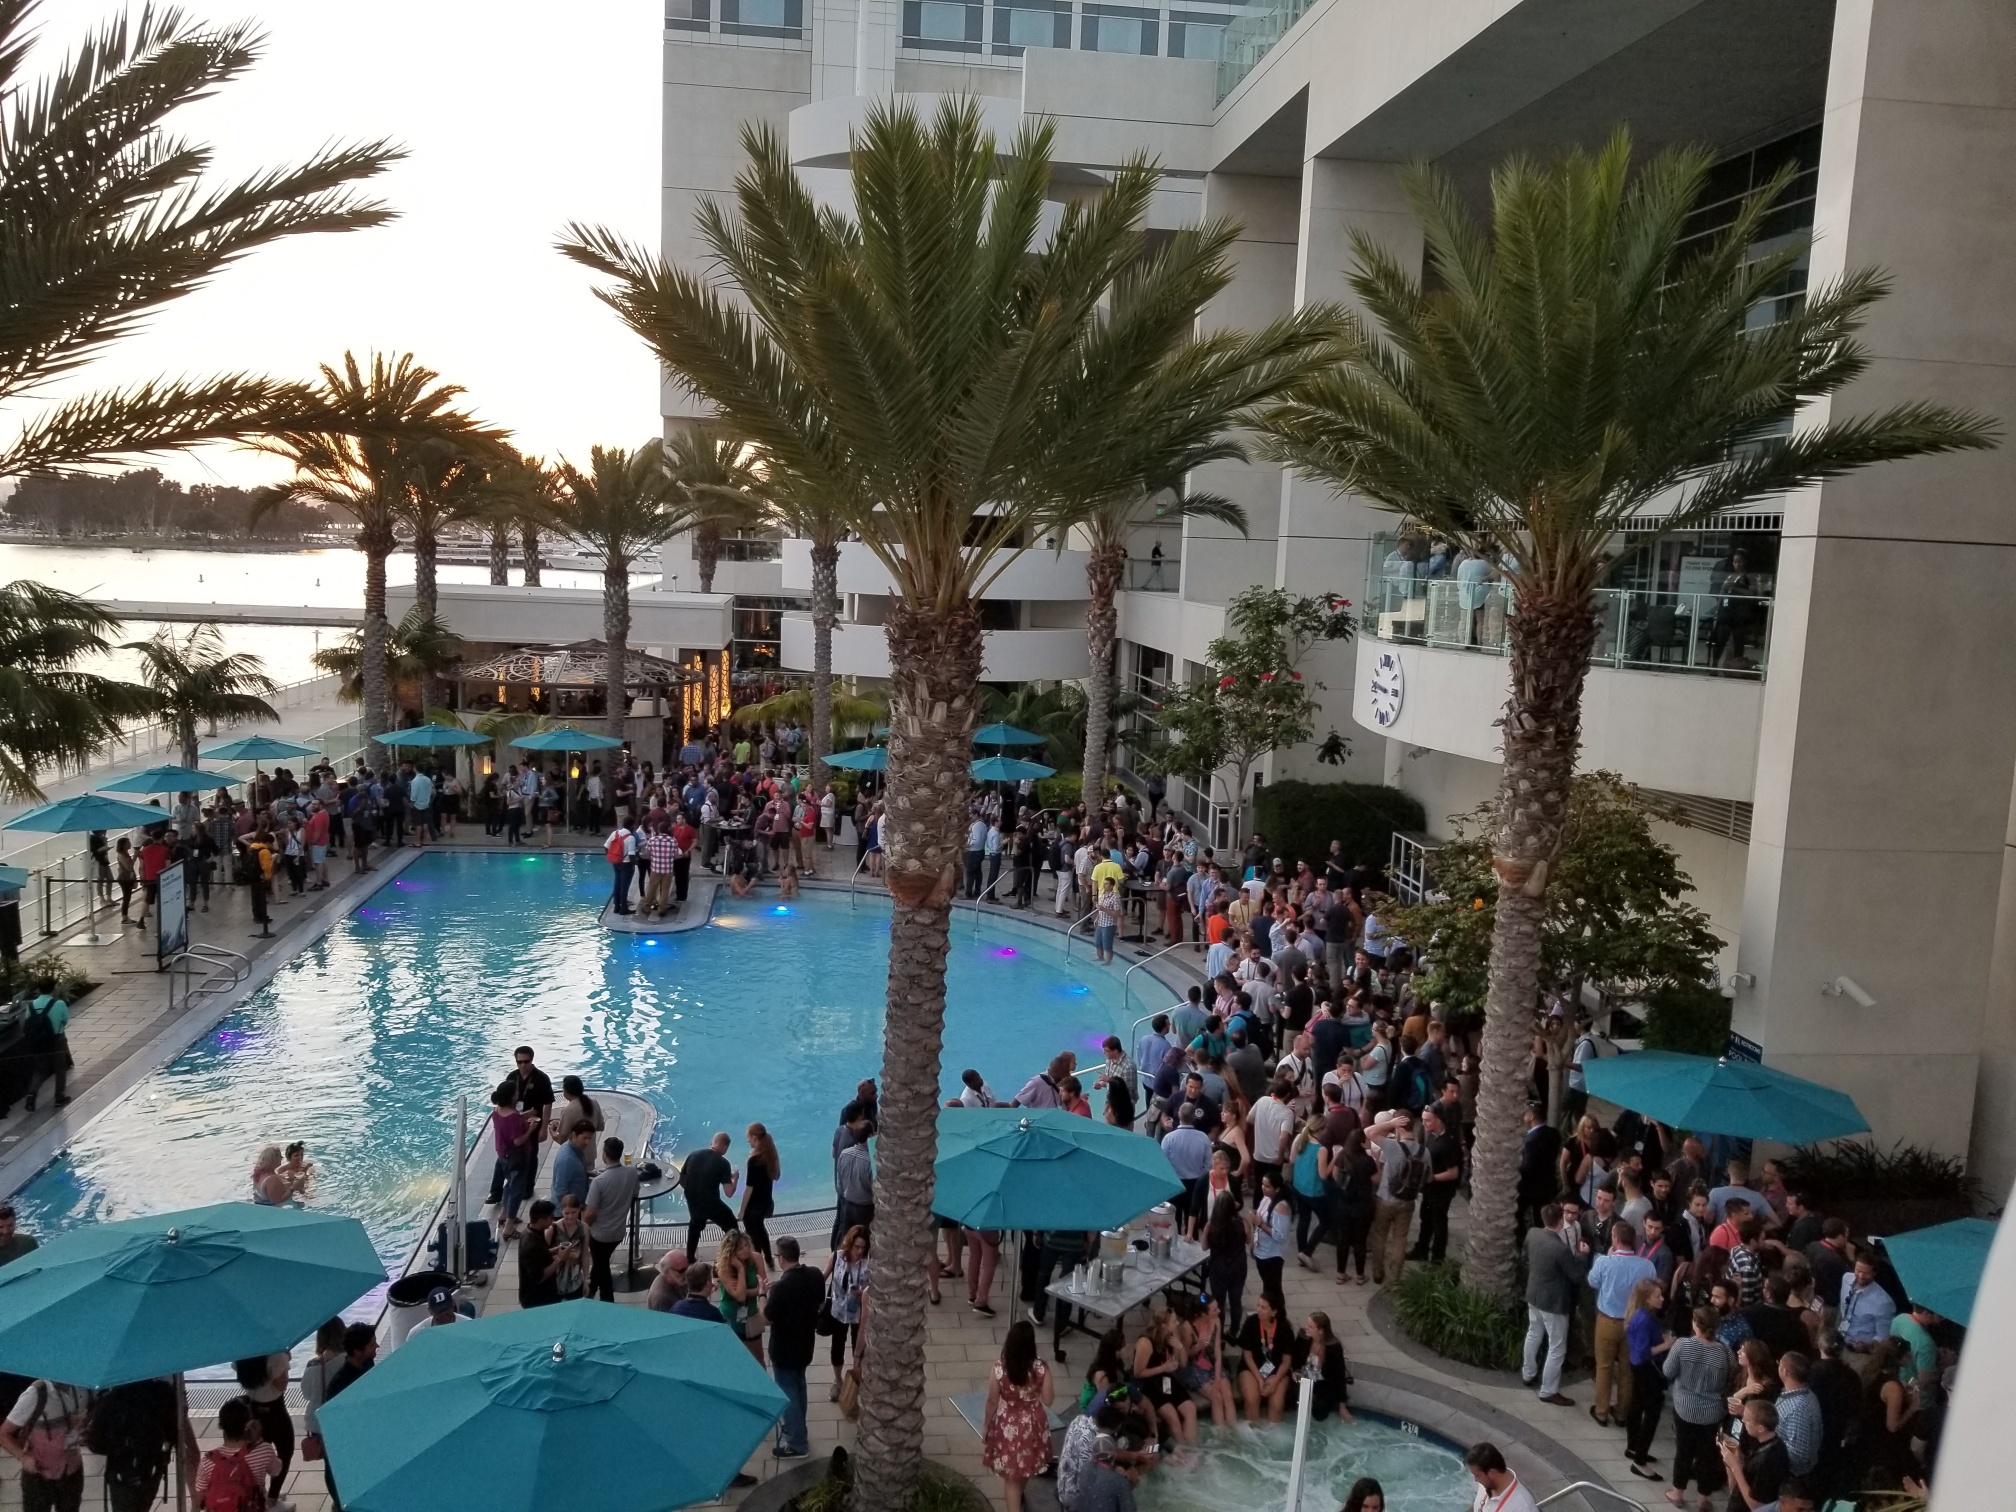
Esri Young Professionals Network‌ (YPN) Evening Social

It was shoulder-to-shoulder at the Esri YPN Evening Social on the breezy Hilton Pool Terrace. Shared great conversations with new connections.

YPN Social

If you missed the action yesterday, you can go back and read all about it at Esri UC 2018 Day 2 Updates‌. We will have more to come in a Day-4 update tomorrow including the Thursday night party. Will this one be more exciting than DevSummit 2018 Day Three? How much fun have you had this week?

more
5 4 2,558
CandaceLoya
Occasional Contributor III

Check back with us this afternoon for the afternoon session at 2:00 p.m. where we will have special presentations from Tom Crowther of Crowther Labs in ETH Zürich, Felix Finkbeiner from the Plant-for-the-Planet Initiative, James and Deborah Fallows, and our Keynote - Juan Enriquez.

What


We've also provided you with the Whats Next GIS Road Map. This beautifully colored graphic offers a hand-drawn detailed description of What's Next.


Get the highlights from this morning's sessions:

Live from the 2018 User Conference Plenary: Morning Session

Live from the 2018 User Conference Plenary: Morning Session Part 2‌ 

Table of contents

2:00 p.m. - Jack Dangermond visits E.O. Wilson at Harvard University

The final plenary session begins with an opening video of an interview between Jack Dangermond and E.O. Wilson.

Jack asks Ed Wilson, "What do you think about the future?"

Ed responds, "I am an optimist. But, I think I was born that way." 

Written by Matt Ball

When thinking about “what’s next” the status of our natural world is a priority for Esri’s founder and president Jack Dangermond. He took a trip to Harvard to meet with his old friend E.O. Wilson, the celebrated author and myrmecologist (ant expert) who gave the keynote address at this conference in 1994. He simply asked, “what should be next?” in order to create a more sustainable planet. Wilson replied that biodiversity should be the focus as we’re facing a great loss, a twin crisis to that of climate change.

“Climate change, we can reverse that, but we can’t reverse the loss of three-quarters of the species on the Earth,” Wilson said.

Dangermond suggests an ecological infrastructure of protected places, echoing Wilson’s feeling that a lot of mapping is needed to know where the maximum areas of biodiversity exist. Wilson has been involved in a movement called Half Earth, which strives to save half of the Earth’s land and sea in protected areas in order to preserve the bulk of biodiversity. Eighty percent of the species are still unknown on the planet and the Half Earth effort could save 85 percent of our planet’s biodiversity. Knowing where these species are could be captured by creating an ecological spatial database.

“We’re moving from the 15th-century geography of discovering things and where they are, and changing it into a digitized system of thinking,” Wilson said. “It’s a whole new world.”

Dangermond envisions a future of digital explorers that will build models of how the ecosystems work or make decisions about where to conserve. It’s going to require a boots-on-the-ground effort of engaged citizen scientists.

“GIS people have a huge part to play in taking aggressive action to protect the natural world,” Dangermond says.

2:05 p.m. Welcome Back!

The Crowther Lab at ETH Zürich: Ecosystem Science for

Effective Global Restoration

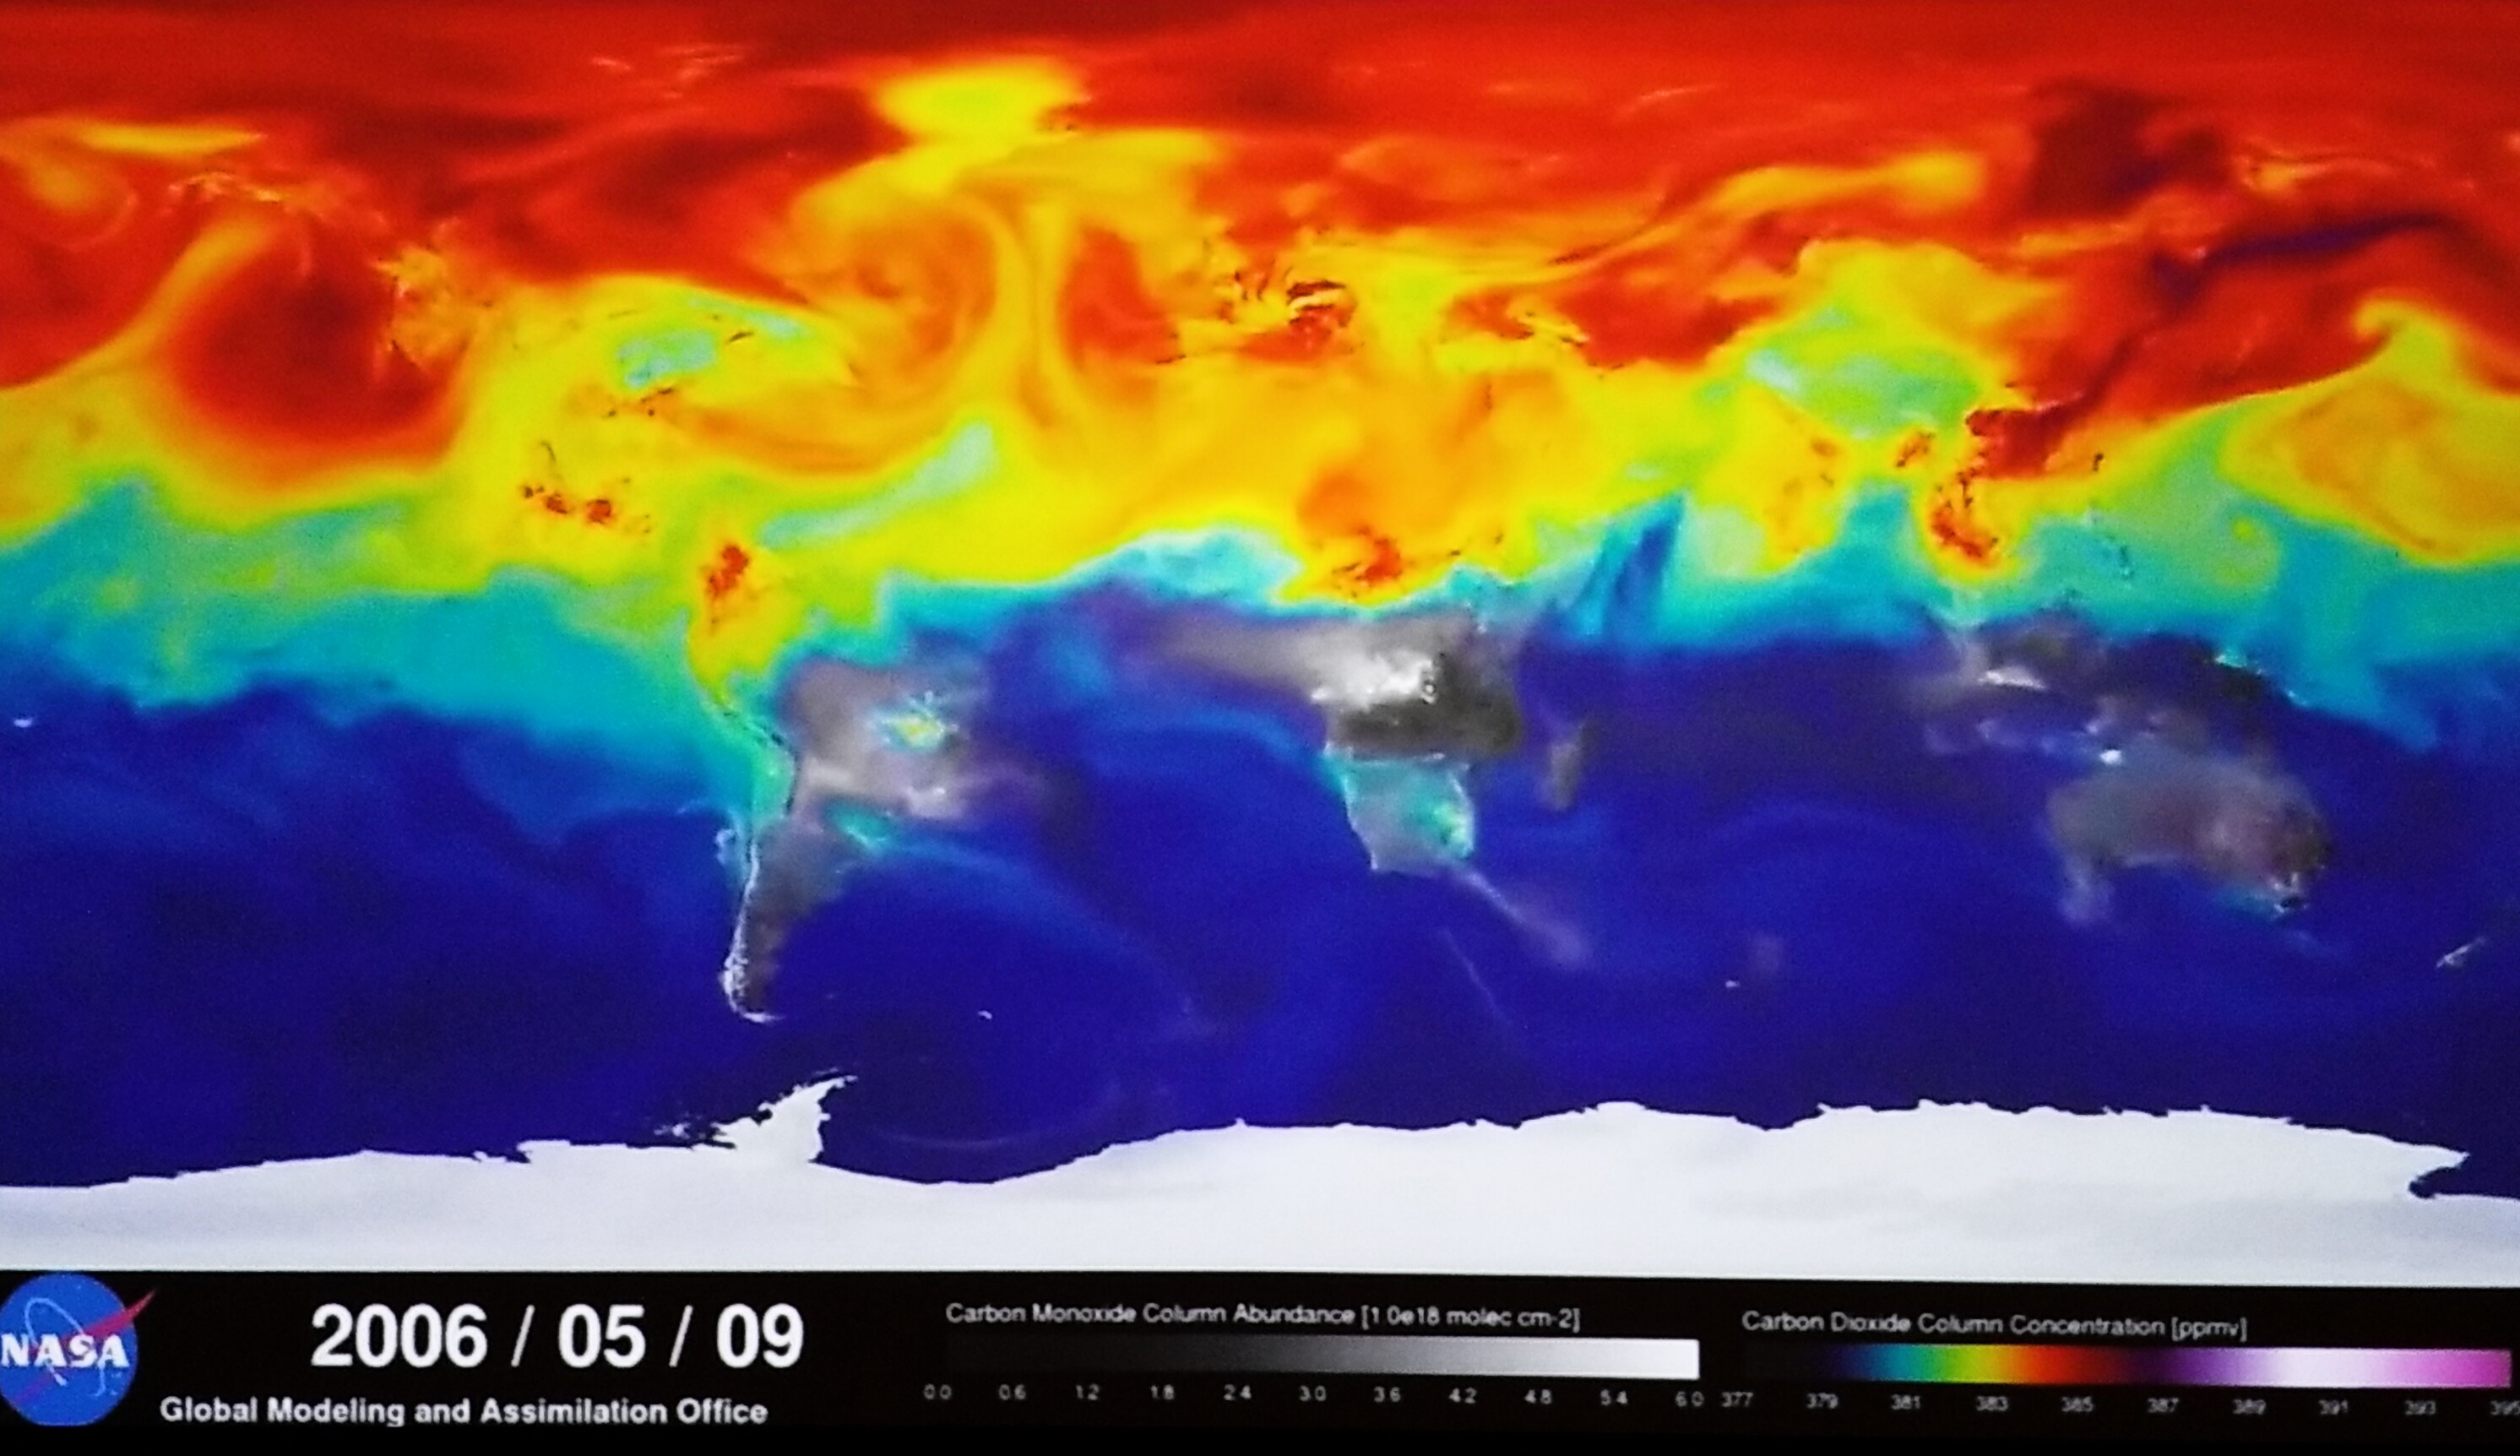
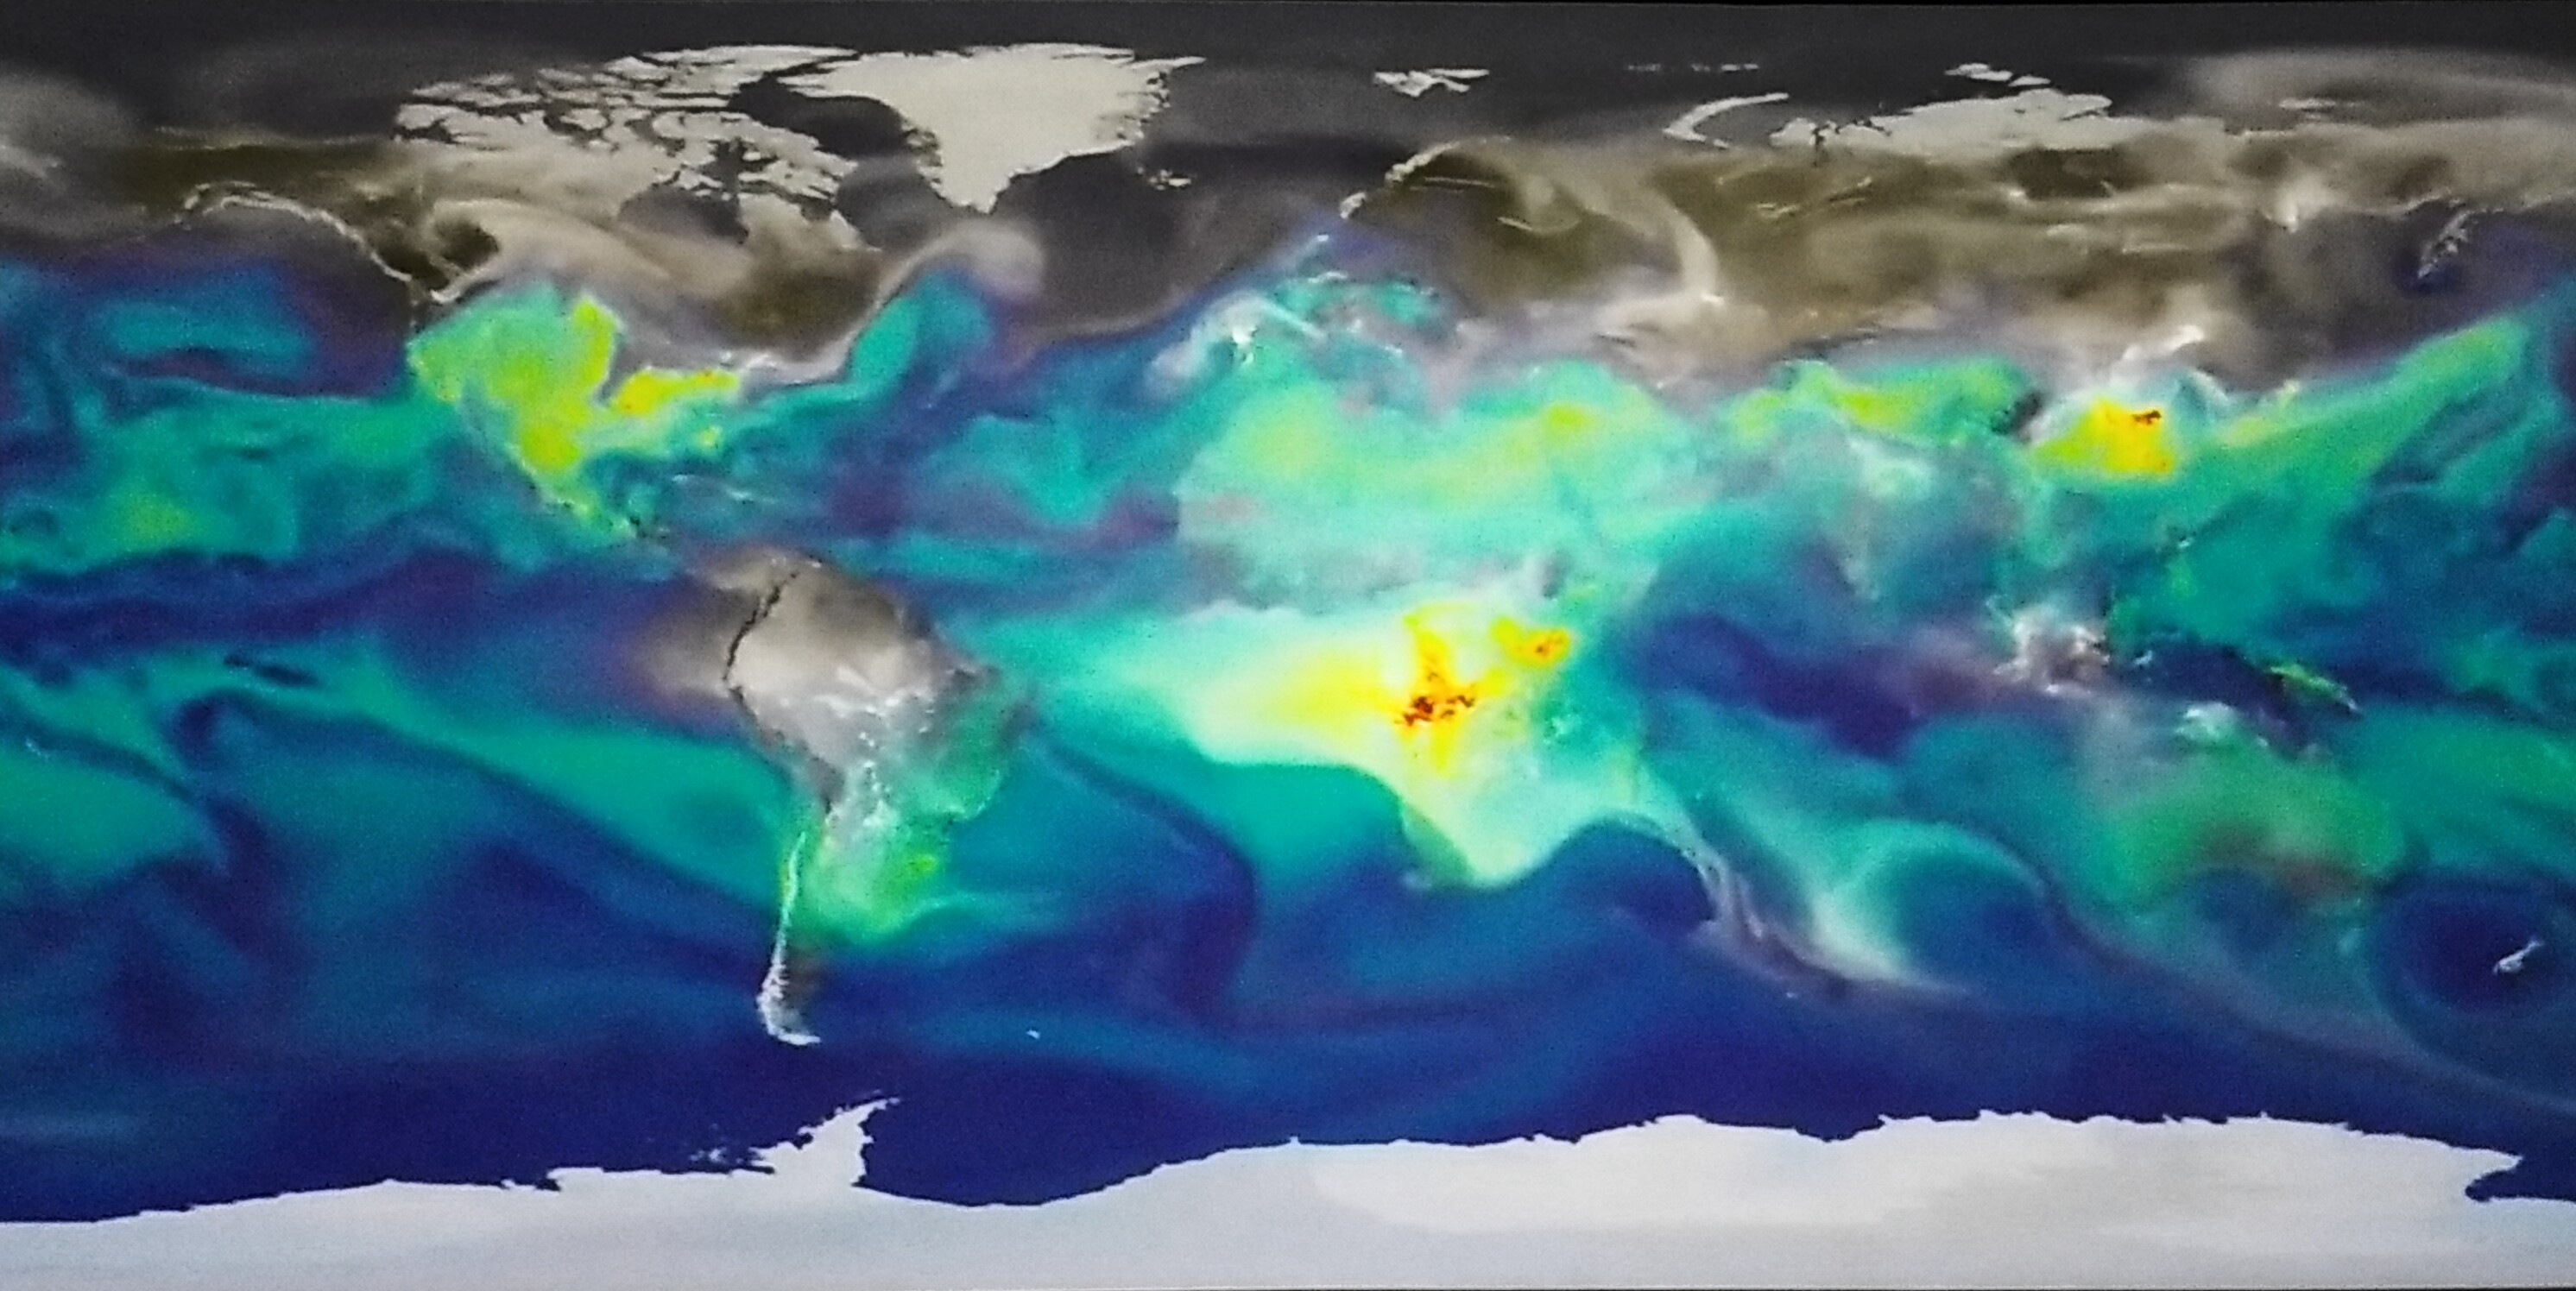
Carbon Dioxide in the atmosphere

Speaker: Tom Crowther, Professor of Global ecosystem Ecology at ETH Zürich

Jack welcomes the audience back from lunch. We are committed to working with conservation and moving forward. He introduces the next speaker, Tom Crowther from the Crowther Lab at ETH Zürich takes us on a digital presentation with a call to action to the GIS community, and the world, to learn and understand the importance of biodiversity. Global ecological restoration is the key to fight the impacts of climate change, biodiversity loss, and rural poverty.


Atmosphere of carbon monoxideThe map to the right shows the amount of carbon dioxide in the atmosphere during the winter months (in red) in comparison to the Spring when trees are in full bloom (in blue).

It is estimated that only 3% of the trees in the world make it to maturity. What we need to know is which soils these trees need to grow and survive.

Below the canopy's surface, below the trees and deeper down into the soil, there is a whole ecosystem that helps grow trees, grow vegetation, and understanding this ecosystem allows us to understand these ecosystems effectively we have room for another 1.2 trillion trees. 

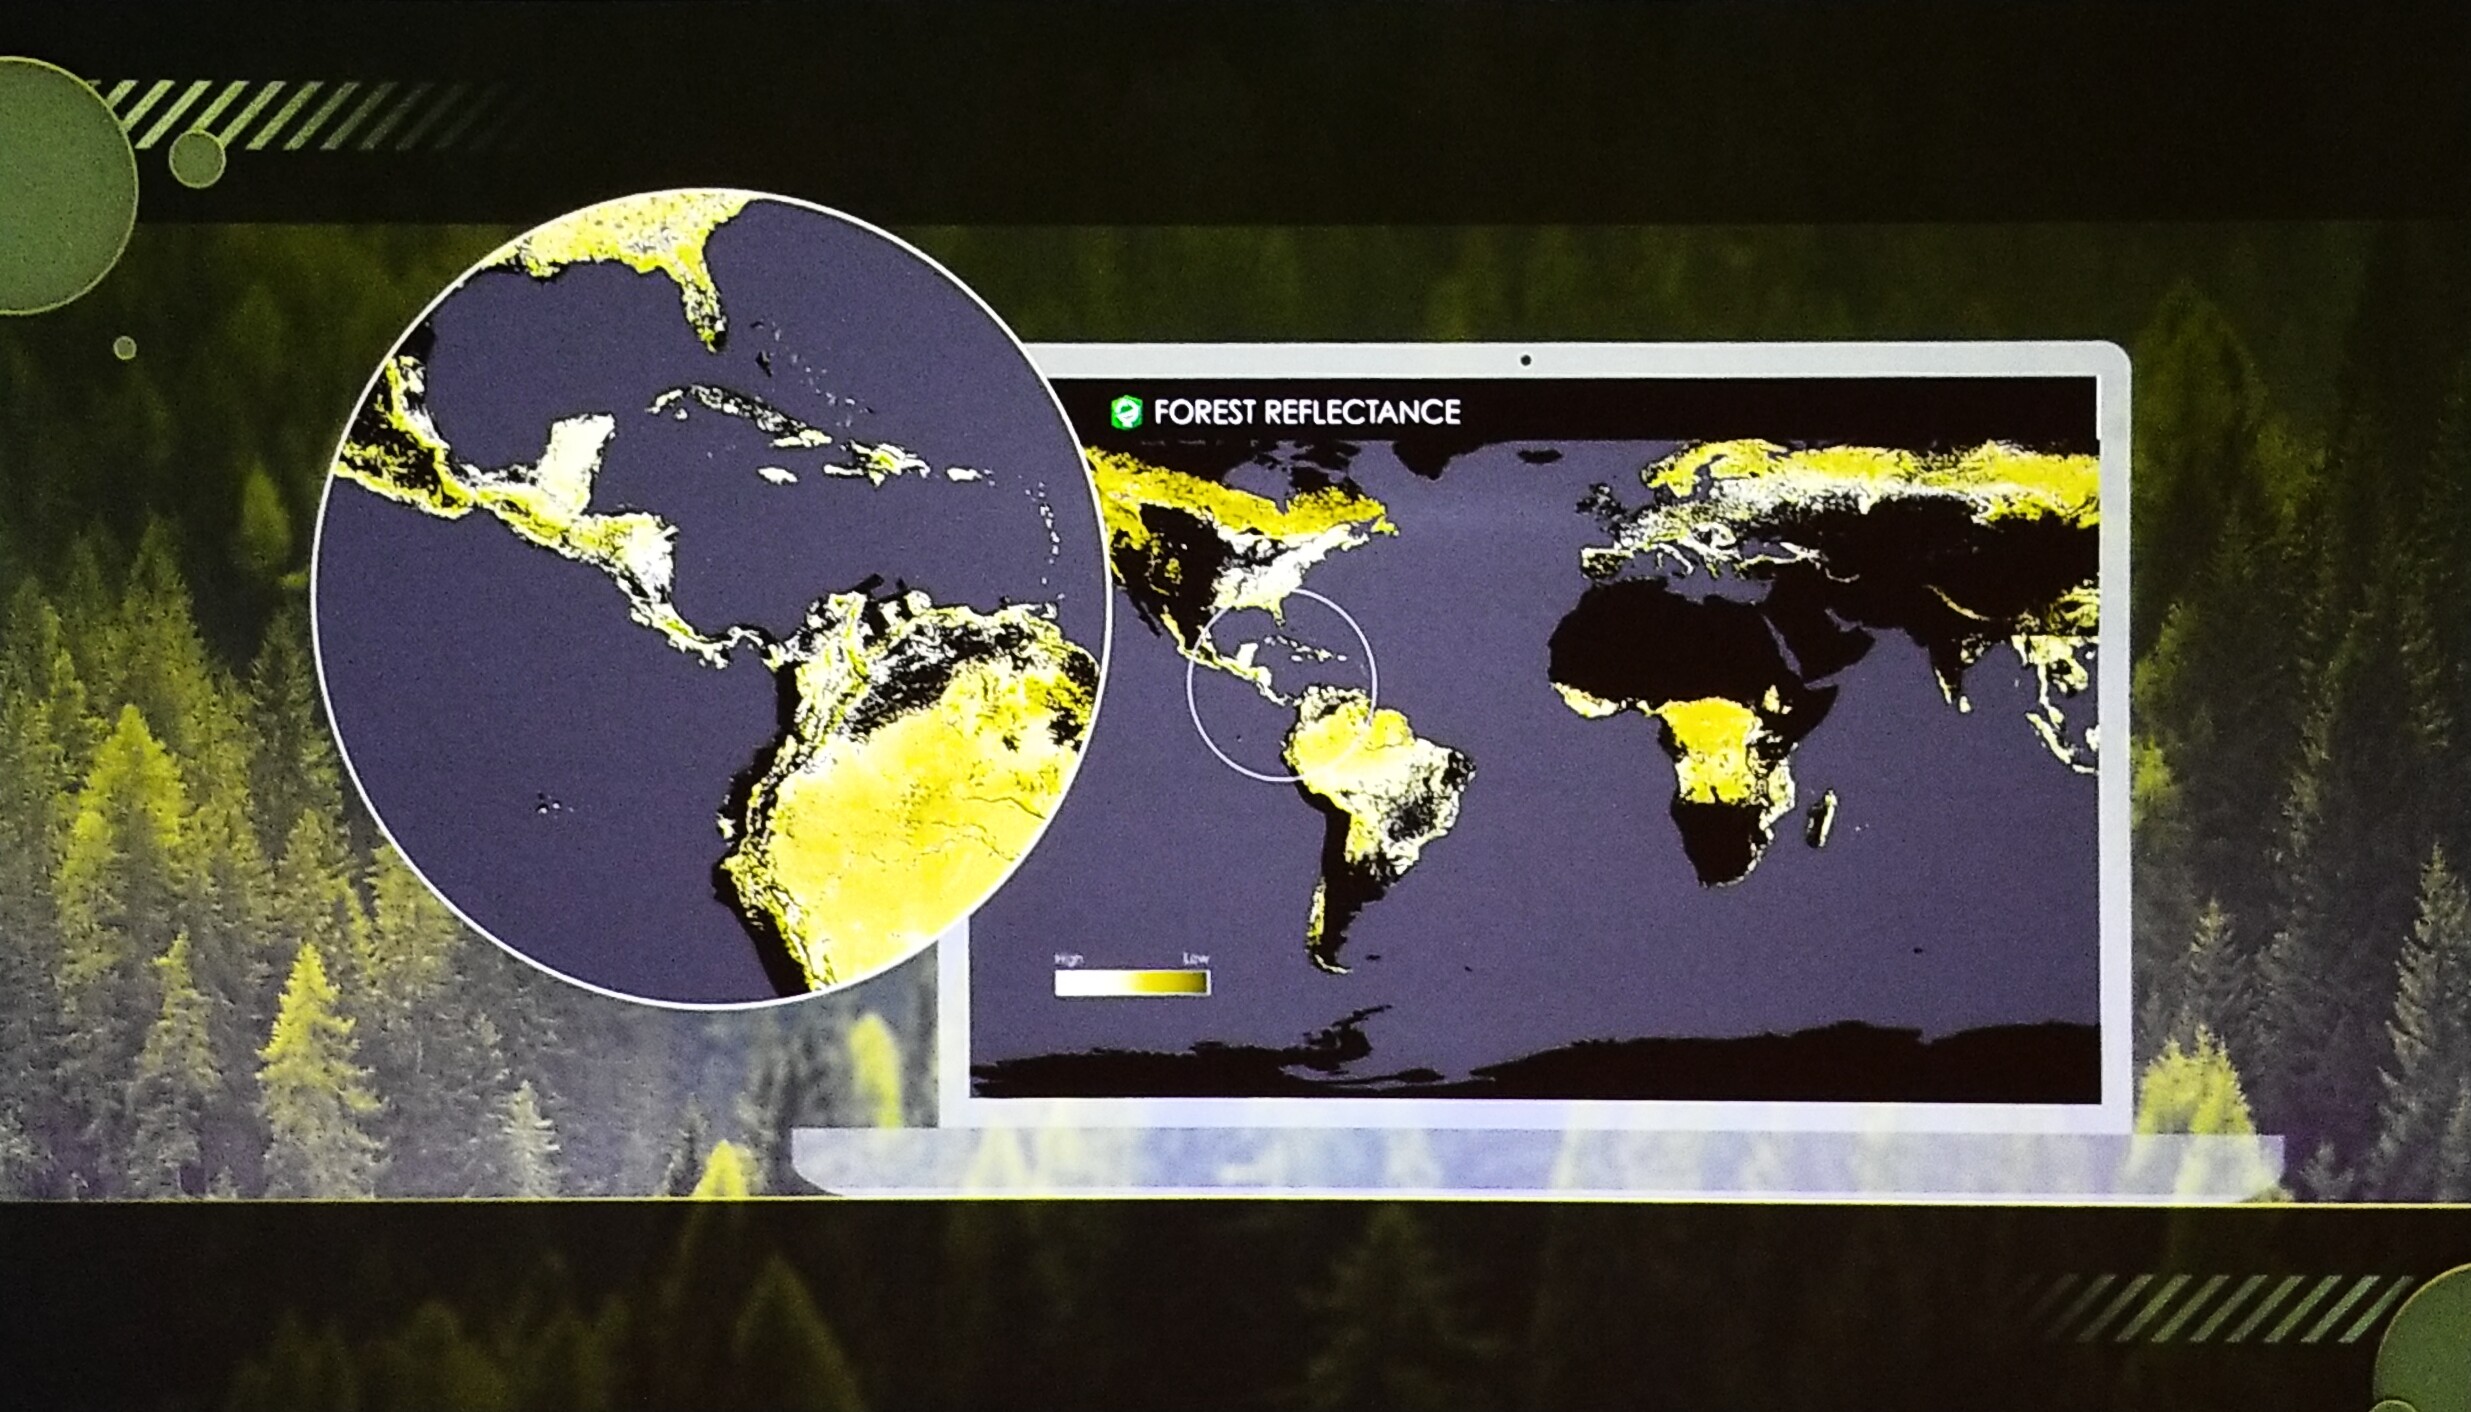
Forest Reflectance of Trees on the Globe

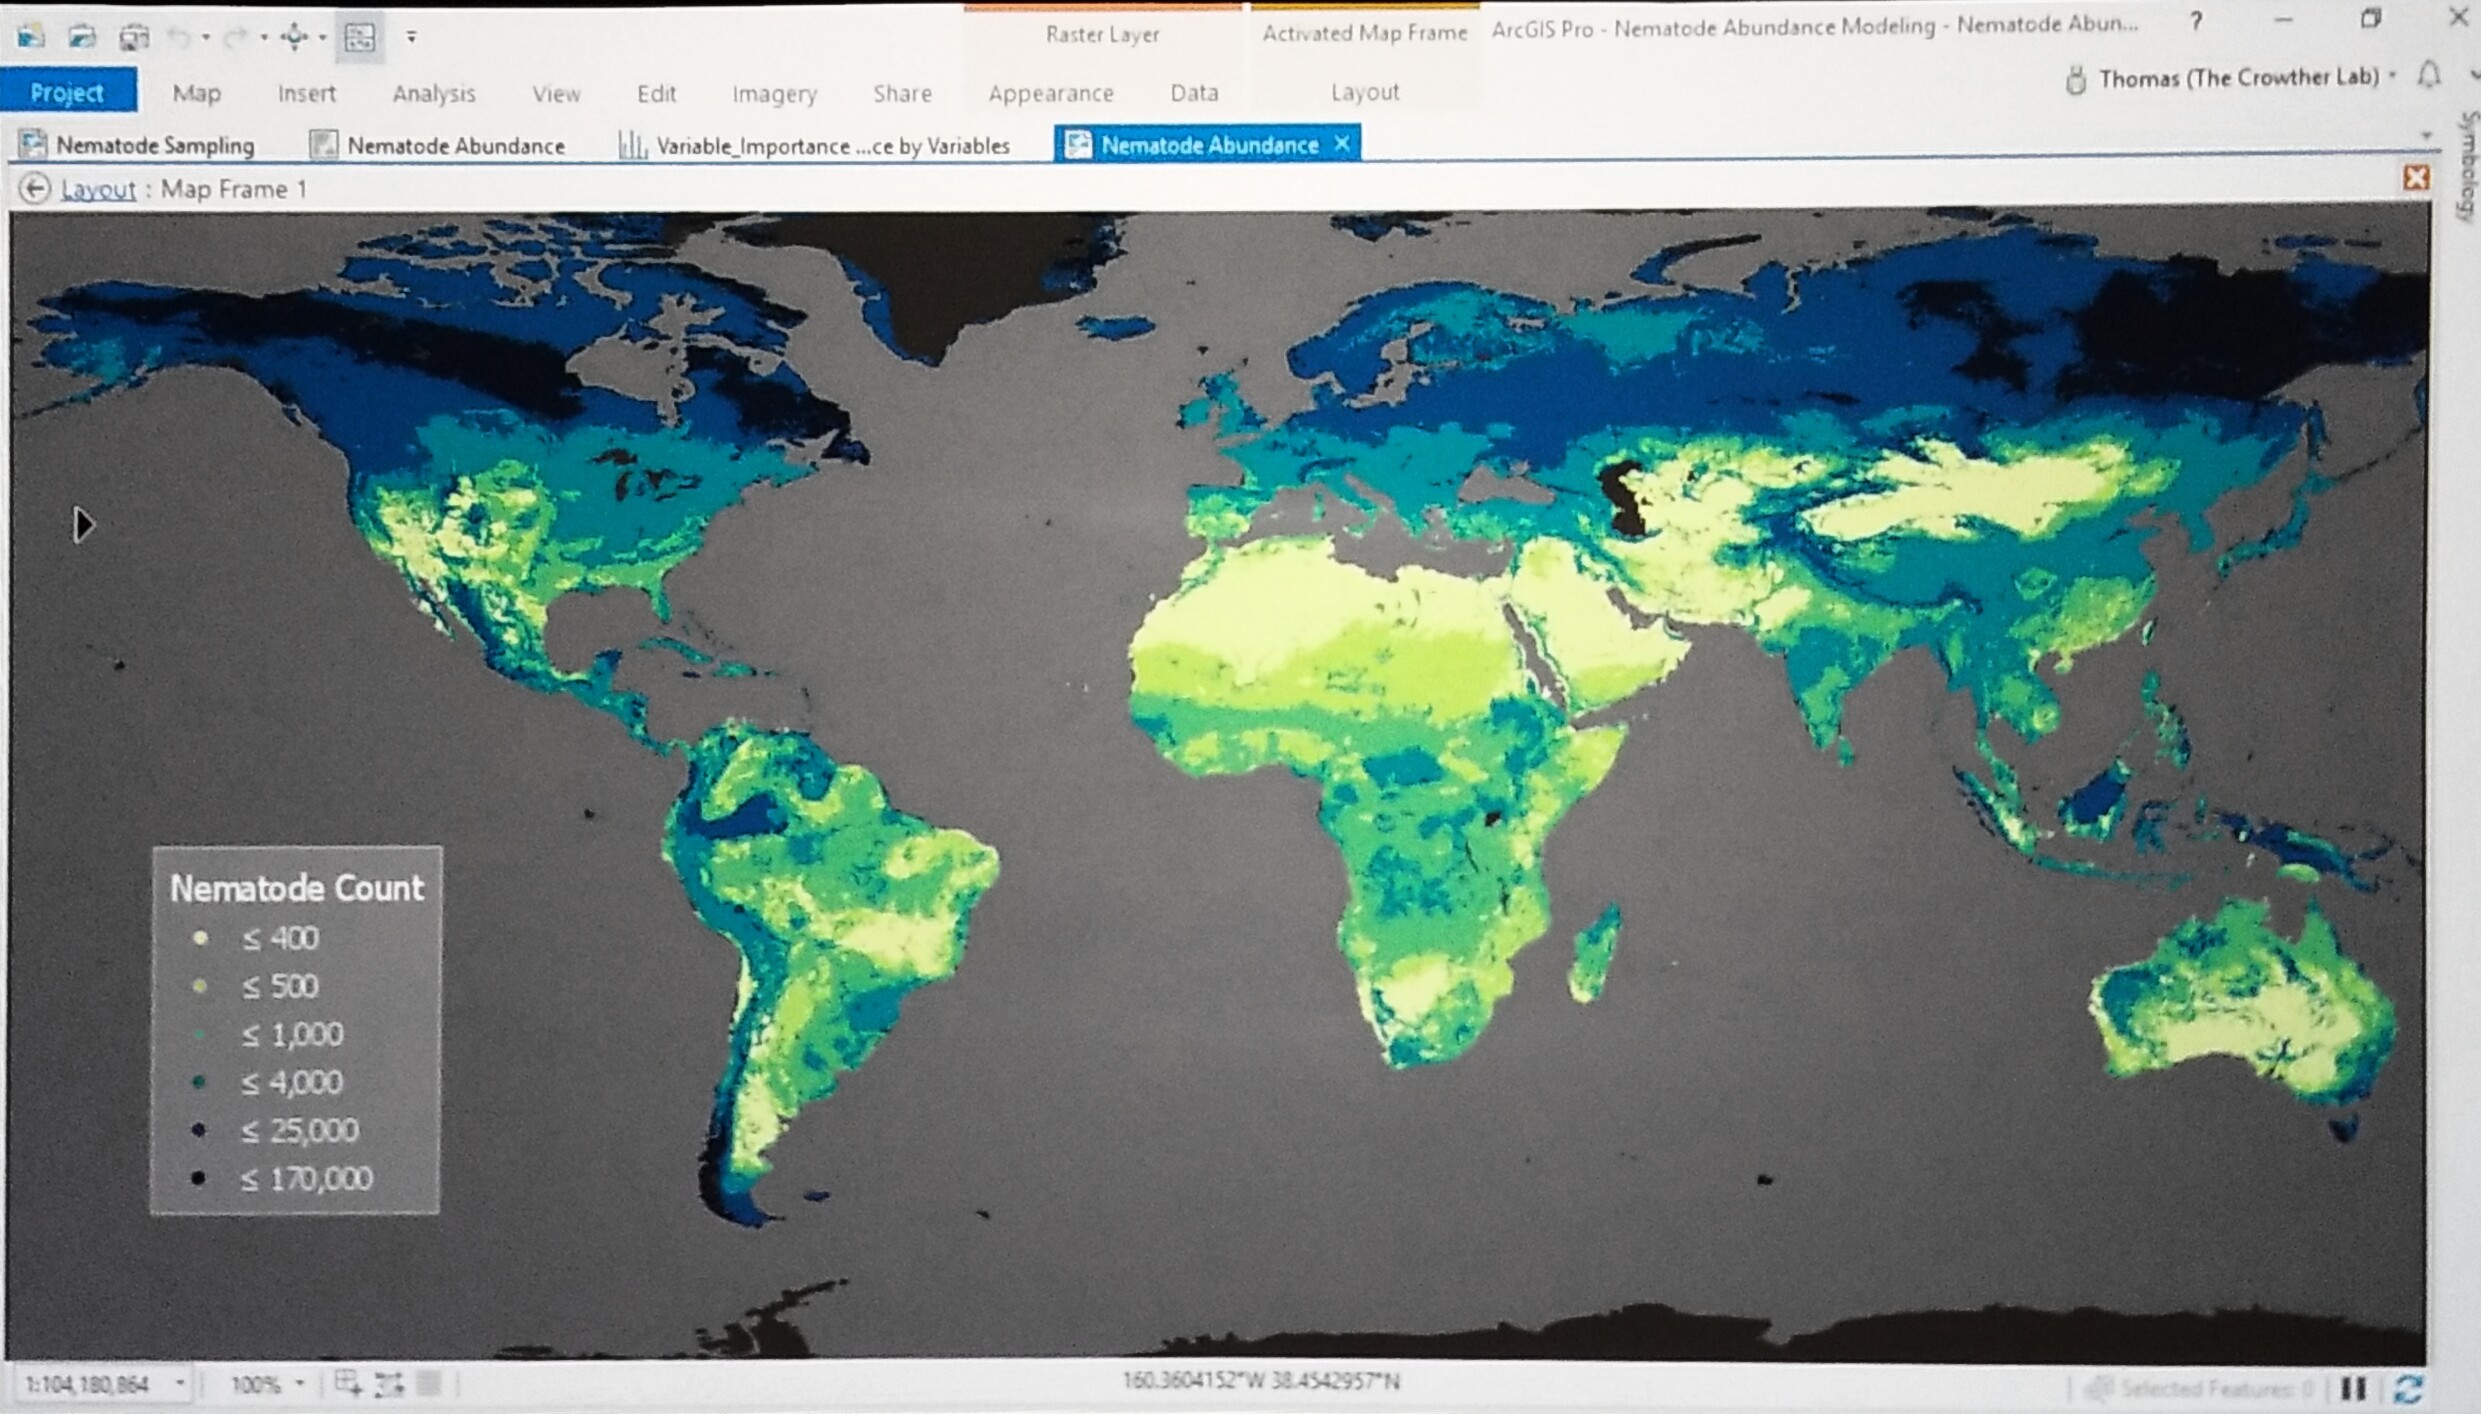
For decades, soil scientists have been taking samples of the species in the soil. We know so little about this ecosystem, but what we learned is that the soil compositions are home to billions of nematodes.

We did our research to find out why some areas have more nematodes, and others have less.

Nematode analysis

With a new perspective on the diversity of the soil samples, we now know that planting a diversity of tree species has a positive impact compared to planting only the single and fastest growing tree species.

Jack chats with Tom briefly, "As a landscape architect, I always viewed the world as my garden." He thanks Tom for being here.

2:15 p.m. - The Trillion Tree Campaign 

Plant-for-the-Planet Initiative

Speaker: Felix Finkbeiner

Opening with a video of Felix Finkbeiner's inspiring words about the climate crisis.

Wangari Maathai (1940-2011), the founder of the Green Belt Movement, started the first movement inspiring the Trillion Tree Campaign and Felix was inspired by her movement.

He encouraged his fellow students to go out into the world and plant trees. He began Plant for the Planet in schools after inspiring his fellow students to plant a tree. And over time, students speaking up for the urgent problem of the climate crisis.

Today, more than 15 billion trees have been planted across the world as the movement spreads and support continues to grow.

Where do we go from here? How many trees exist in the world? And how many trees can we plant?

He asked lots of scientists and no one had an answer until he met with Tom Crowthers. He relayed that we have 3 trillion trees in the world and can still plant 1.2 trillion more.

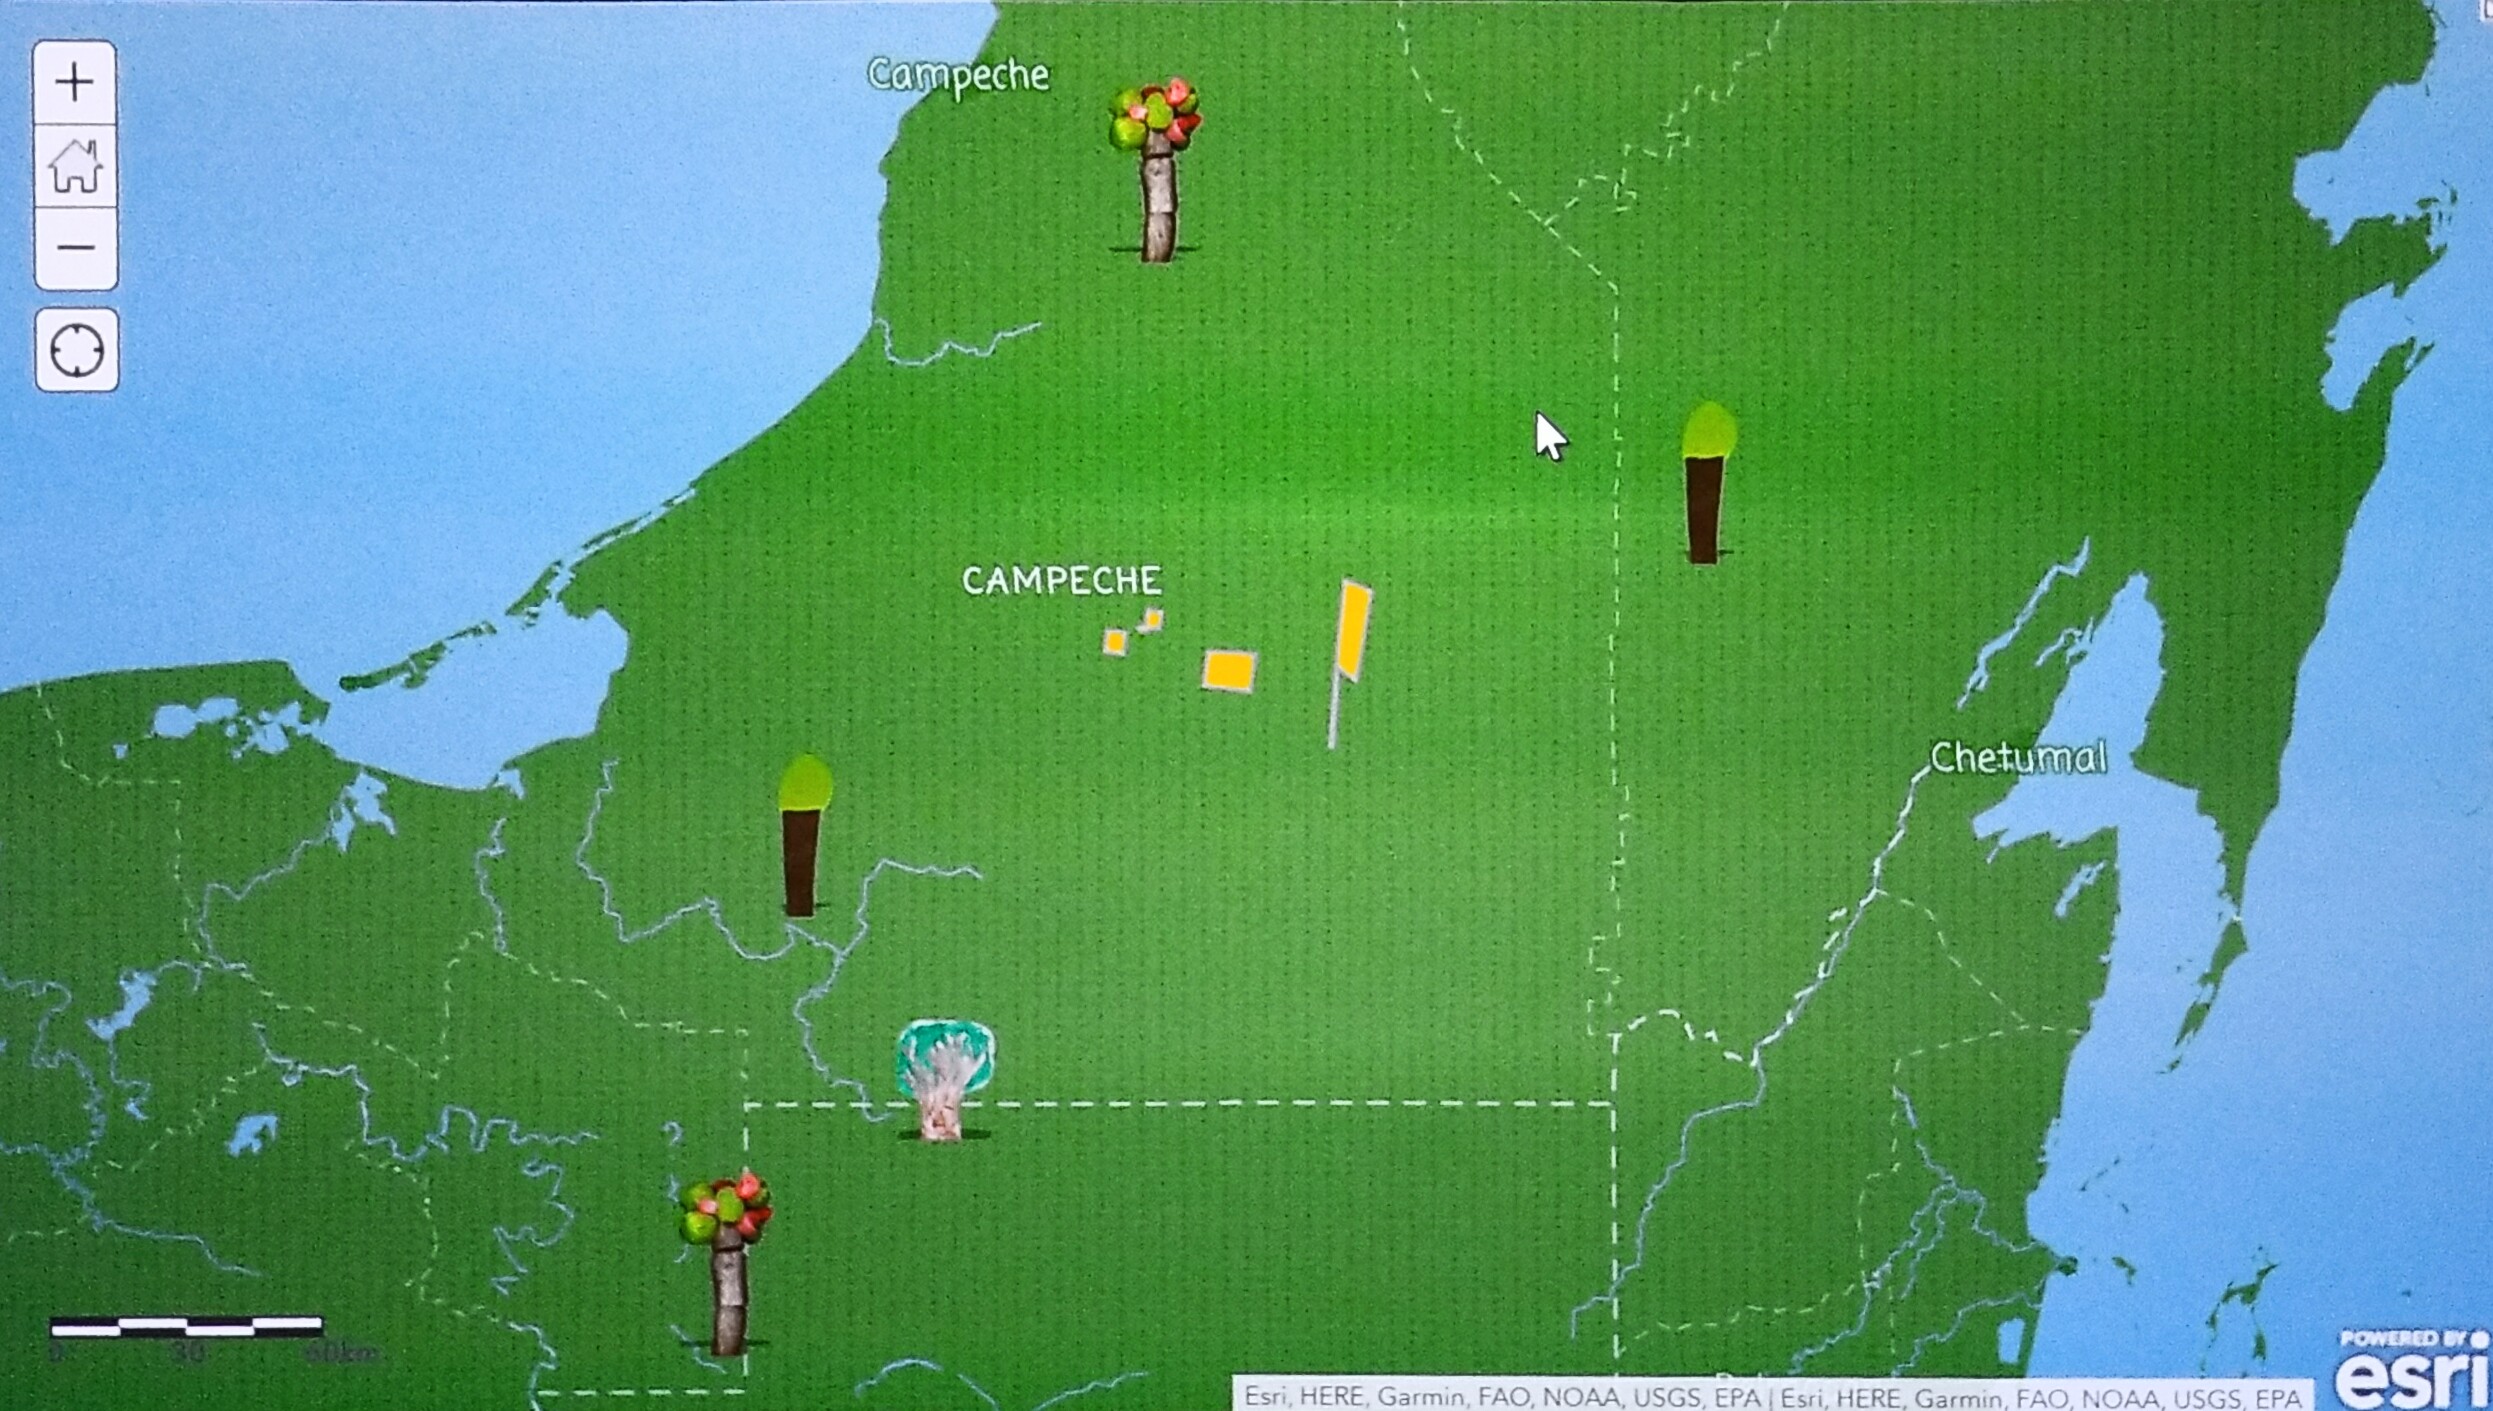
Yucatan tree planting

When he visited the Yucatan Peninsula to find out why so much of the forest was disappearing. Today, they employ 100 employees that plant 6,000 trees a day at a cost of just 1 Euro a year to plant the trees. Many of the trees planted are funded by companies that want to be carbon neutral. May be able to plant 100-million trees in Mexico by 2020.

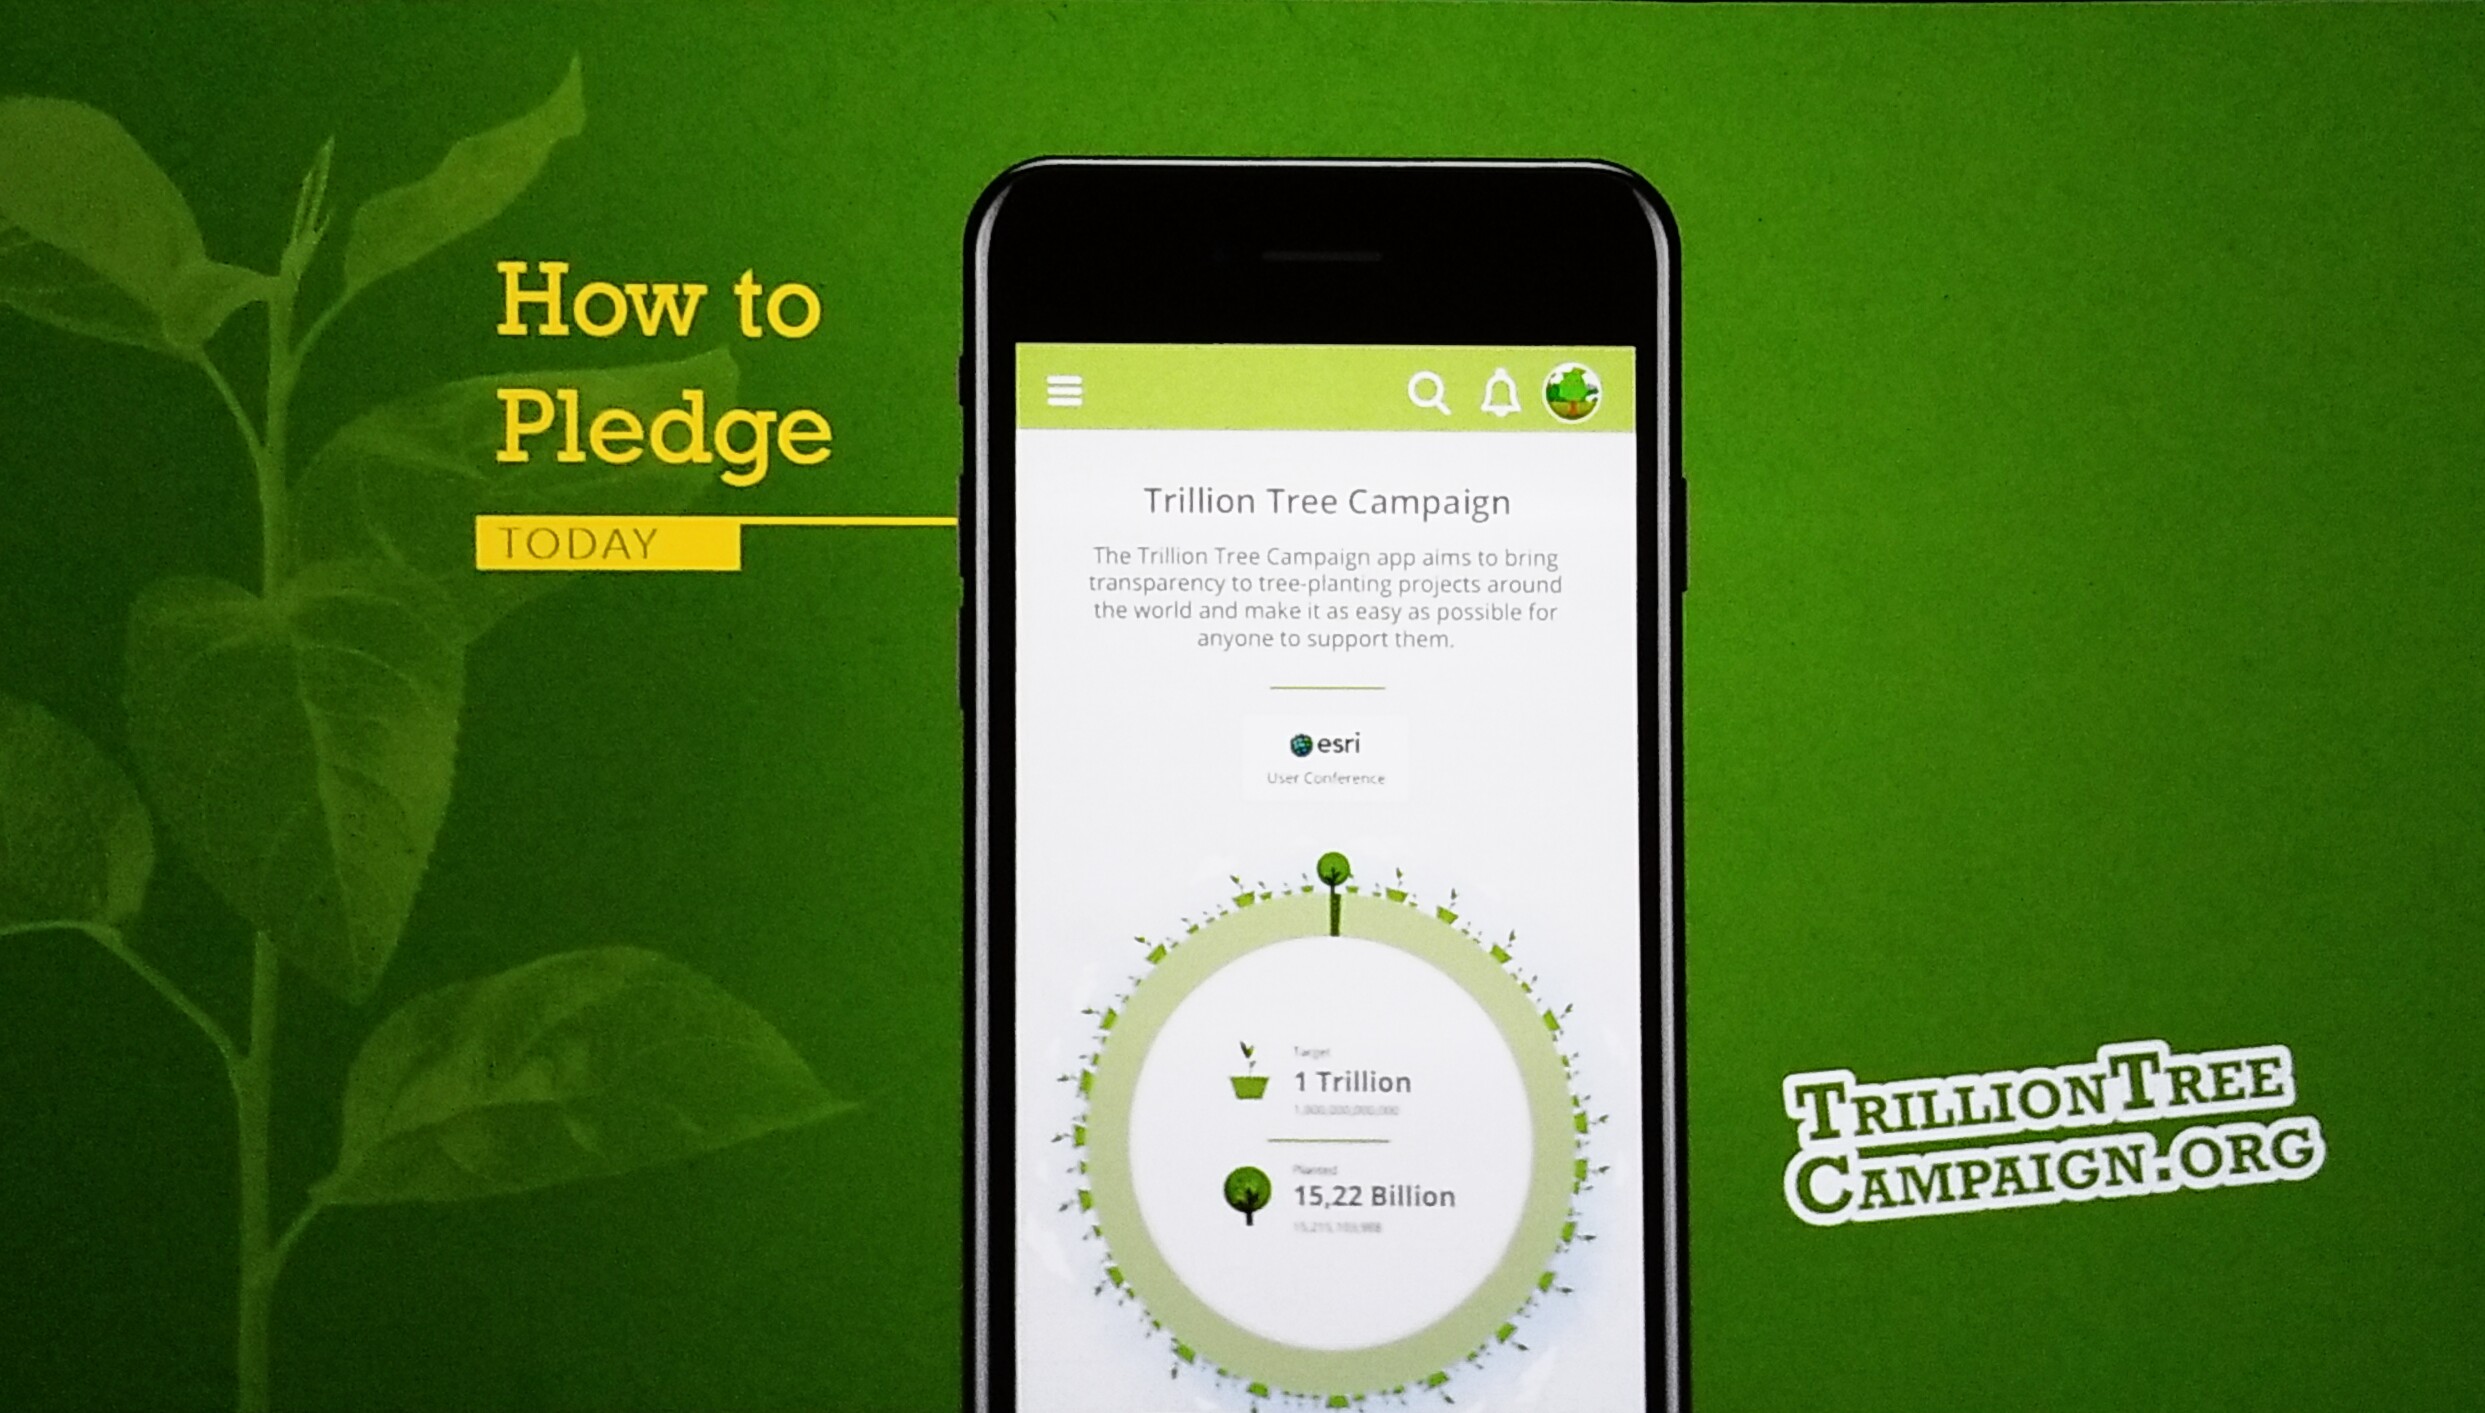
We want to make it as easy and as fun as possible for anyone to plant trees or get involved with planting trees. They created an app that is live today. Trilliontreecampaign.org.

Trillion Tree Campaign AppWith this app, you can record the trees you plant and if you can't plant trees, you can donate for the cause. You can track other countries to see how many trees they are planting. You can see what others are doing and follow them as well as gift them a tree to help them reach their target goal for trees.

Written by Matt Ball

When Felix Finkbeiner was nine years old his teacher asked him to give a presentation about climate change. He learned of Wangari Maathai who planted a million trees and urged his class to plant trees. Other students loved the idea, and they soon planted their first tree. An early website was created with a simple comparison of what school planted the most trees. Soon schools competed and they achieved the goal of a million trees planted in Germany, and scaled it to other countries. Today, there are 15Billion trees planted.

When we plant TREES we plant the seeds of #peace and seeds of #hope.

- Wangari Maathai

We had added questions. How many trees are there in the world? Scientists couldn’t answer, until we met Tom Crowther who started a three-year research project. He came back with the answers that there are three trillions trees exist and we have room for a trillion more.

Plant-for-the-Planet now has taken charge of 22,000 hectares, and employ 100 people planting trees in the Yucatan Peninsula in Mexico. People have said that paying for a trillion trees isn’t possible. However, Plant-for-the-Planet has reduced the cost of planting each tree to just 1 Euro per planted tree.

To reach the goal of reaching a trillion trees will require much more. To make it easier to plant trees we created a simple app (using ArcGIS) that goes live today. My personal goal is to plant 1000 trees. If I’m planting trees I can register my trees, their species and location.

It starts today with the Yucatan Reforestation project and will grow to other restoration projects. The app lets us see the 3 trillion trees and where more than a trillion can be planted. A leaderboard helps to promote those that are planting the most.

Jack Dangermond of Esri has pledged to make the conference carbon neutral by taking the data on where people have traveled from and calculating the offset. The calculation amounts to 60,000 trees.

2:33 p.m. - Our Towns – A 100,000-Mile Journey into the Heart of America

Speakers: James and Deborah Fallows

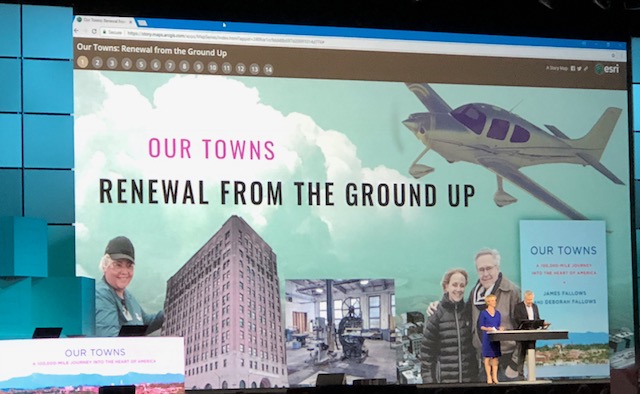
What's next for the planet and many of our societies brings lots of challenges. We are all responsible for the challenges. We want to leave you feeling inspired by what's next when you leave here. They share a story map of Our TOwns: Renewal from the Ground Up.

James and Deborah Fallows

blue-collar to white-collar jobsWe see shifts in blue-collar to white-collar manufacturing jobs, poverty shifts, drug poisoning from opioids. What surprised them is the increase in advanced higher-learning across the U.S. and the role that community colleges are providing new opportunities for those seeking to advance their education or careers. And last slide James shares is how the refugee arrivals are the U.S. is declining. 

Deborah follows James with a description of the changes in Greenville, South Carolina as the city improves education, jobs, partnerships, infrastructure.

She continues to share a story of poverty in Erie, Pennsylvania. In a collaborative partnership, the town of Erie, Pennsylvania is growing, prospering, and increasing in tourism, cultures, businesses, and growth in the city. 

James shares the history of the NRA as not gun activists, but as people who believed in reforming their cities, progressive in change for the better. He leaves with a message from the NRA motto, "We do our part" as a message to all to do our part to change the world.

Written by Matt Ball

Our Towns–A 100,000-Mile Journey into the Heart of America

For the last five years, James and Deborah Fallows have been traveling across America in a single-engine prop plane visiting dozens of towns and interviewing hundreds of civic leaders, entrepreneurs, city workers, educators, students, librarians, immigrants, artists, environmentalists, and craft brewers. The focus of this work is decidedly progressive in that it focuses on those that are forging economic and social progress in their localities.

The project kicked off five years ago on the Esri UC stage, with a discussion of what we could discover about our country. The book often compares divergent cities, such as Greenville, South Carolina versus Burlington, Vermont. The focus is on cities that have momentum.

Geographers that deploy the science of geography with Esri software would call this approach field research— "the systematic observation and collection of otherwise unavailable (primary) data." They set out to document trends and uncover the stories of progress.

They came away with some overriding ideas about what works. Aspects of the educational system, specifically the role of community colleges to help those looking for new opportunities, stood out as a positive force. Refugee arrivals across the country also stood out. Many up-and-coming cities have specialized in accommodating first-generation immigrants.

Greenville, South Carolina surprised them, with its transformation from the textile trade and the resurgence of the downtown. It’s now an economically vibrant city with advanced manufacturing for BMW, Michelin, and GE. The local schools are celebrated with an elementary school focused on engineering. The falls of the Reedy River has been liberated from a highway overpass and have become a favorite gathering place.

Erie, Pennsylvania was a manufacturing hub, and has seen decline including the demise of the GE locomotive plant and the loss of 10,000 jobs. A group of residents rewrote the down-and-out story, and now there are tech startups and startups. The downtown has added a number of amenities, including a number of craft breweries. The population is 10 percent refugees.

We have a similar inspiration and a charge to inspire what’s next.

2:53 p.m. Making a Difference Award

Jack presents the Making-A-Difference award to two teachers who have worked together for the last 8-years in Boyle Heights, California to inspire students to learn GIS, create projects that map out stories of their communities.

Congratulations to two amazing educators, Alice Im and Mariana Ramirez!

Students share the results of their findings at Esri. These students continue to share their results to advocate for their communities, for improvement and change, changing the lives of the students and their community.

Jack shares a video to explain why he is giving the teachers an award today. Students 

Making a difference award winners

AudienceAfter the video, the audience gives a roar of cheers. With tears of joy, both Alice and Mariana share their thanks for the partnership with Jack and Esri and what they desire. 

Jack thanks both for being here and the audience gives them a standing ovation. Jack asks them to return to the stage once more. 

3:05 p.m. Evolving Ourselves - Redesigning the Future of Humanity

Keynote Speaker, Juan Enriquez, Managing Director at Excel Venture Management

The language of the world is changing. It began as hieroglyphics and evolved over centuries as cultures learned to write and create alphabets. Today, our alphabet is continuing to evolve as the world of digital code expands our alphabet and our ability to communicate through 1s and 0s. 

Small changes in code have an impact on the message whether it is digital code or DNA. 

"All life is Code." 

“If life is code, we can read code, copy code, edit code—and it will change the world.” ~ Juan Enriquez

All life is Code

The code of Life Sciences is what is pushing mapping, pushing AI, pushing high-end mapping. Flipping the logic of Charles Darwin's theory of evolution driven by humans becomes an un-natural selection. We are deciding what lives and dies, what is non-random mutation. 

"We are entering an era of intelligent design."

As humans, we can make programmable life forms, can make almost anything. We are beginning to integrate technology with creating life. We are getting to a point in time where we can take the code in each of ourselves and make copies of ourselves. We already do this when our cells make new teeth, grow bones, new skin. And as we continue to learn how to make code, we can make anything, except for the brain. Dr. Mary Lou Jepson - Brain Mapping

The cutting edge of map-making will be when we can map the human brain. Dr. Mary Lou Jepson, inspired by her own brain tumor, decided to learn just how to map the brain and with the support and vision of Openwater, she is currently in the process of building a non-invasive lab size prototype for mapping the brain. 

3:35 p.m. Closing

Jack thanks the audience and invites everyone to the Map Gallery.

more
5 7 4,356
CandaceLoya
Occasional Contributor III

And we're back with the Customer Advocacy team sharing their comments below! If you missed the morning session, you could read the highlights Live from the 2018 User Conference Plenary: Morning Session‌.

10:55 a.m. - Act II – Opening Video 

Bernie Szukalski and Shannon Kalisky introduce Jennifer Bell for ArcGIS Online.

11:01 a.m. - ArcGIS Online

Speaker: Jennifer Bell


Jennifer begins with a demonstration of the power plants across the globe and uses clustering to show the different types of clustering between hydro plants and solar power plants in the United States and hydro, wind, and coal plants in Asia.
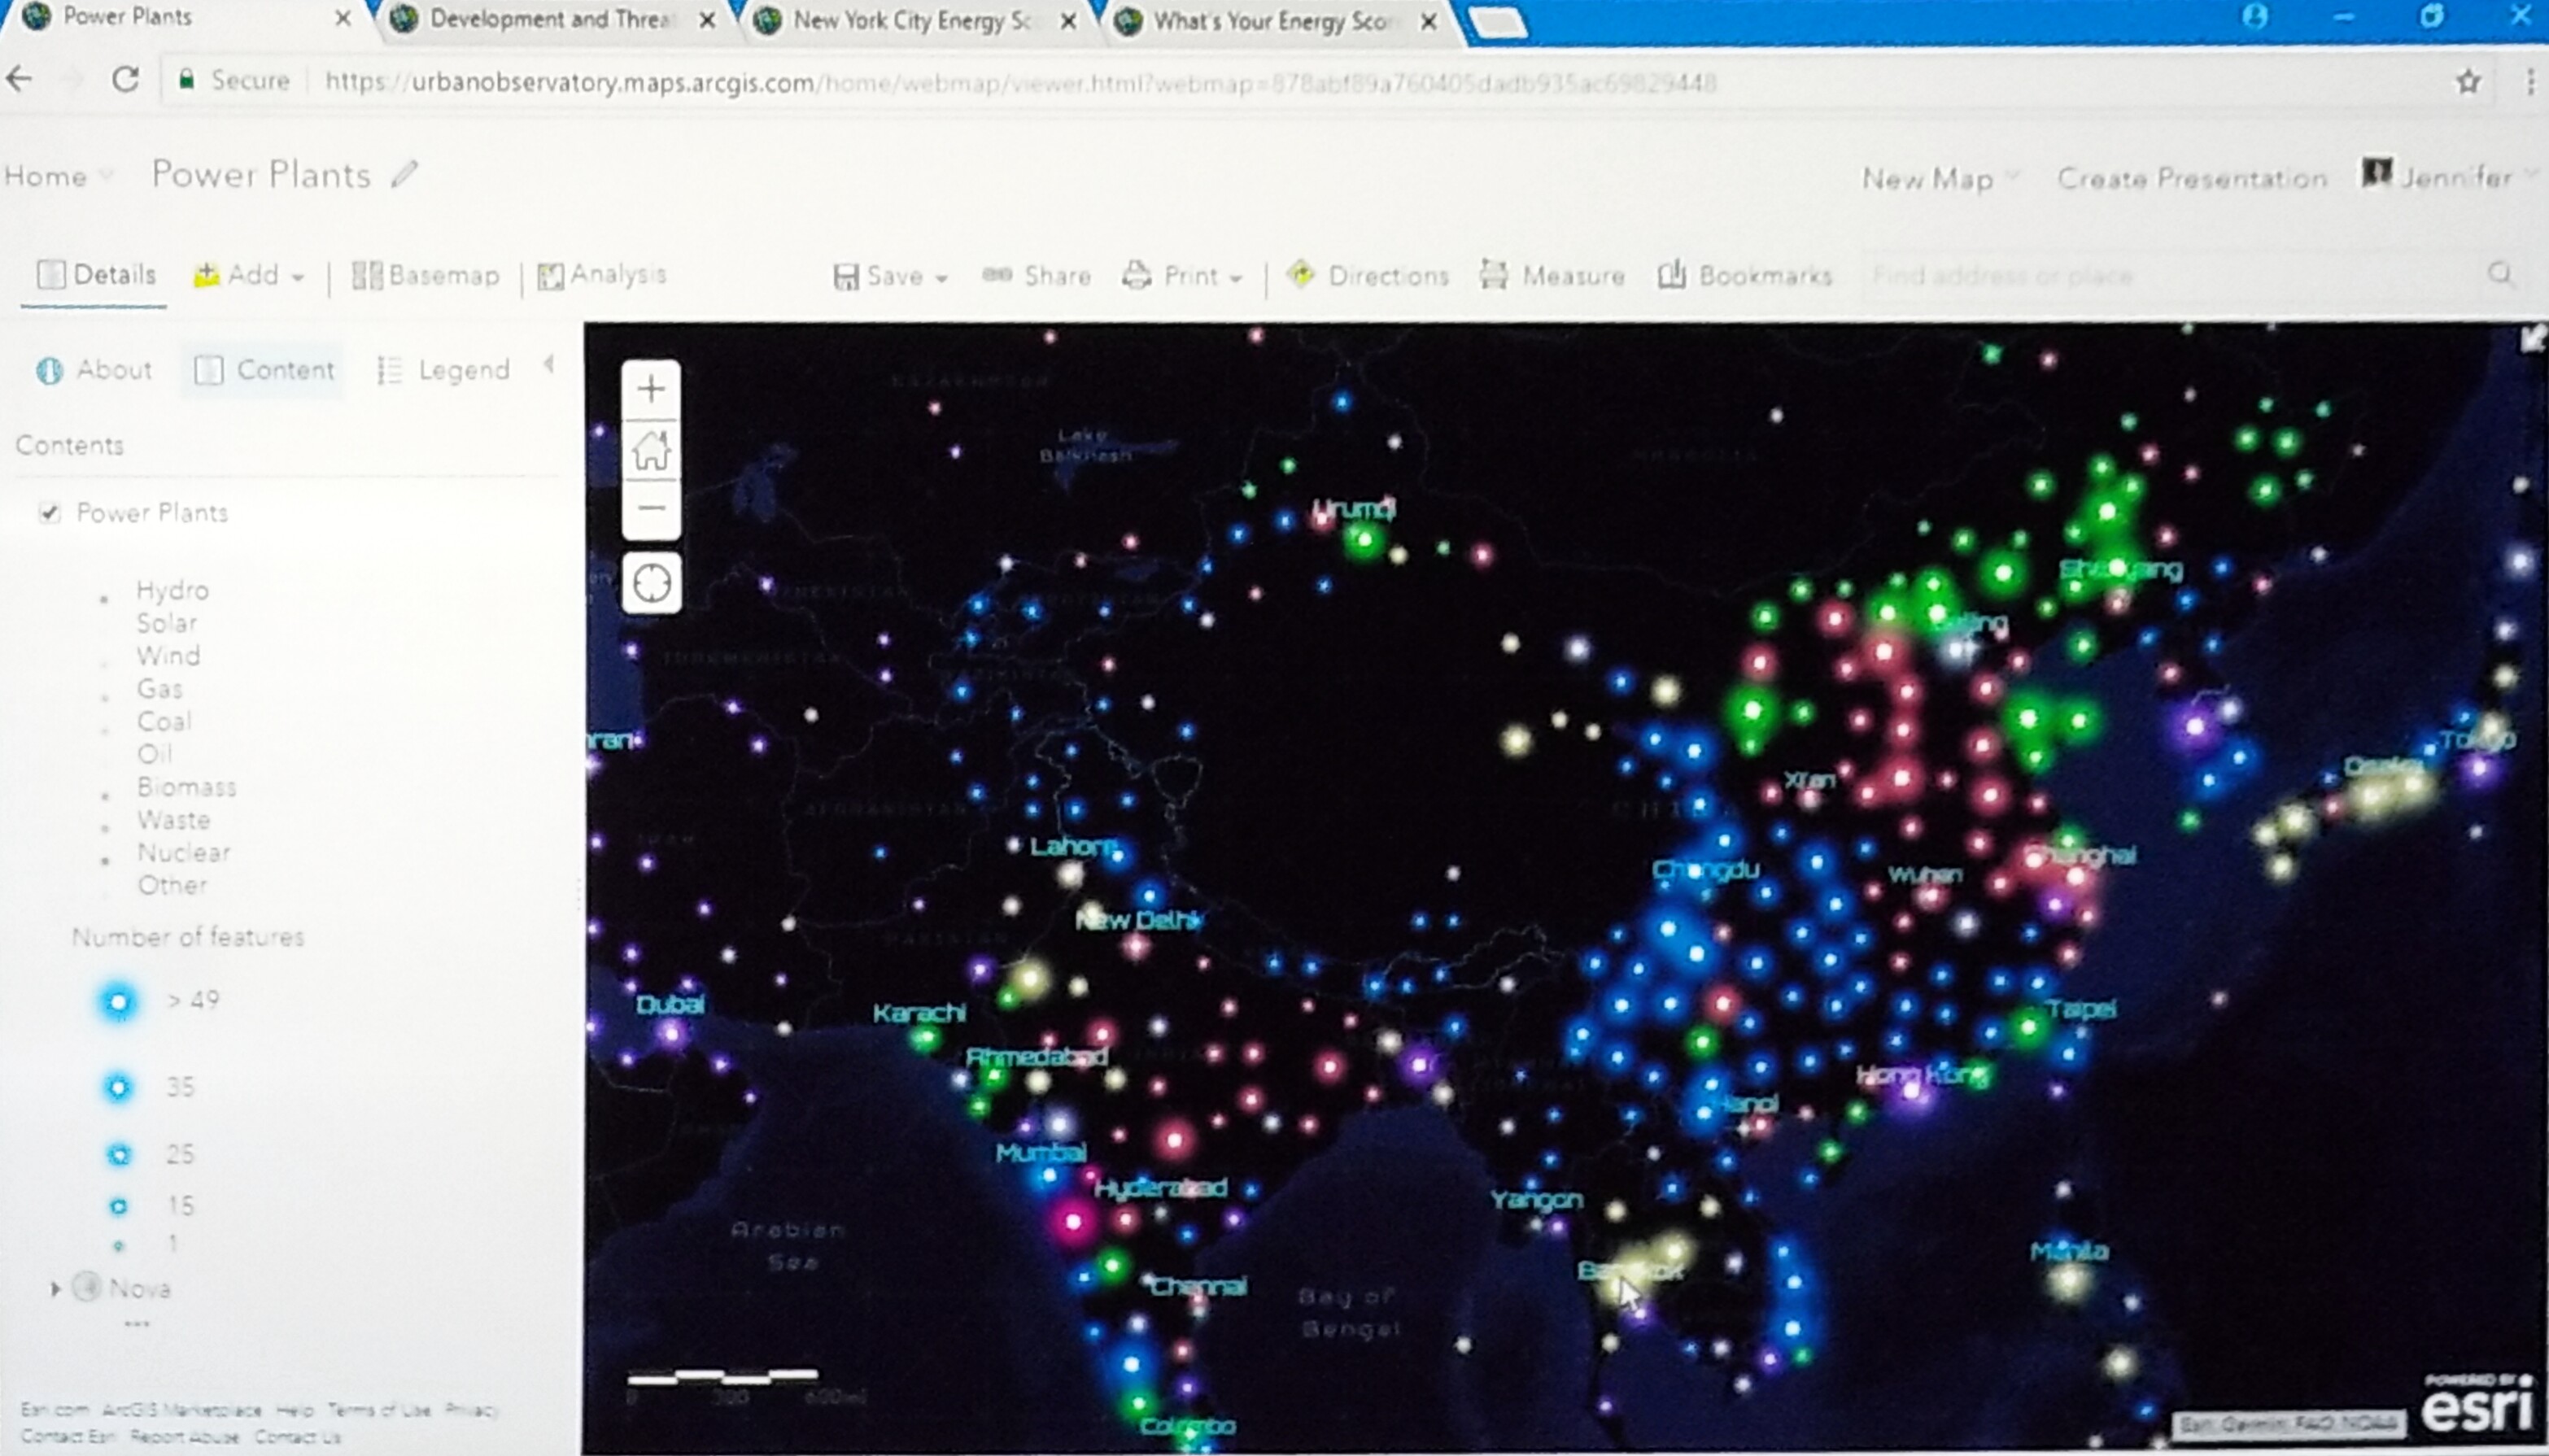
Power Plants map

Using the ArcGIS Online tools and features, she continues the demo moving to a map of the Human Footprint Index to display more developed areas in comparison to less developed areas.


Smart Mapping provides numerous multi-variate drawing styles
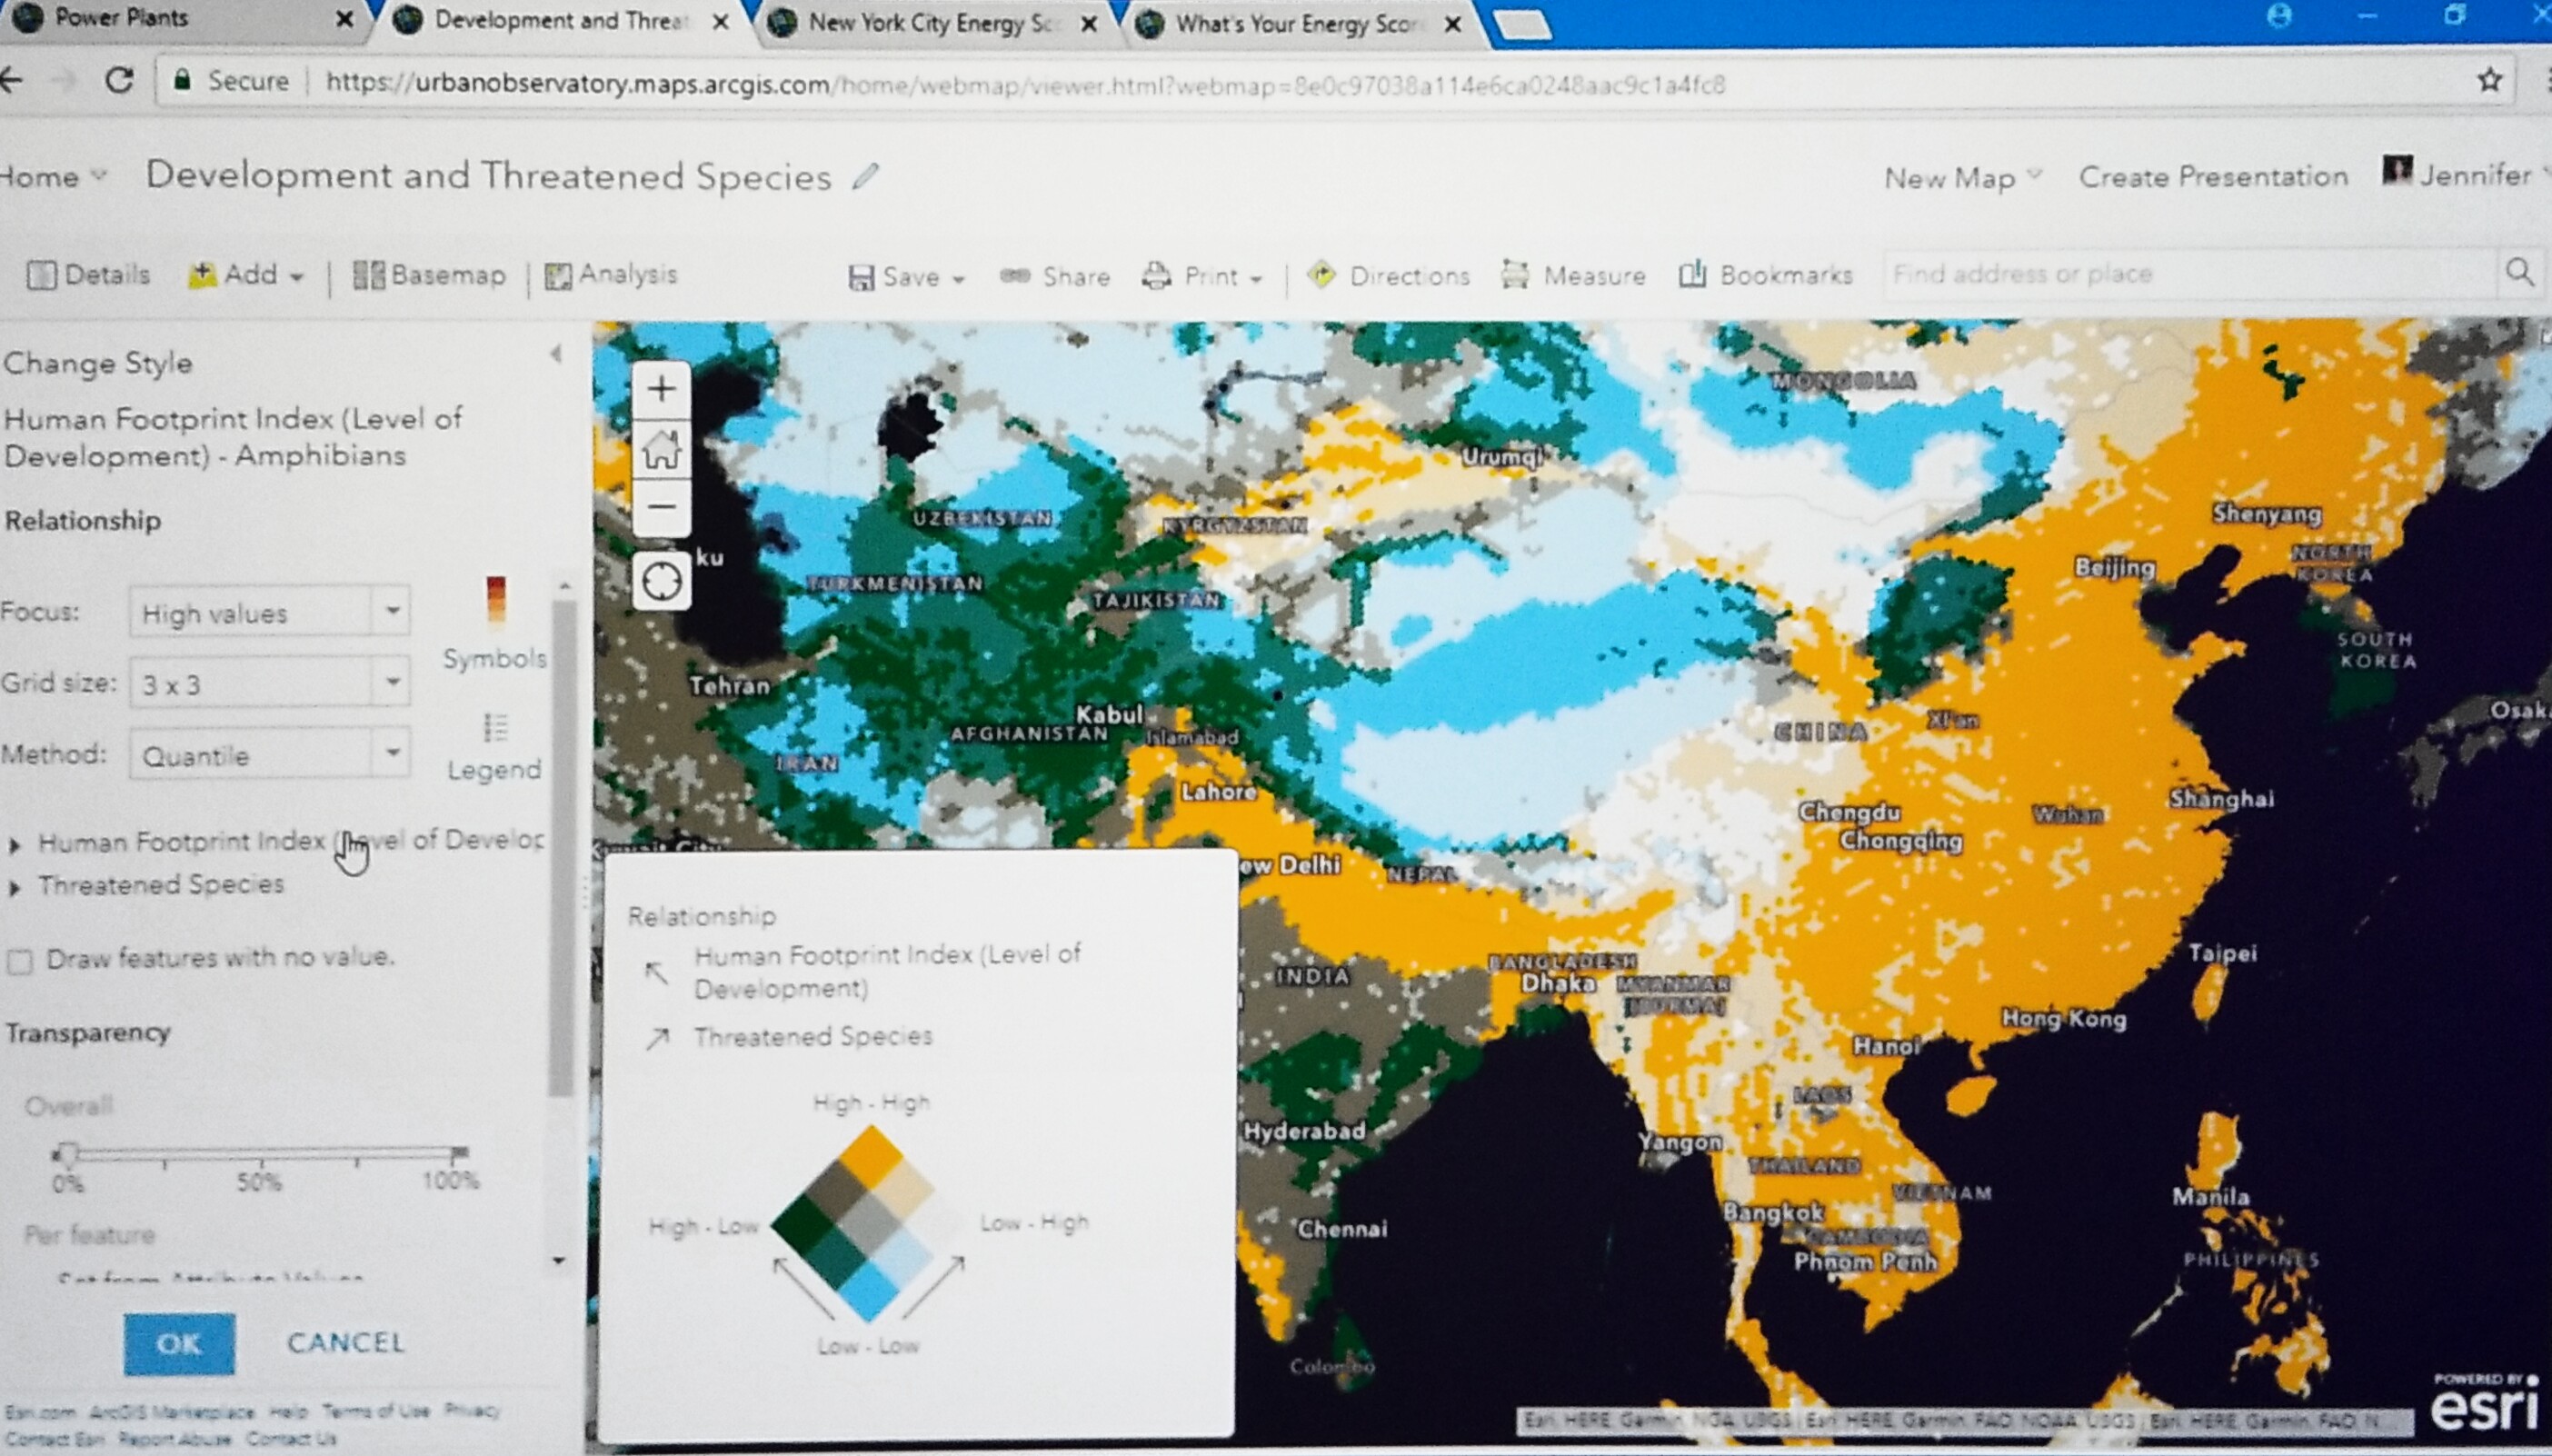
 

Jennifer Bell - Smart Mapping relationship drawingUsing the Relationship drawing style, she demonstrates how this style evaluates two attributes to help explore relationships between attributes, in this case, comparing the level of development to the number of threatened species and showing where both values are high and low for human development that threatens other species of life.
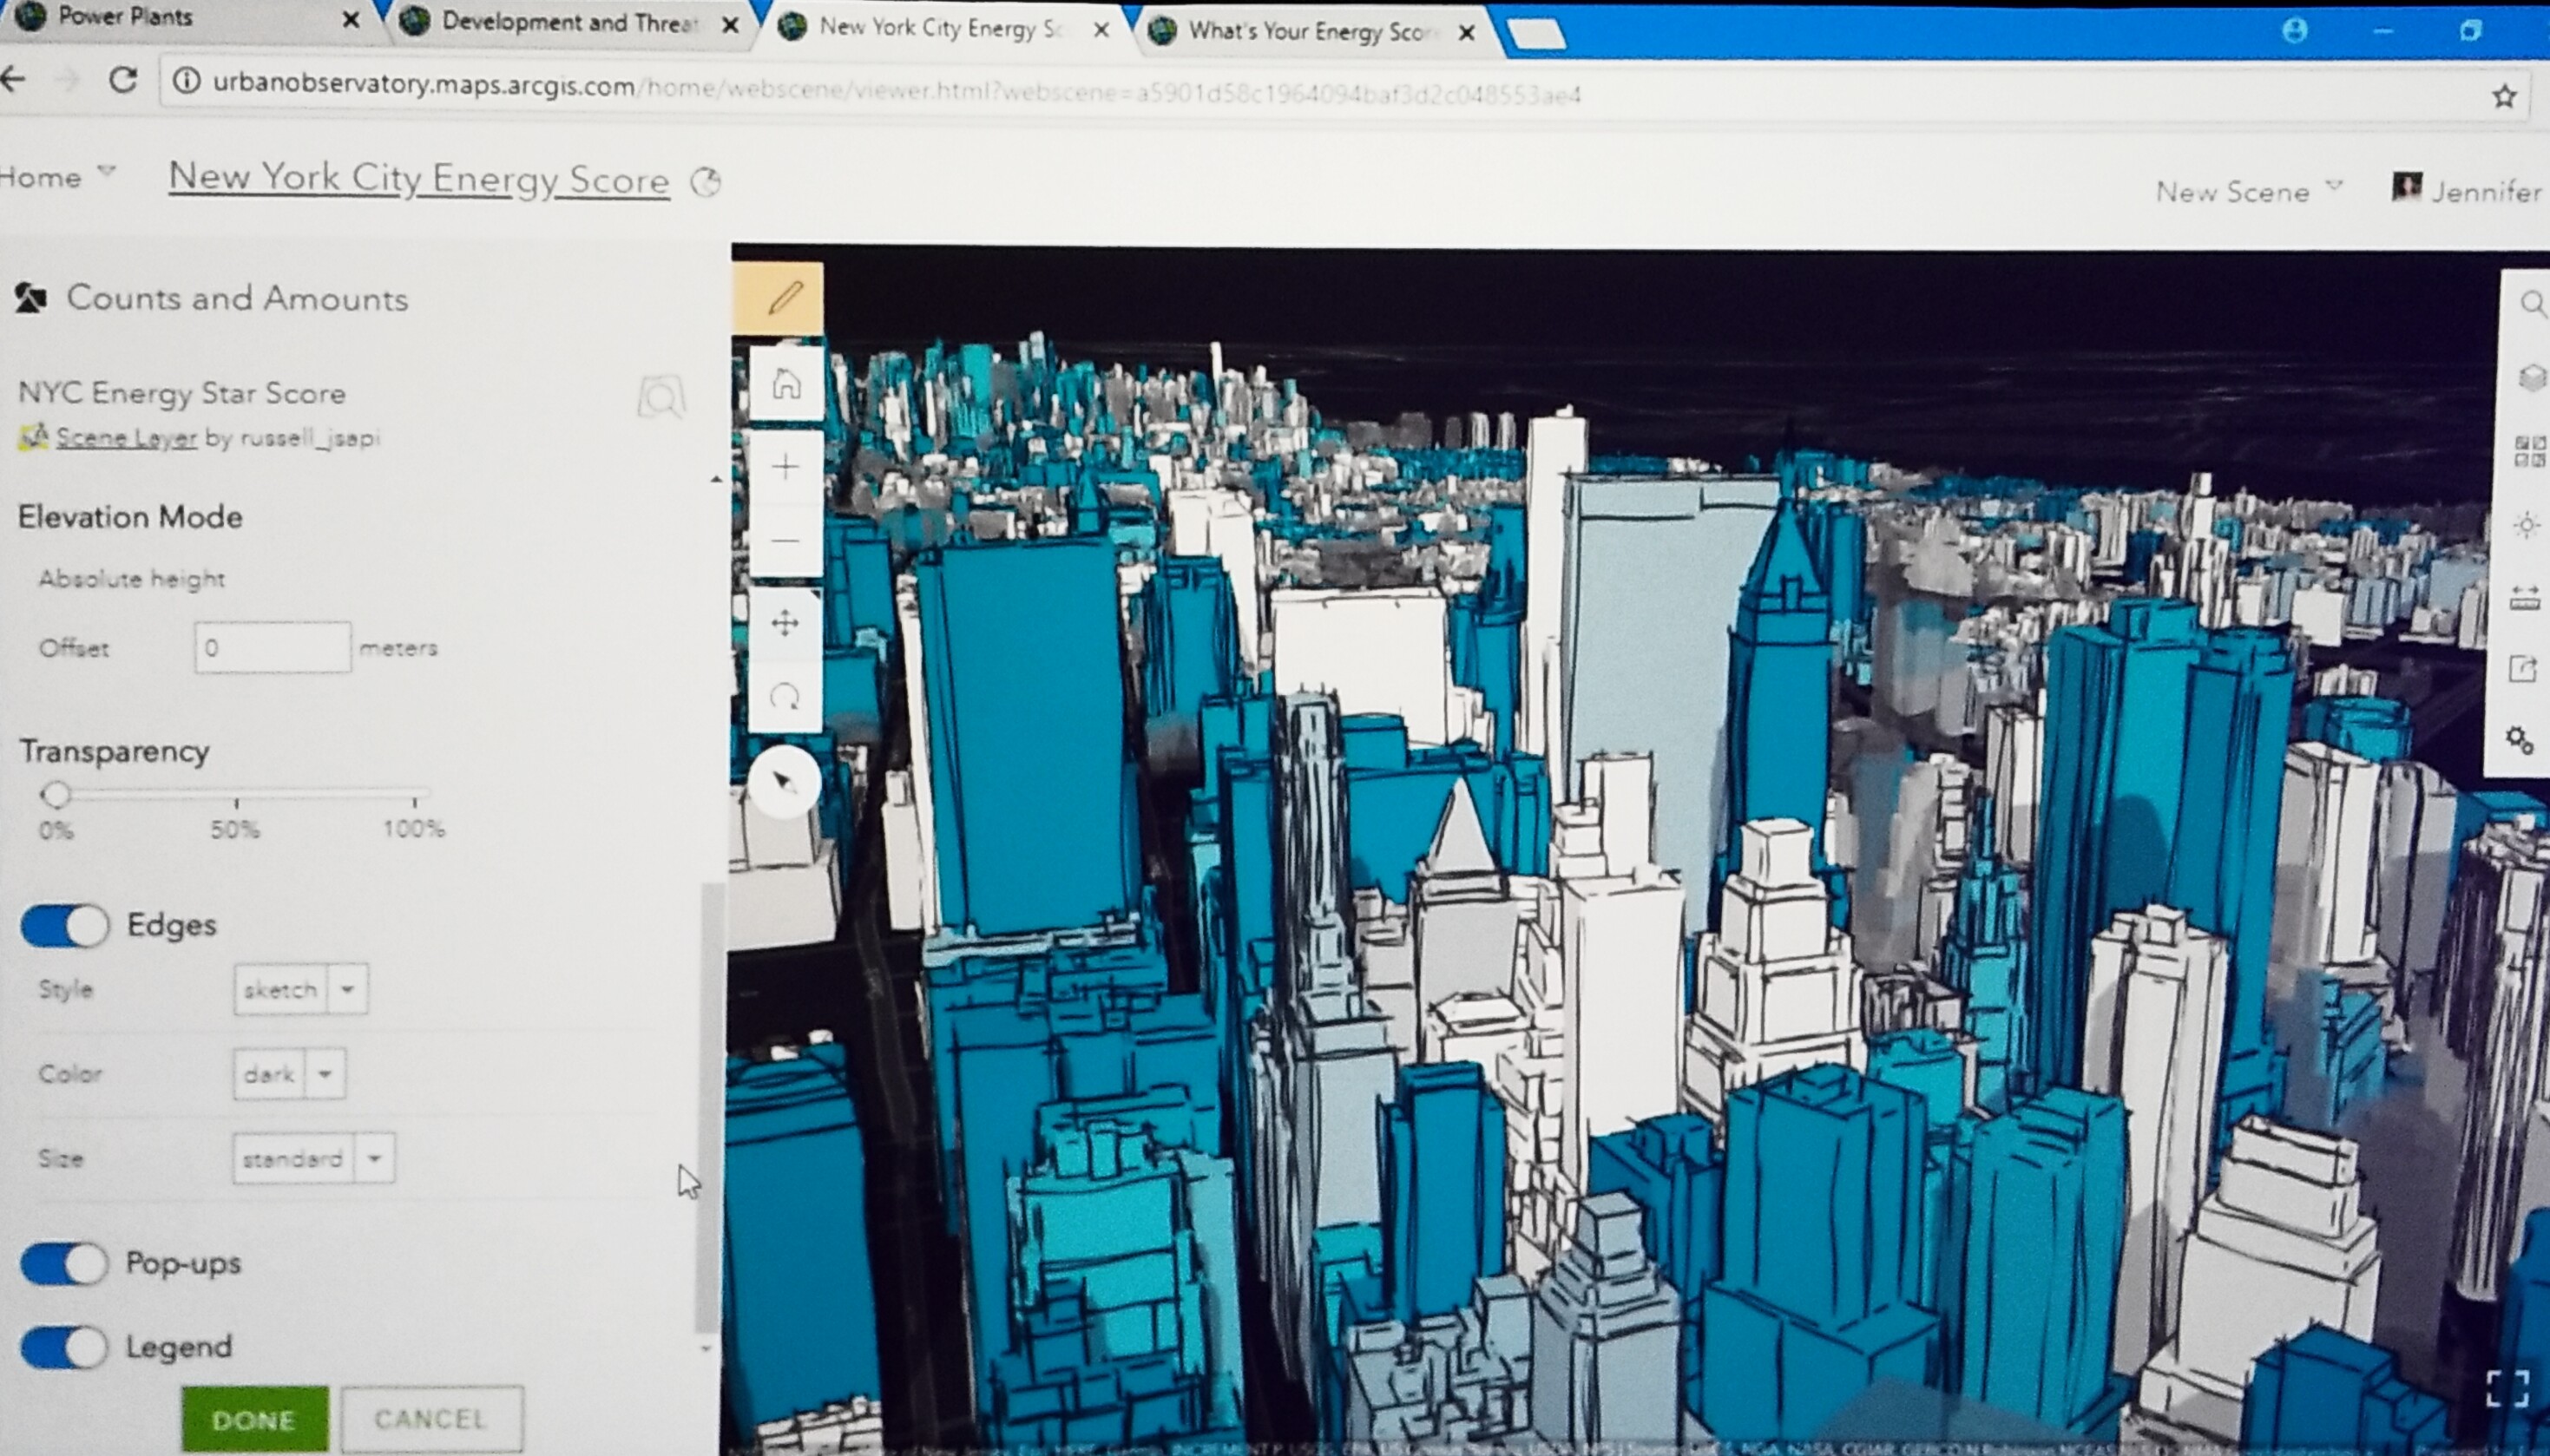
 

Smart Mapping in 3DShe moves on to tell the story using the Edges feature in ArcGIS Online for 3D Smart Mapping of the New York City Energy Score. Here she shows the grade that every building receives that represents how energy efficient it is.

11:12 a.m. - Enterprise GIS – Inspiring a New Era of Problem Solvers with Location Intelligence

Company: Cobb County Government

Speakers:  Sharon Stanley, Felicia Alingu, Lynn Biggs, Jennifer Lana, and Lt. J.D. Lorens - Cobb P.D.


Bern introduces Sharon Stanley and her team of innovators. Sharon Stanley opens with explaining the ways Cobb County uses GIS. Sharon provides a demonstration of a map created by an Intern. The intern created a map of tour routes beginning with Distillery Tour. This map got executives excited and more engaged in GIS mapping. This started a dialogue between executives when they saw how the capabilities of mapping tourism sites could benefit Cobb County.
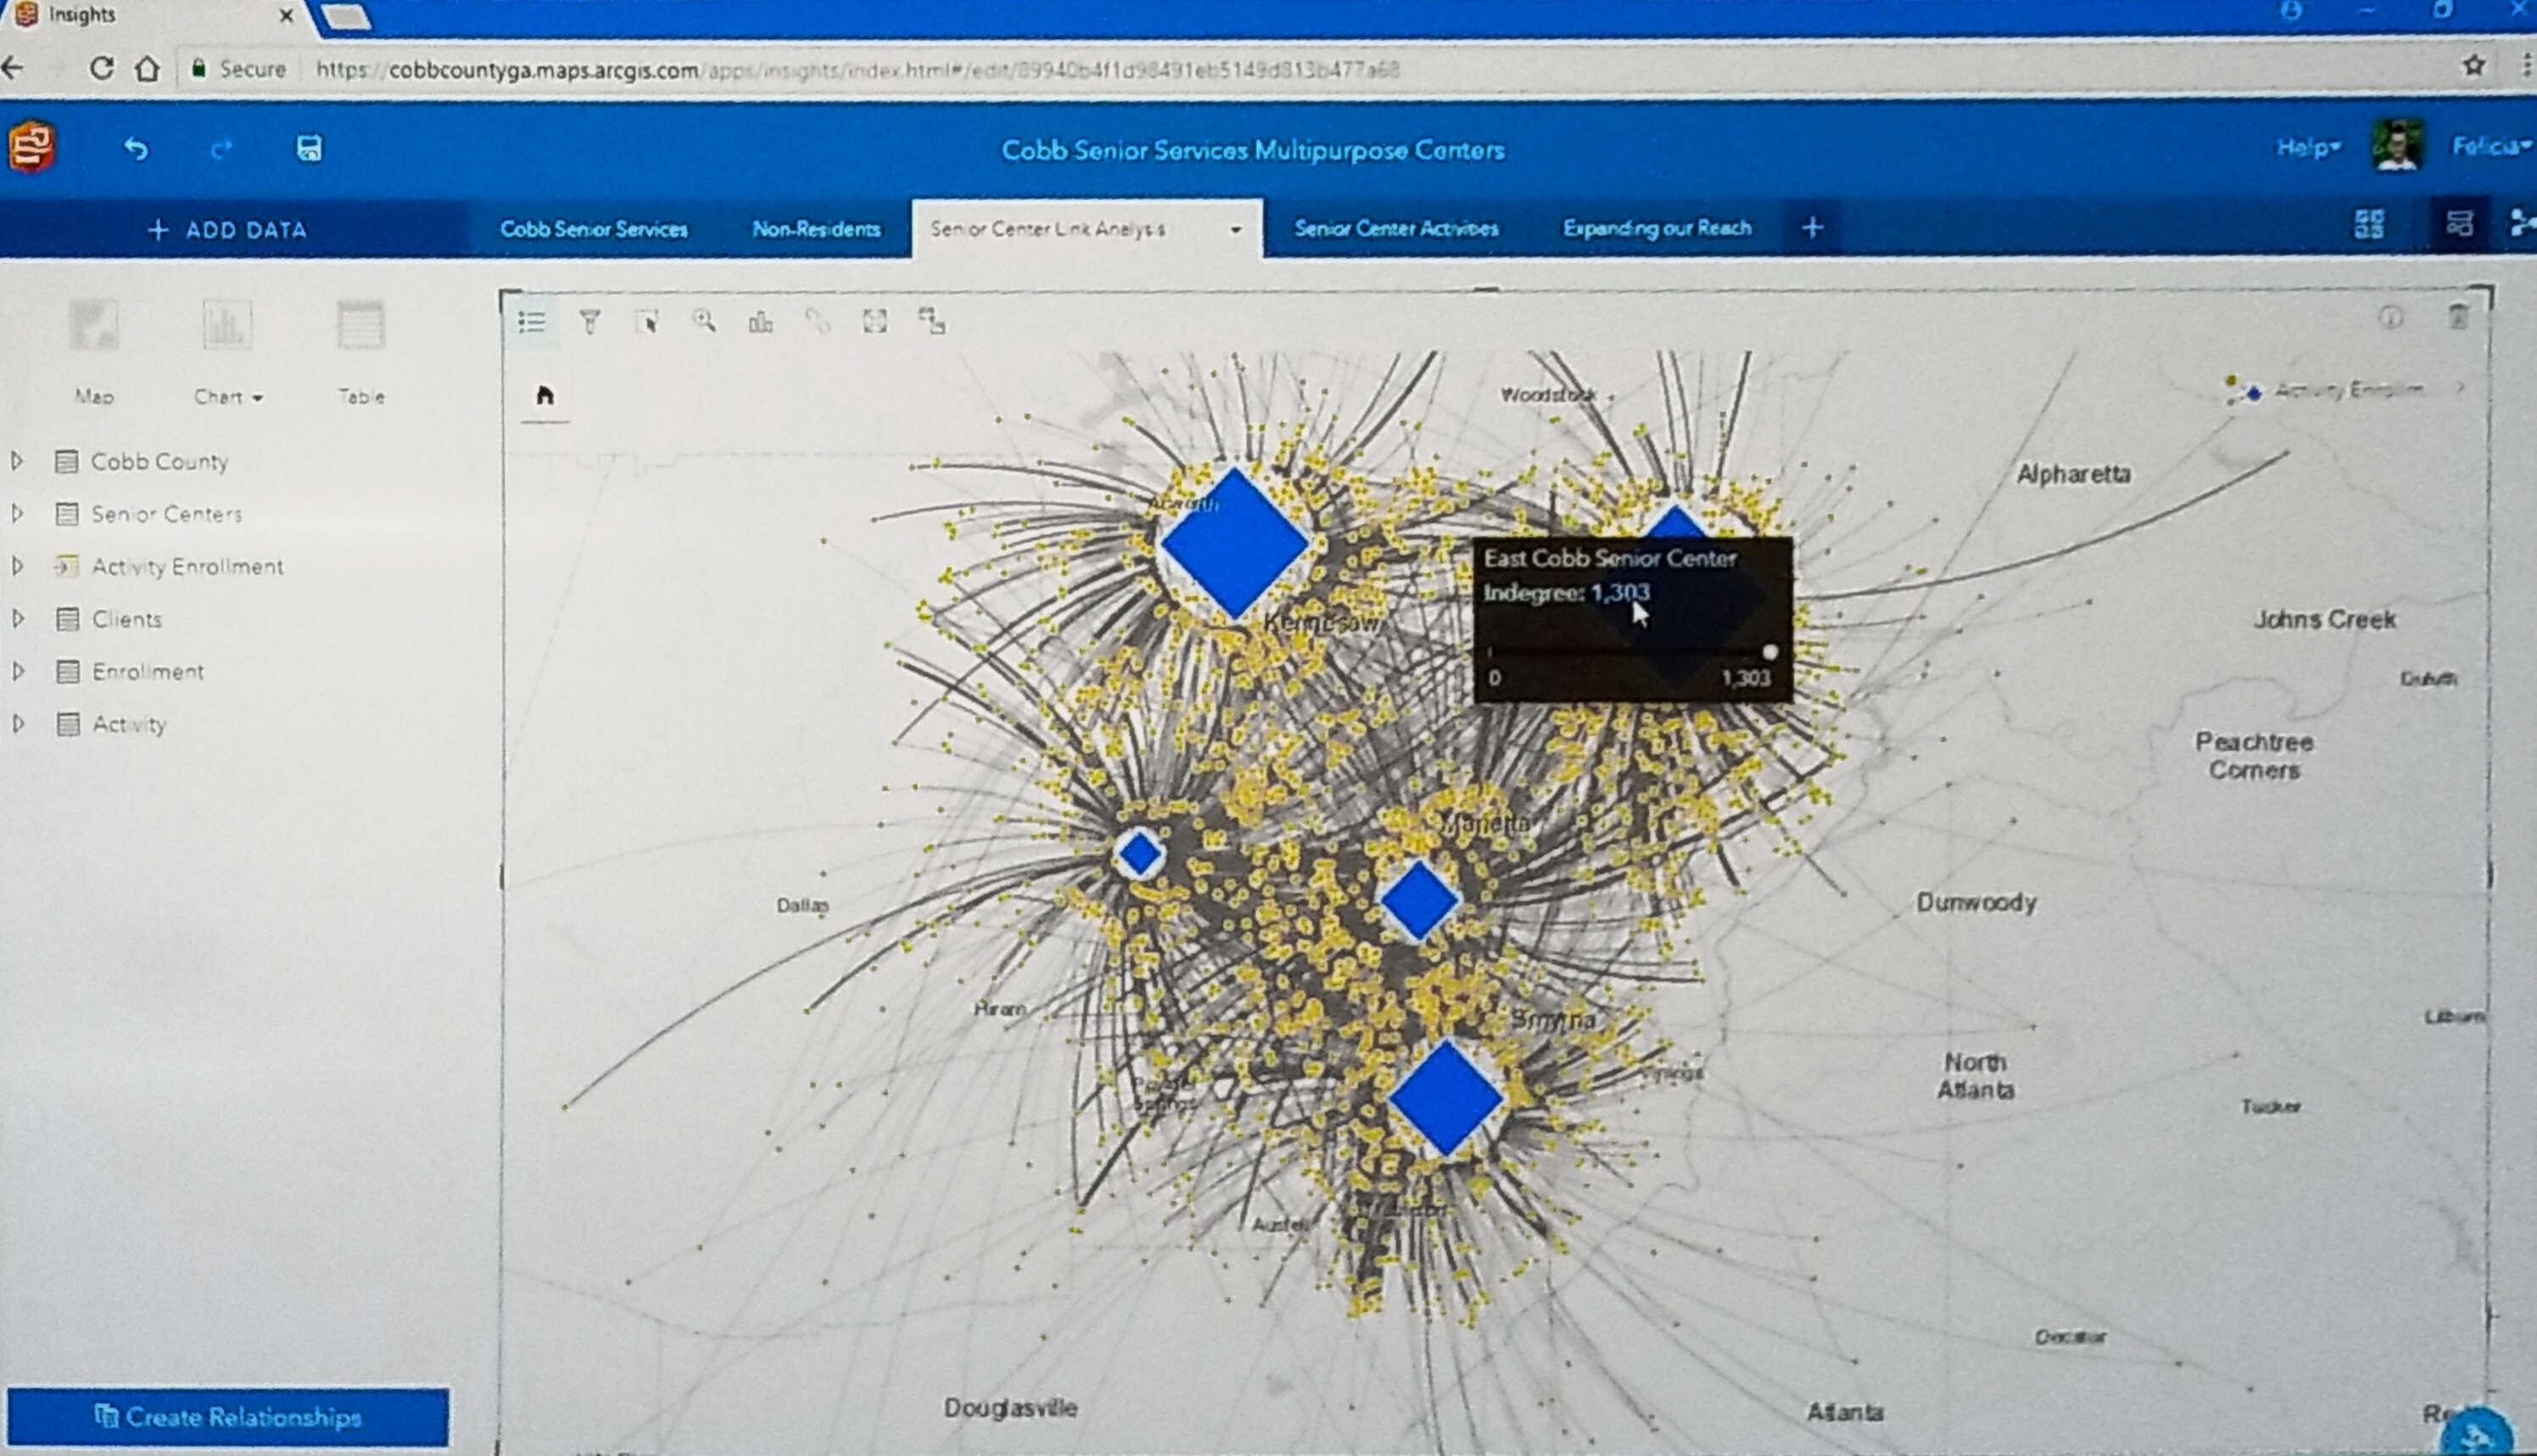
Cobb County Senior Centers ActivityFelicia Alingu presents a demonstration of how she uses ArcGIS Online to create maps to evaluate Cobb Senior Service Multipurpose Centers including data that tells which centers are visited the most, what programs they offer and which programs are the most active. The most popular engagement activities include Bingo and an event about Patsy Cline. 

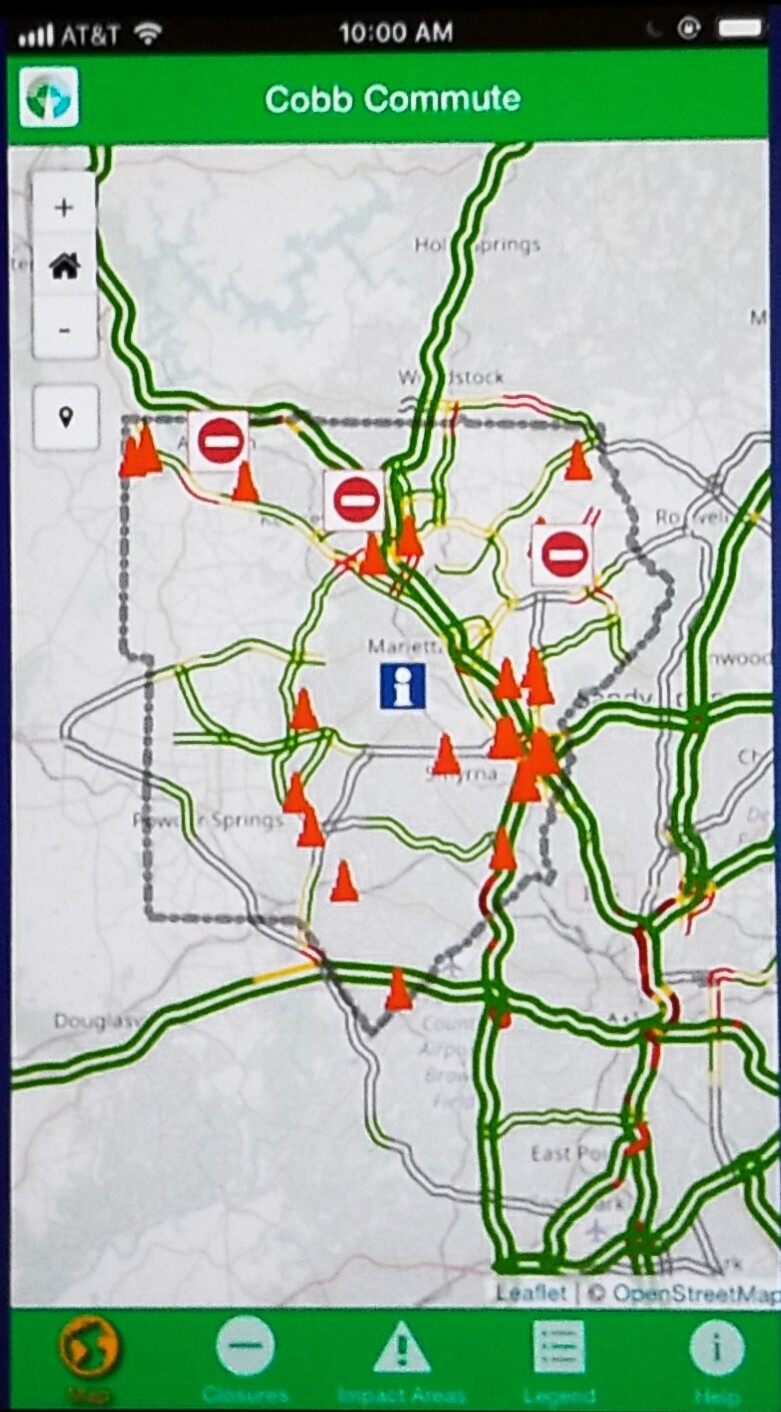
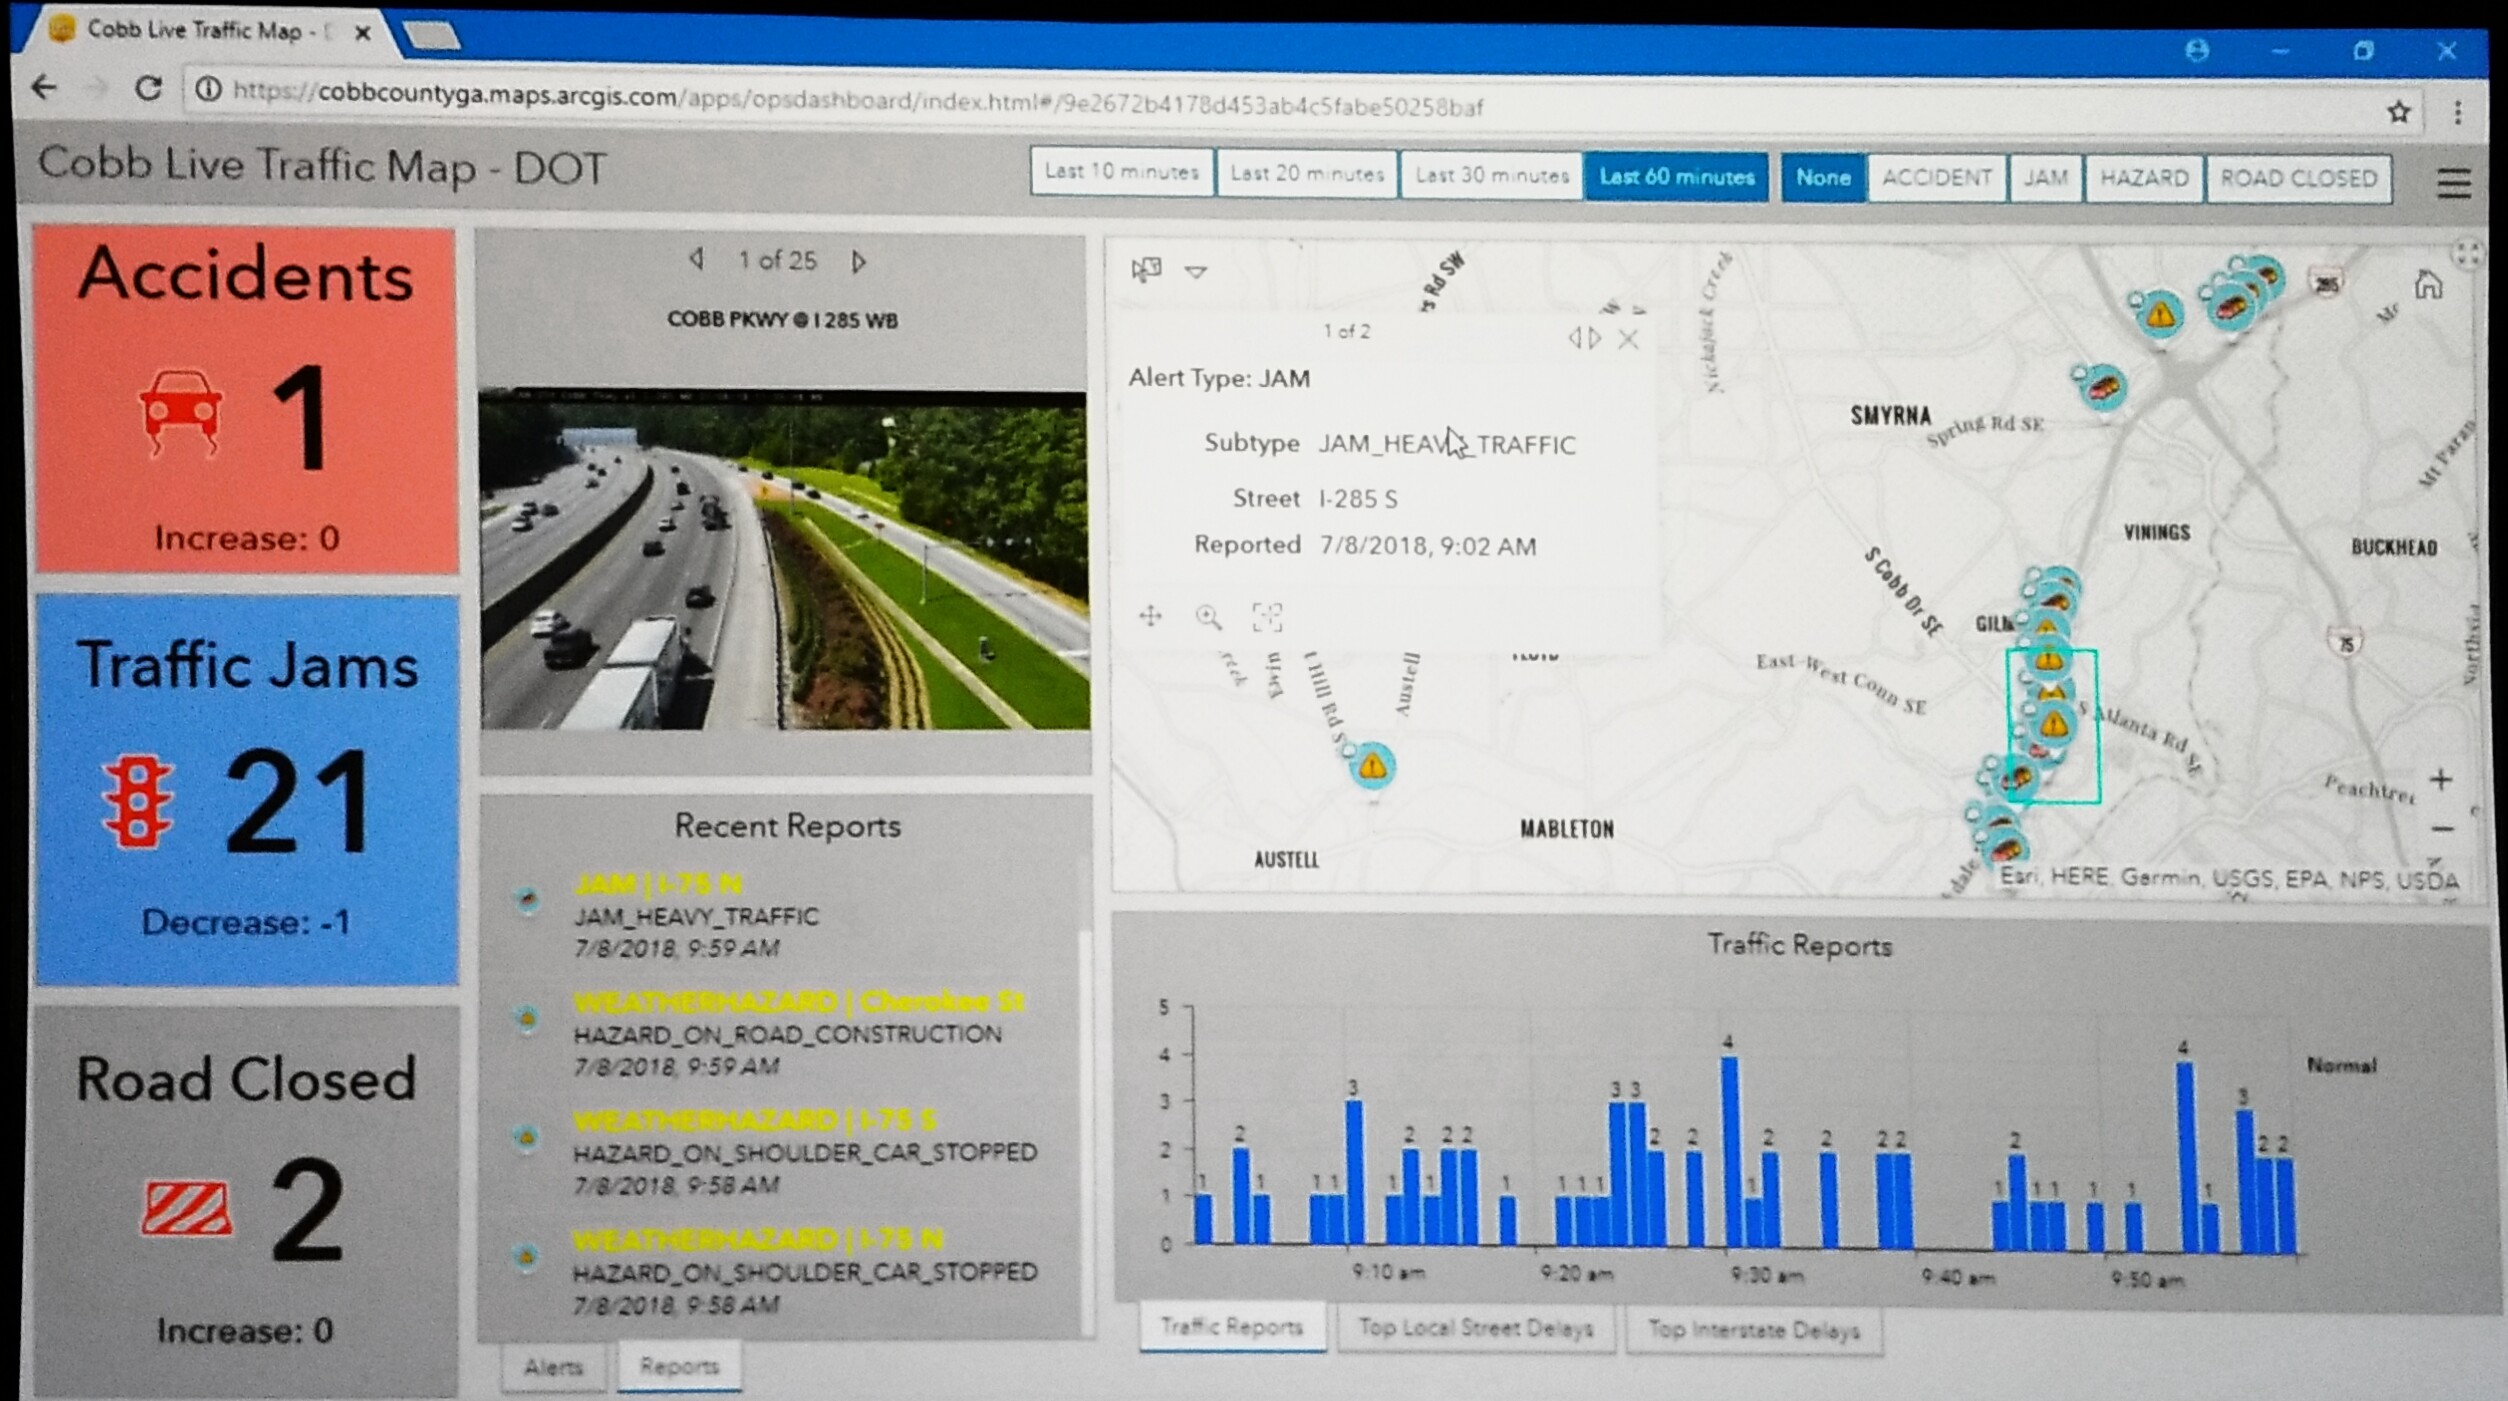
Lynn Biggs explains how Cobb County’s Department of Transportation uses GIS to develop an application for the Cobb citizens on the move, providing accurate, up-to-the-minute transportation updates. They demonstrate the use of this app by checking on the traffic. They can see traffic camera shots, check the traffic speed, and deter drivers from areas under construction to mitigate traffic congestion.

They developed a Waze Connected Citizen Partnership a year ago allowing them to share authoritative information about road status closure due to construction road closures.

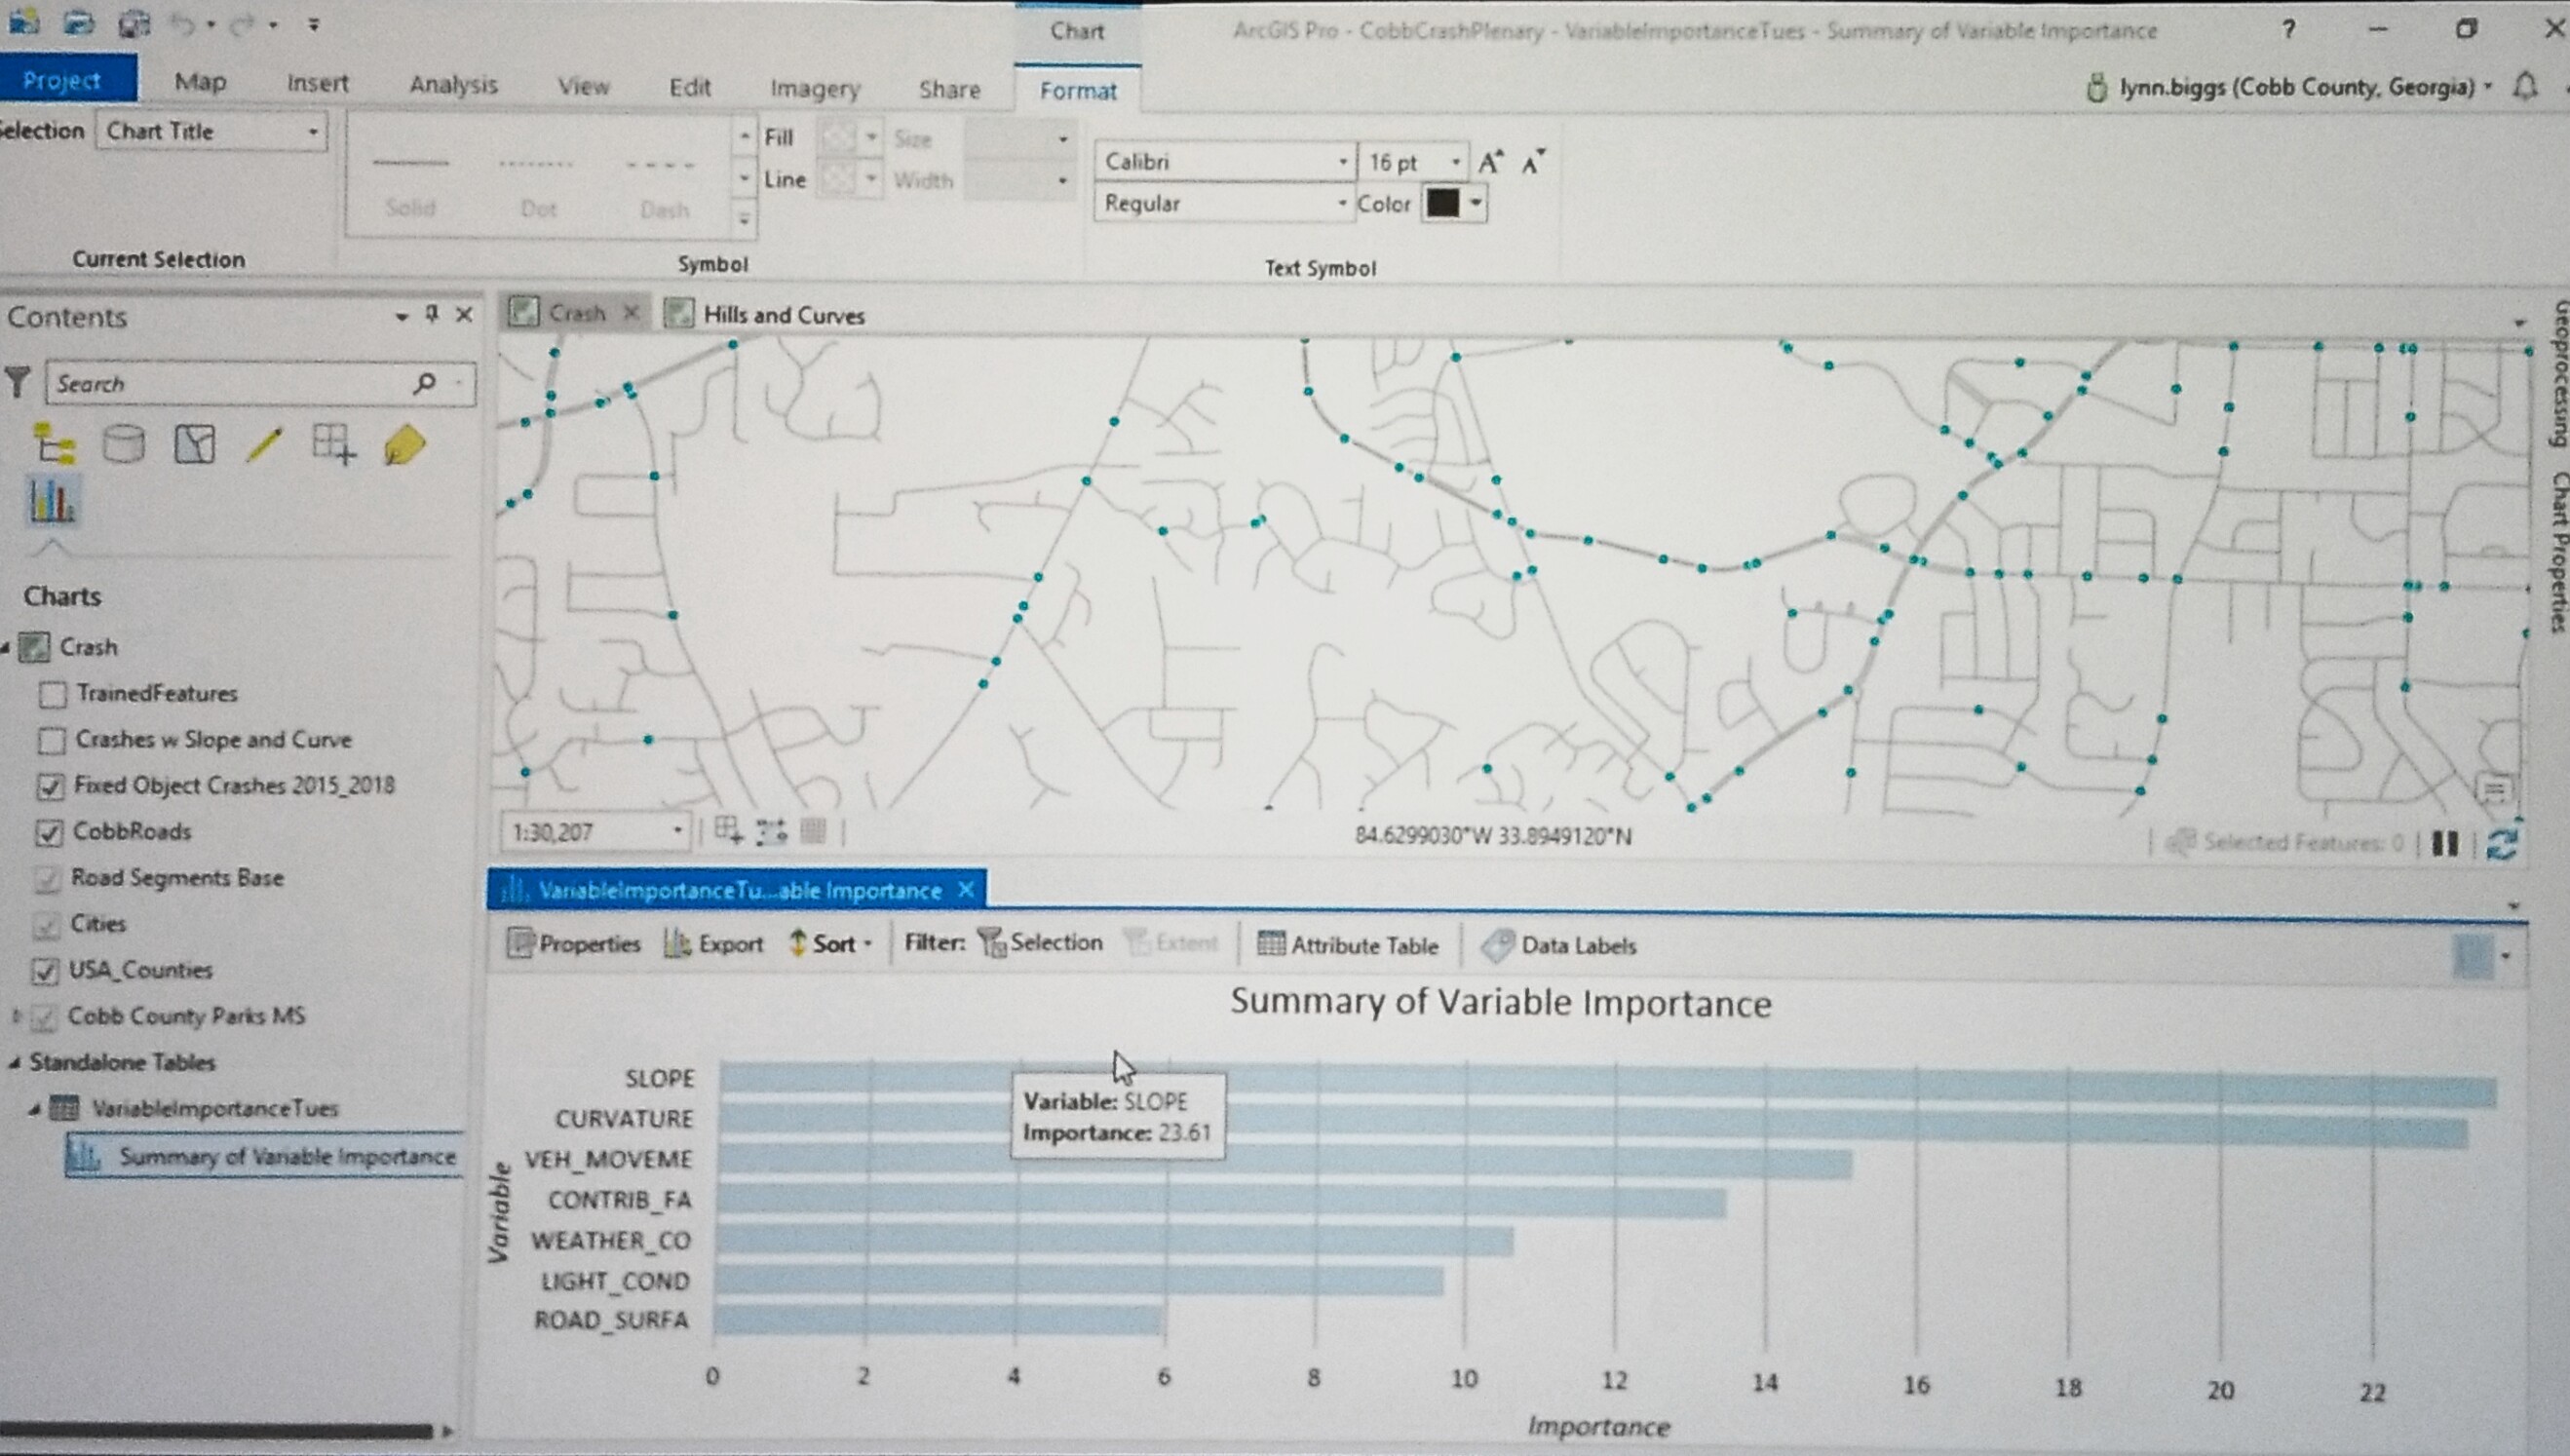
Using ArcGIS Pro Forest classification and regression tools, Cobb DOT could collect crash data and analyze a hypothesis that specific types of crashes were more likely to occur on roads that are curvy, hilly or both.


The table created shows their hypothesis was correct. Slopes and curves are the top two contributing factors in fixed object crash with utility poles, trees, guardrails, etc.

Cobb Commute AppIn the Office Traffic Report
Cobb Commute AppCobb Commute Traffic

Austell Road and Windy Hill to the County Services Parkway.
Cobb Accident Reports Variables

Jennifer Lana, Cobb GIS manager, demonstrates how they analyzed their crash theory for fixed object crashes.
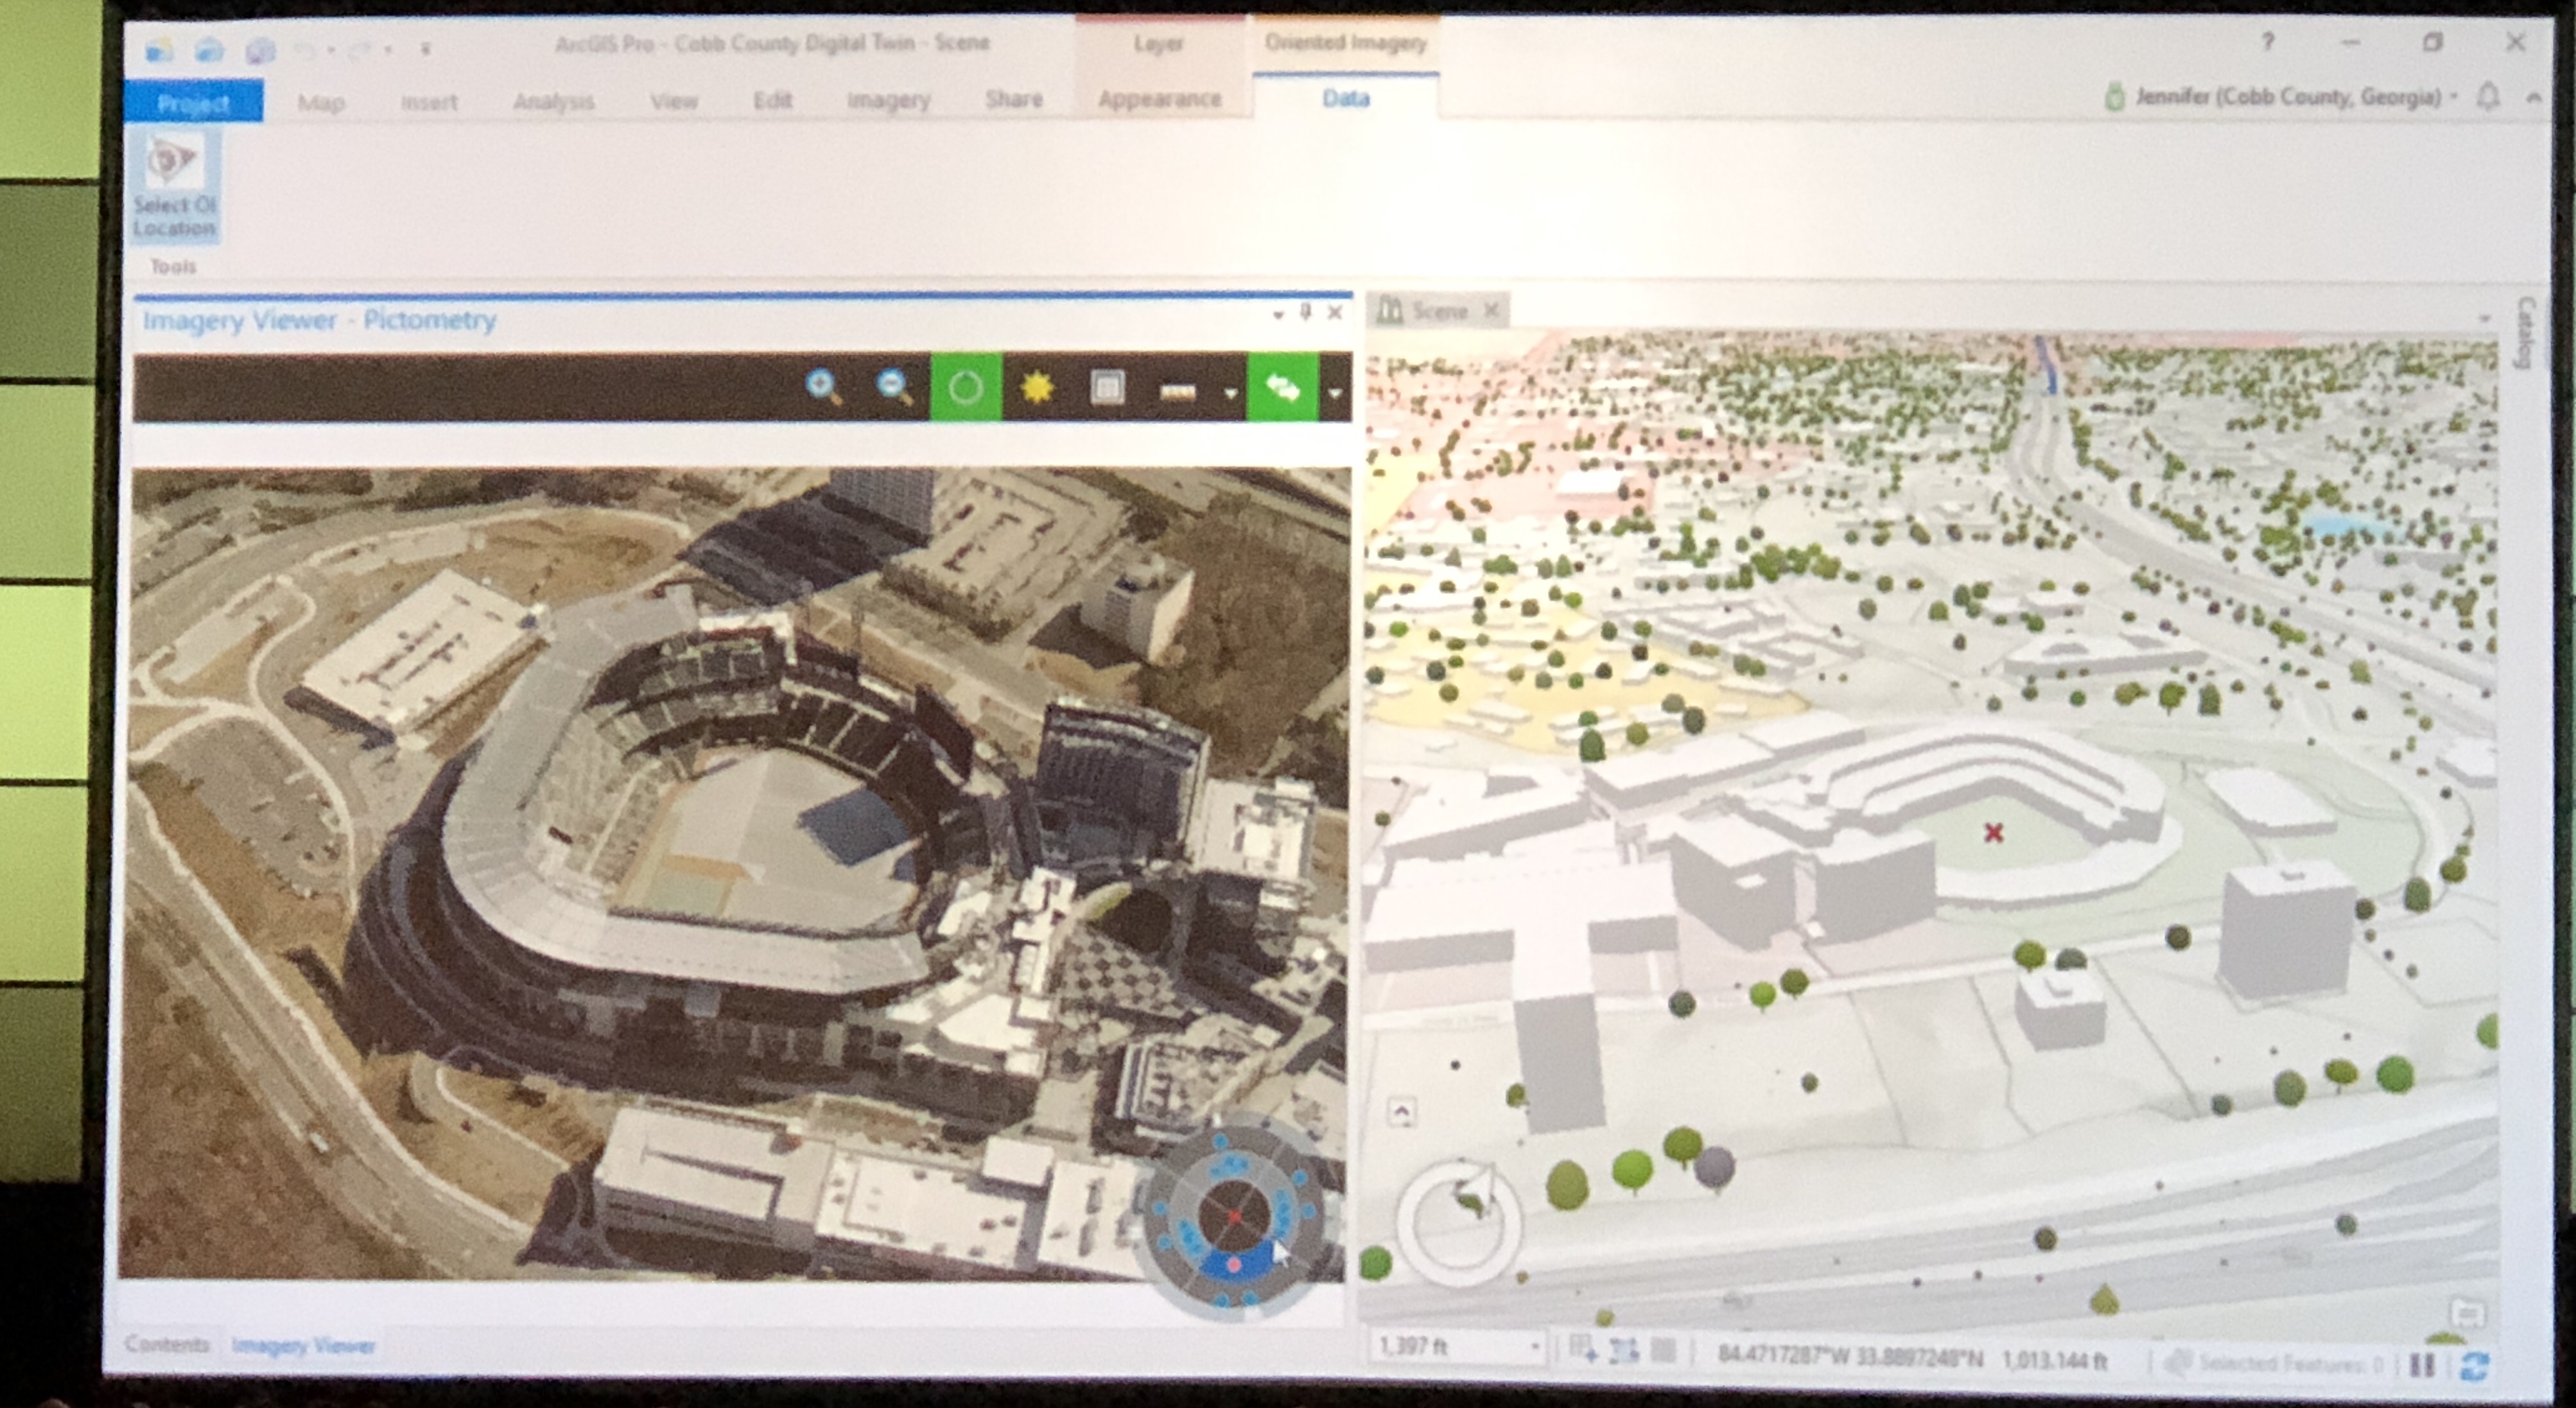
 Cobb Sun Trust Stadium Digital Twins

Lt. J.D. Lorens asked the GIS team to help with a problem they were having with traffic at a major interstate for pedestrian crossing. He was able to use the dashboard and GIS mapping to analyze traffic patterns before and after games. He was then able to teach his officers how to predict and plan for pedestrian and vehicle traffic when there are games at the stadium. 
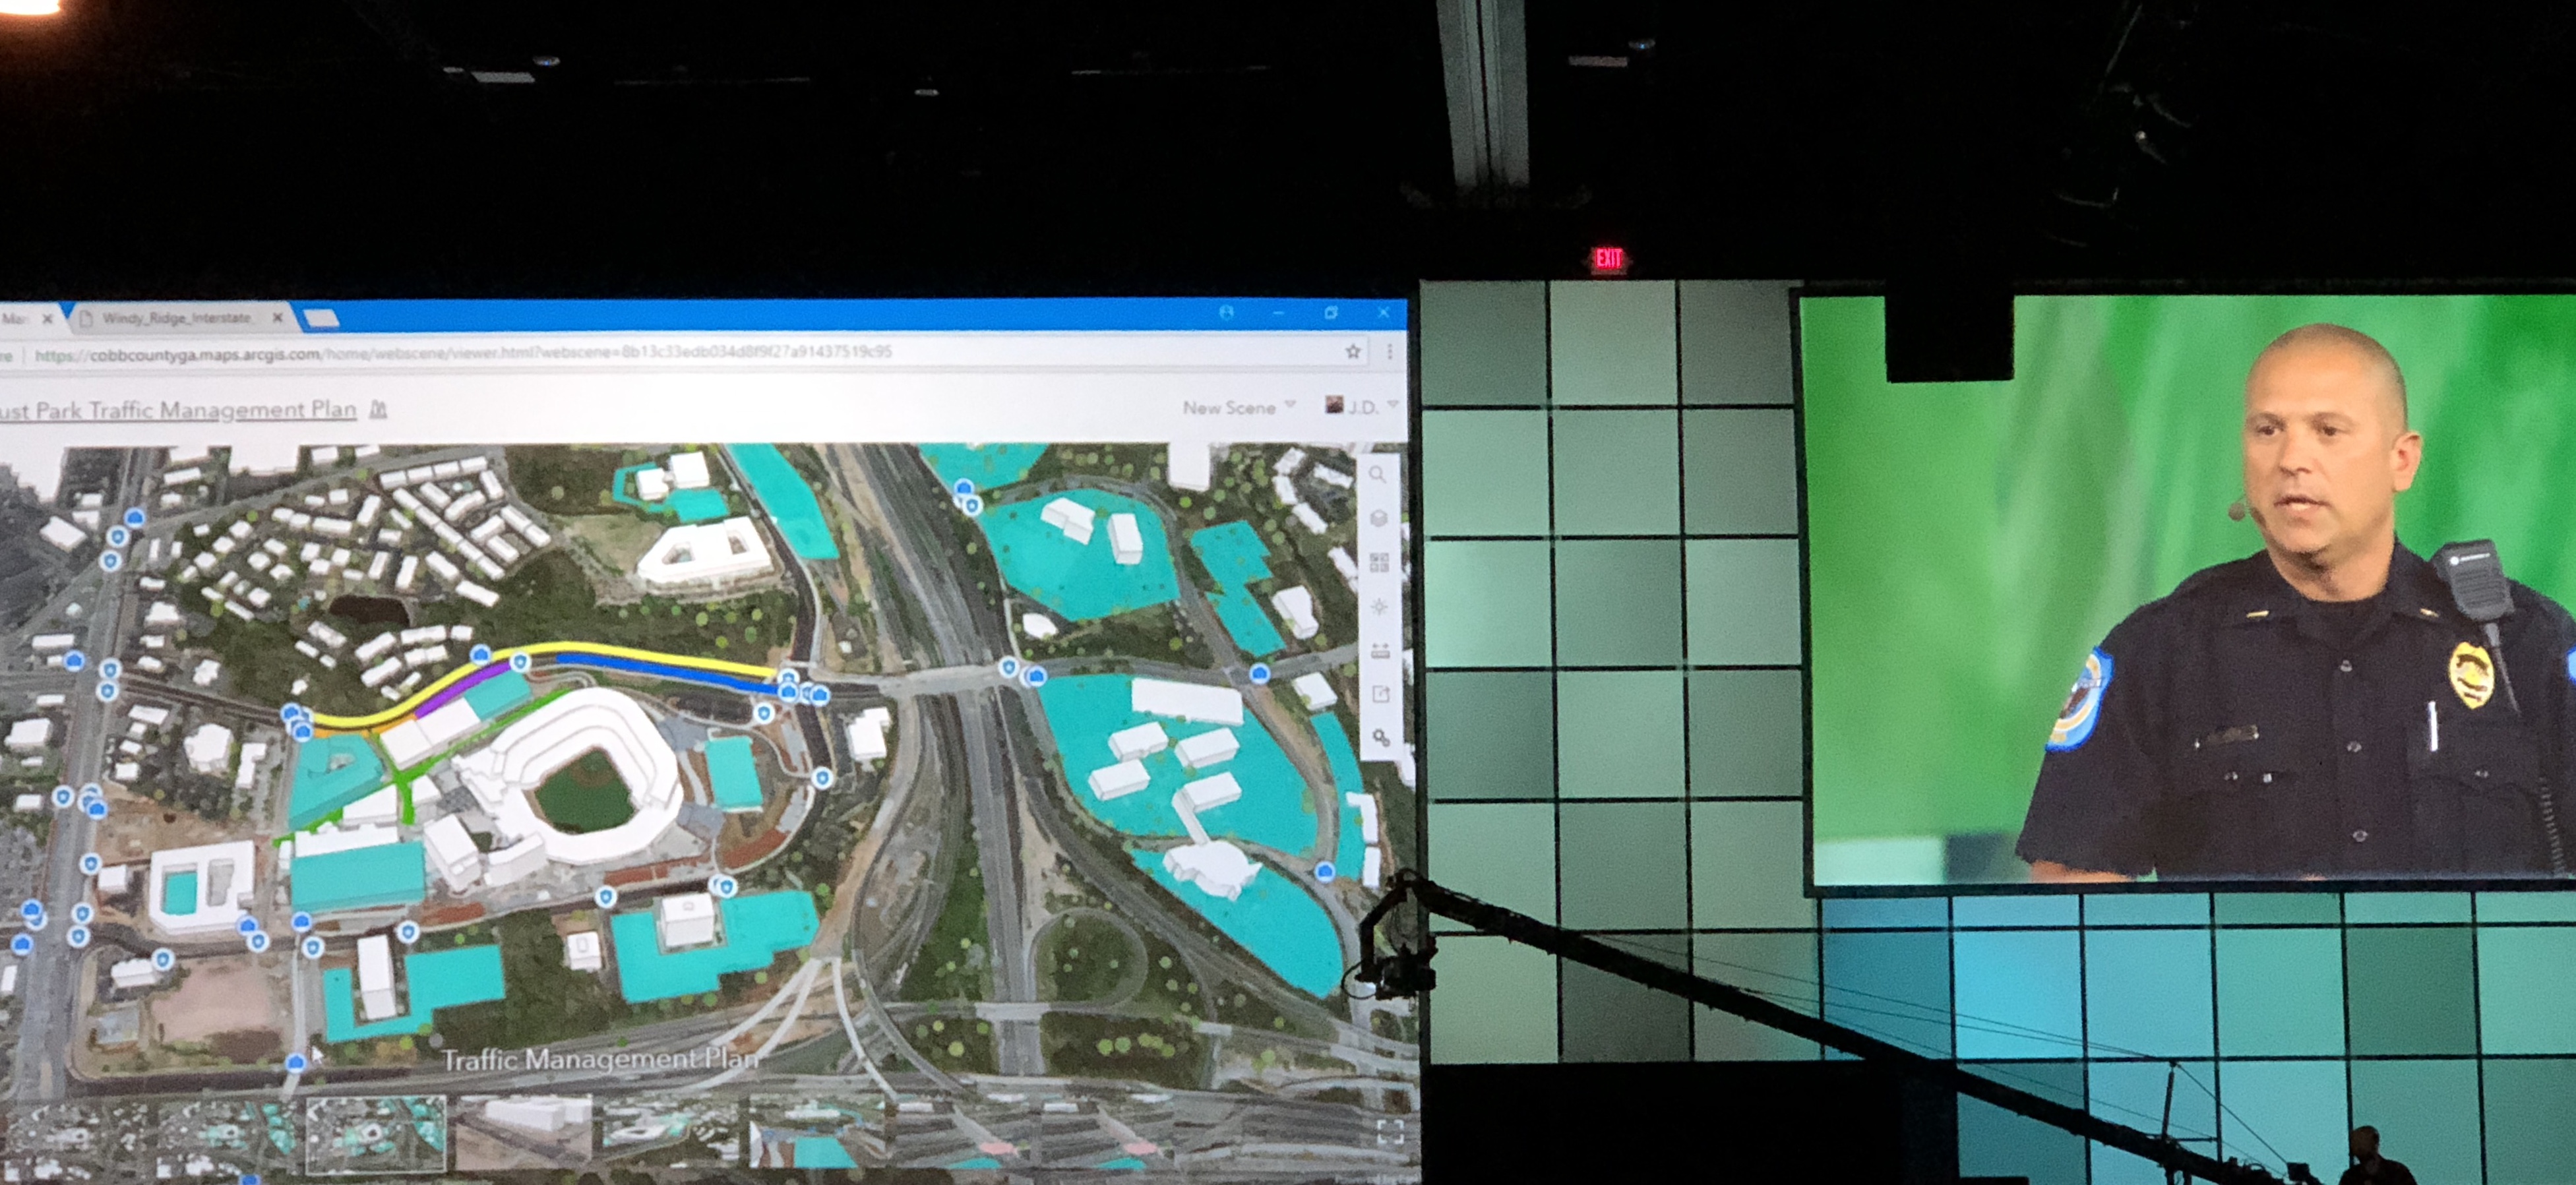
 

Cobb Police Department Use of ArcGIS Urban

11:22 a.m. - ArcGIS Pro Editing and 3D

Speaker: Madeline Schueren


Bern introduces Madeline.
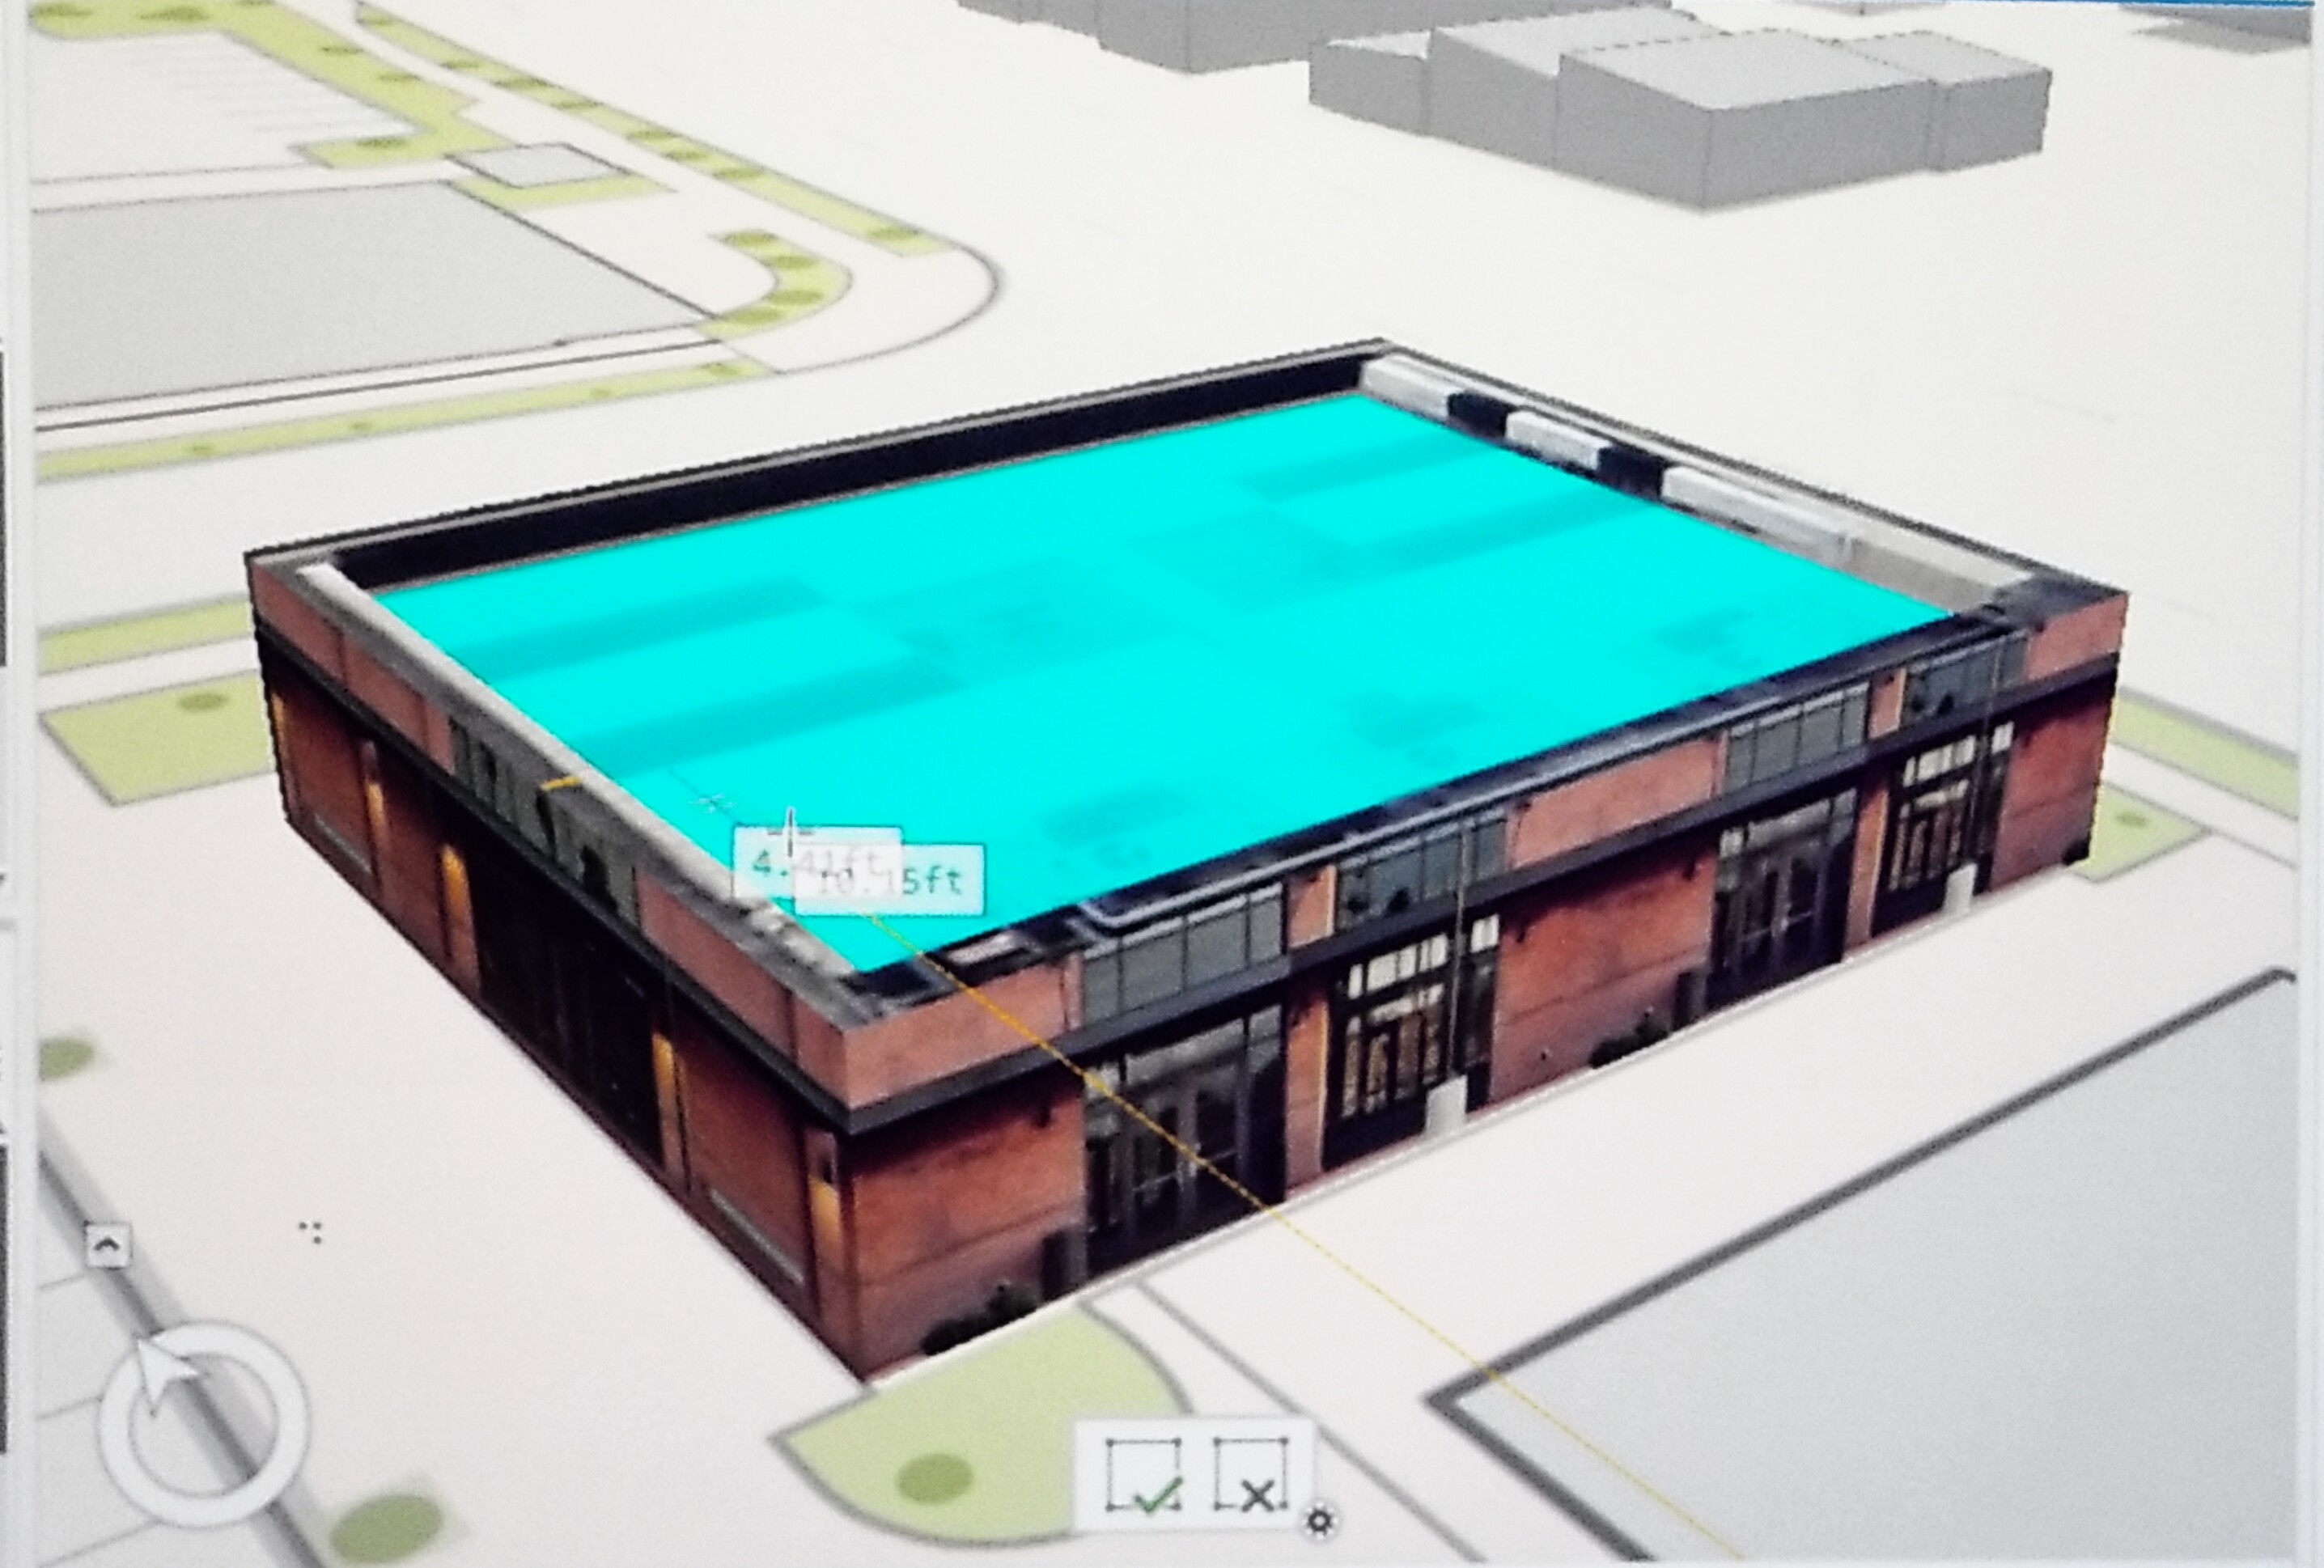
 

Sprouts Shopping CenterMadeline explains how using tools in ArcGIS Pro 2.2 can help proactively manage changes in population growth, traffic patterns and developing construction with a map demonstration of a construction site for a new commercial center in Redlands, CA. In only 5-minutes she adds labels to buildings, parking spaces, building layers, and depth to the building’s doors and ventilation systems to create a 3D model of the building. "Editing in 3D has never been easier with ArcGIS Pro 2.2."
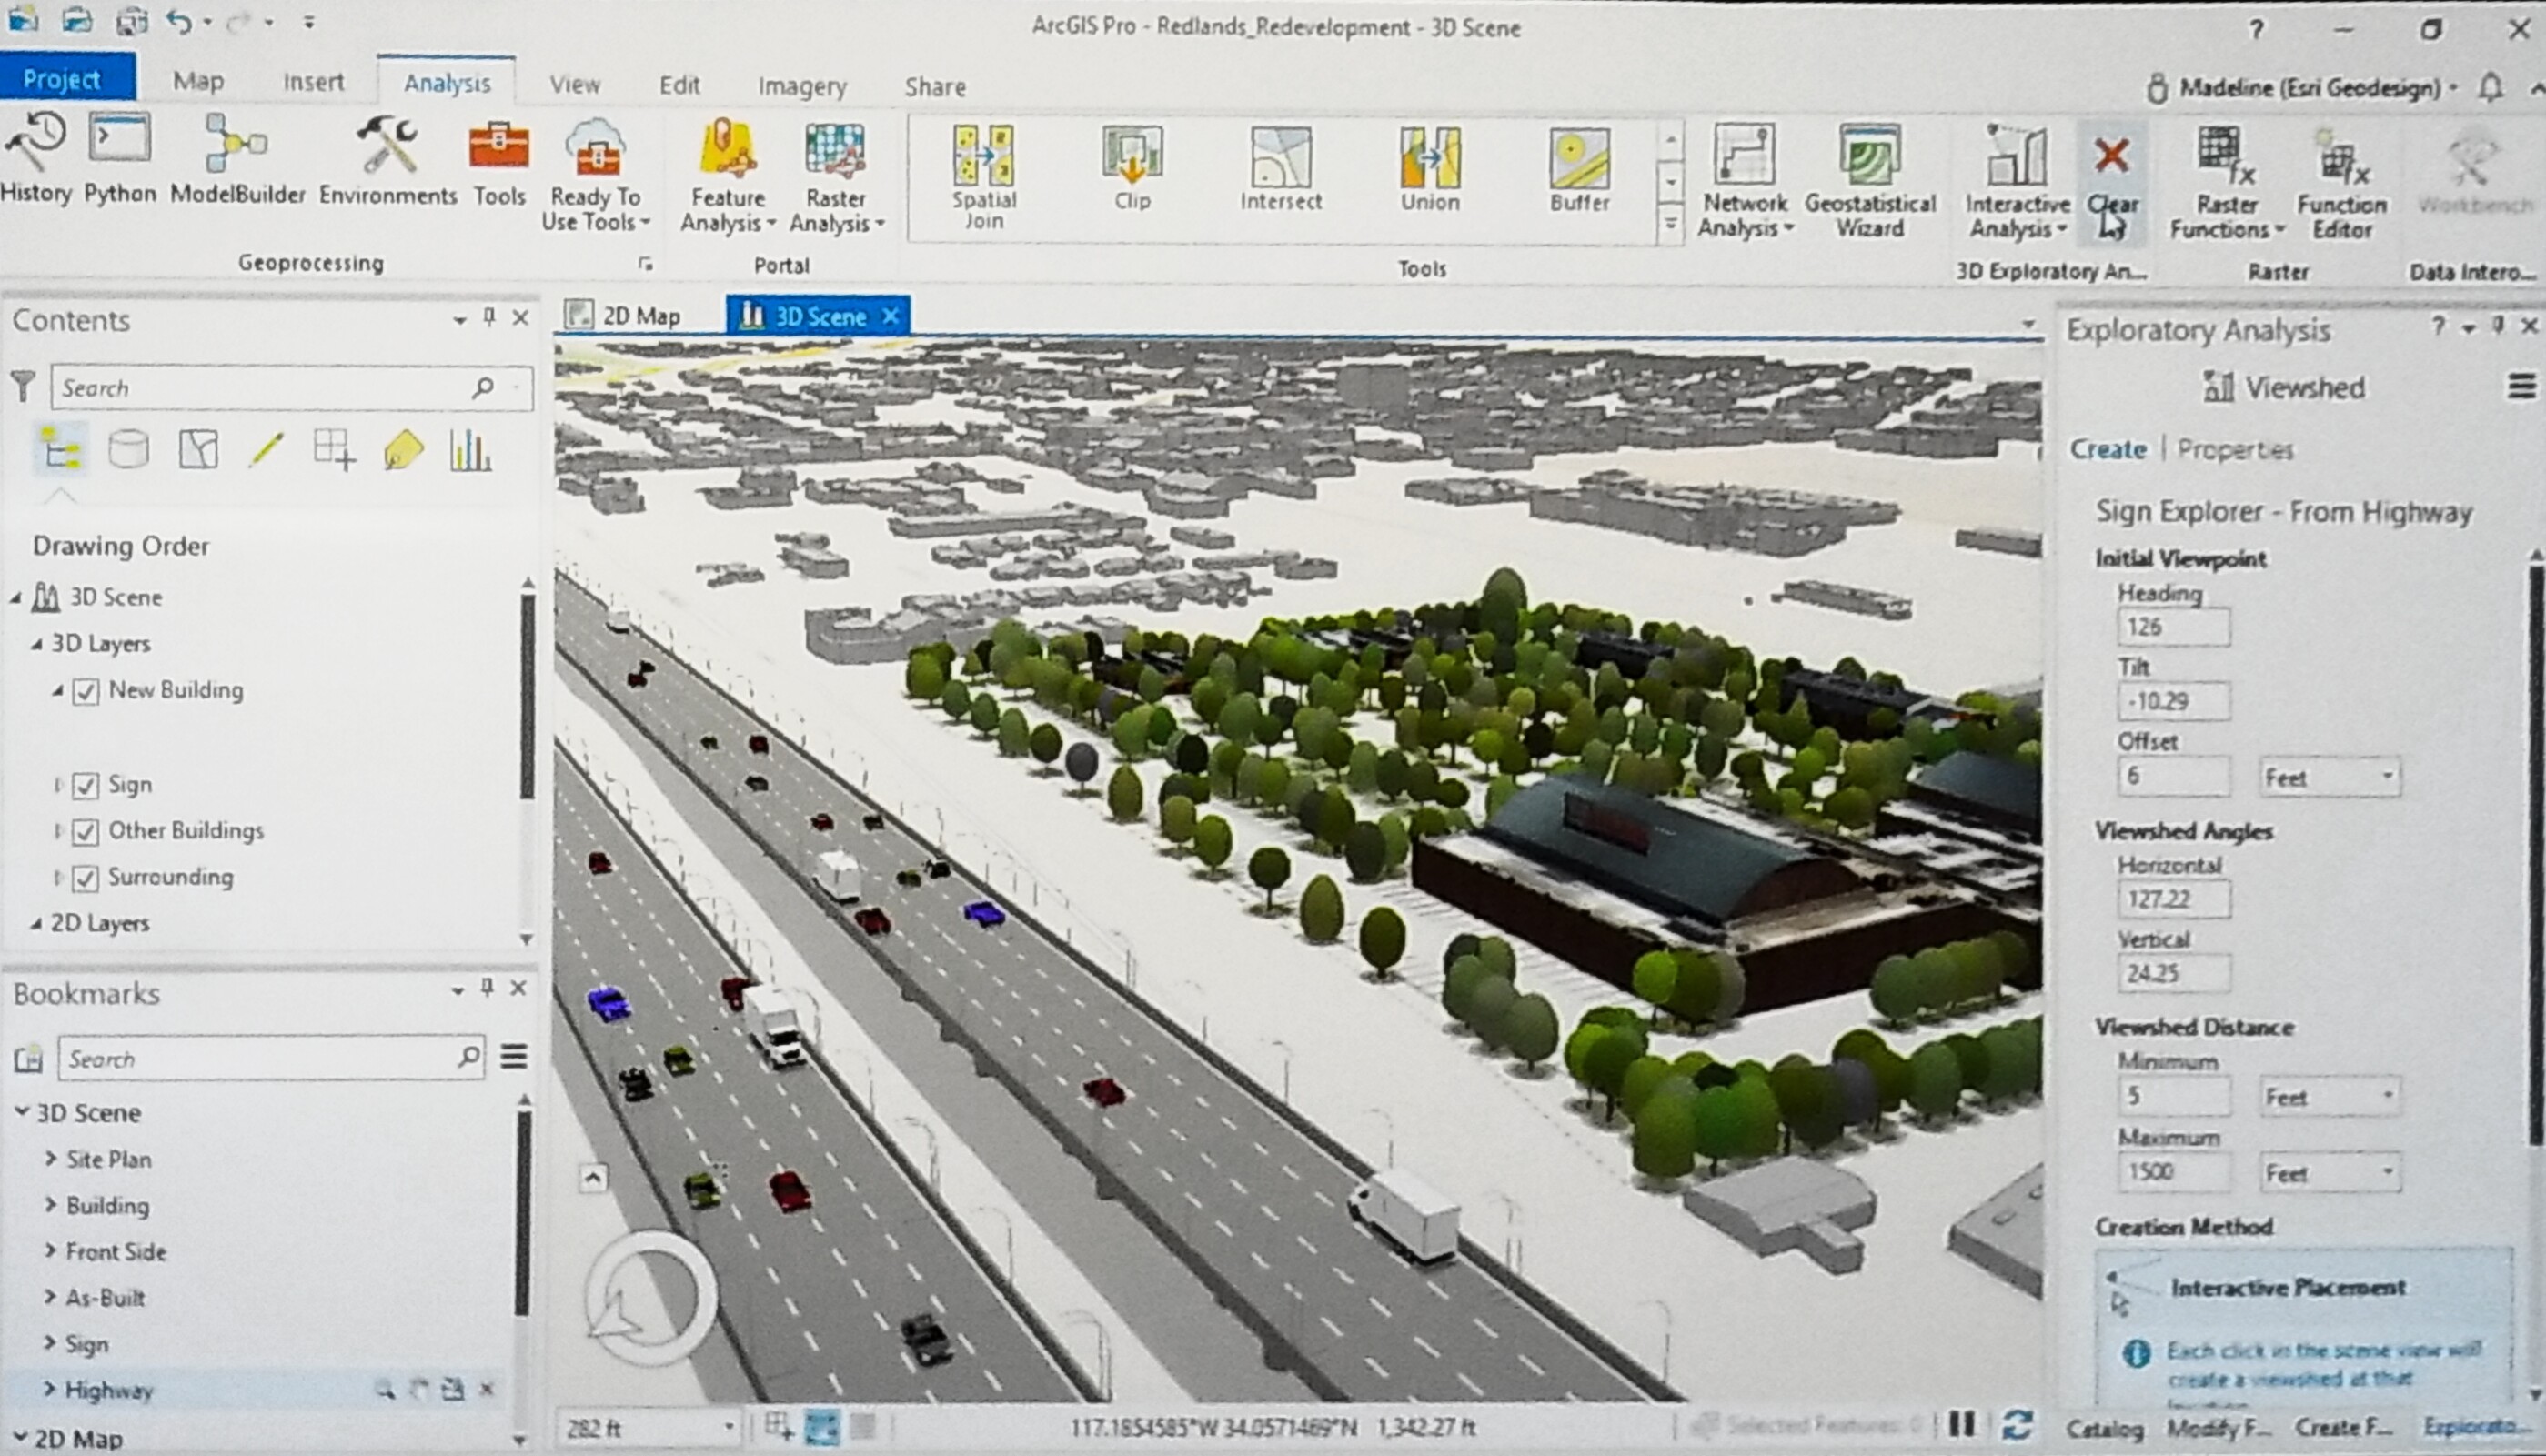
Sprouts Shopping Center complete

11:28 a.m. - Enterprise Sites

Speaker: Shannon Kalisky


Shannon thanks Bern for his introduction and launches her presentation with a Portal developed for the city of San Antonio. We've added a new capability with ArcGIS 10.1 to allow you to enhance your existing portal called Enterprise Sites. This provides content, important information at the user's fingertips.
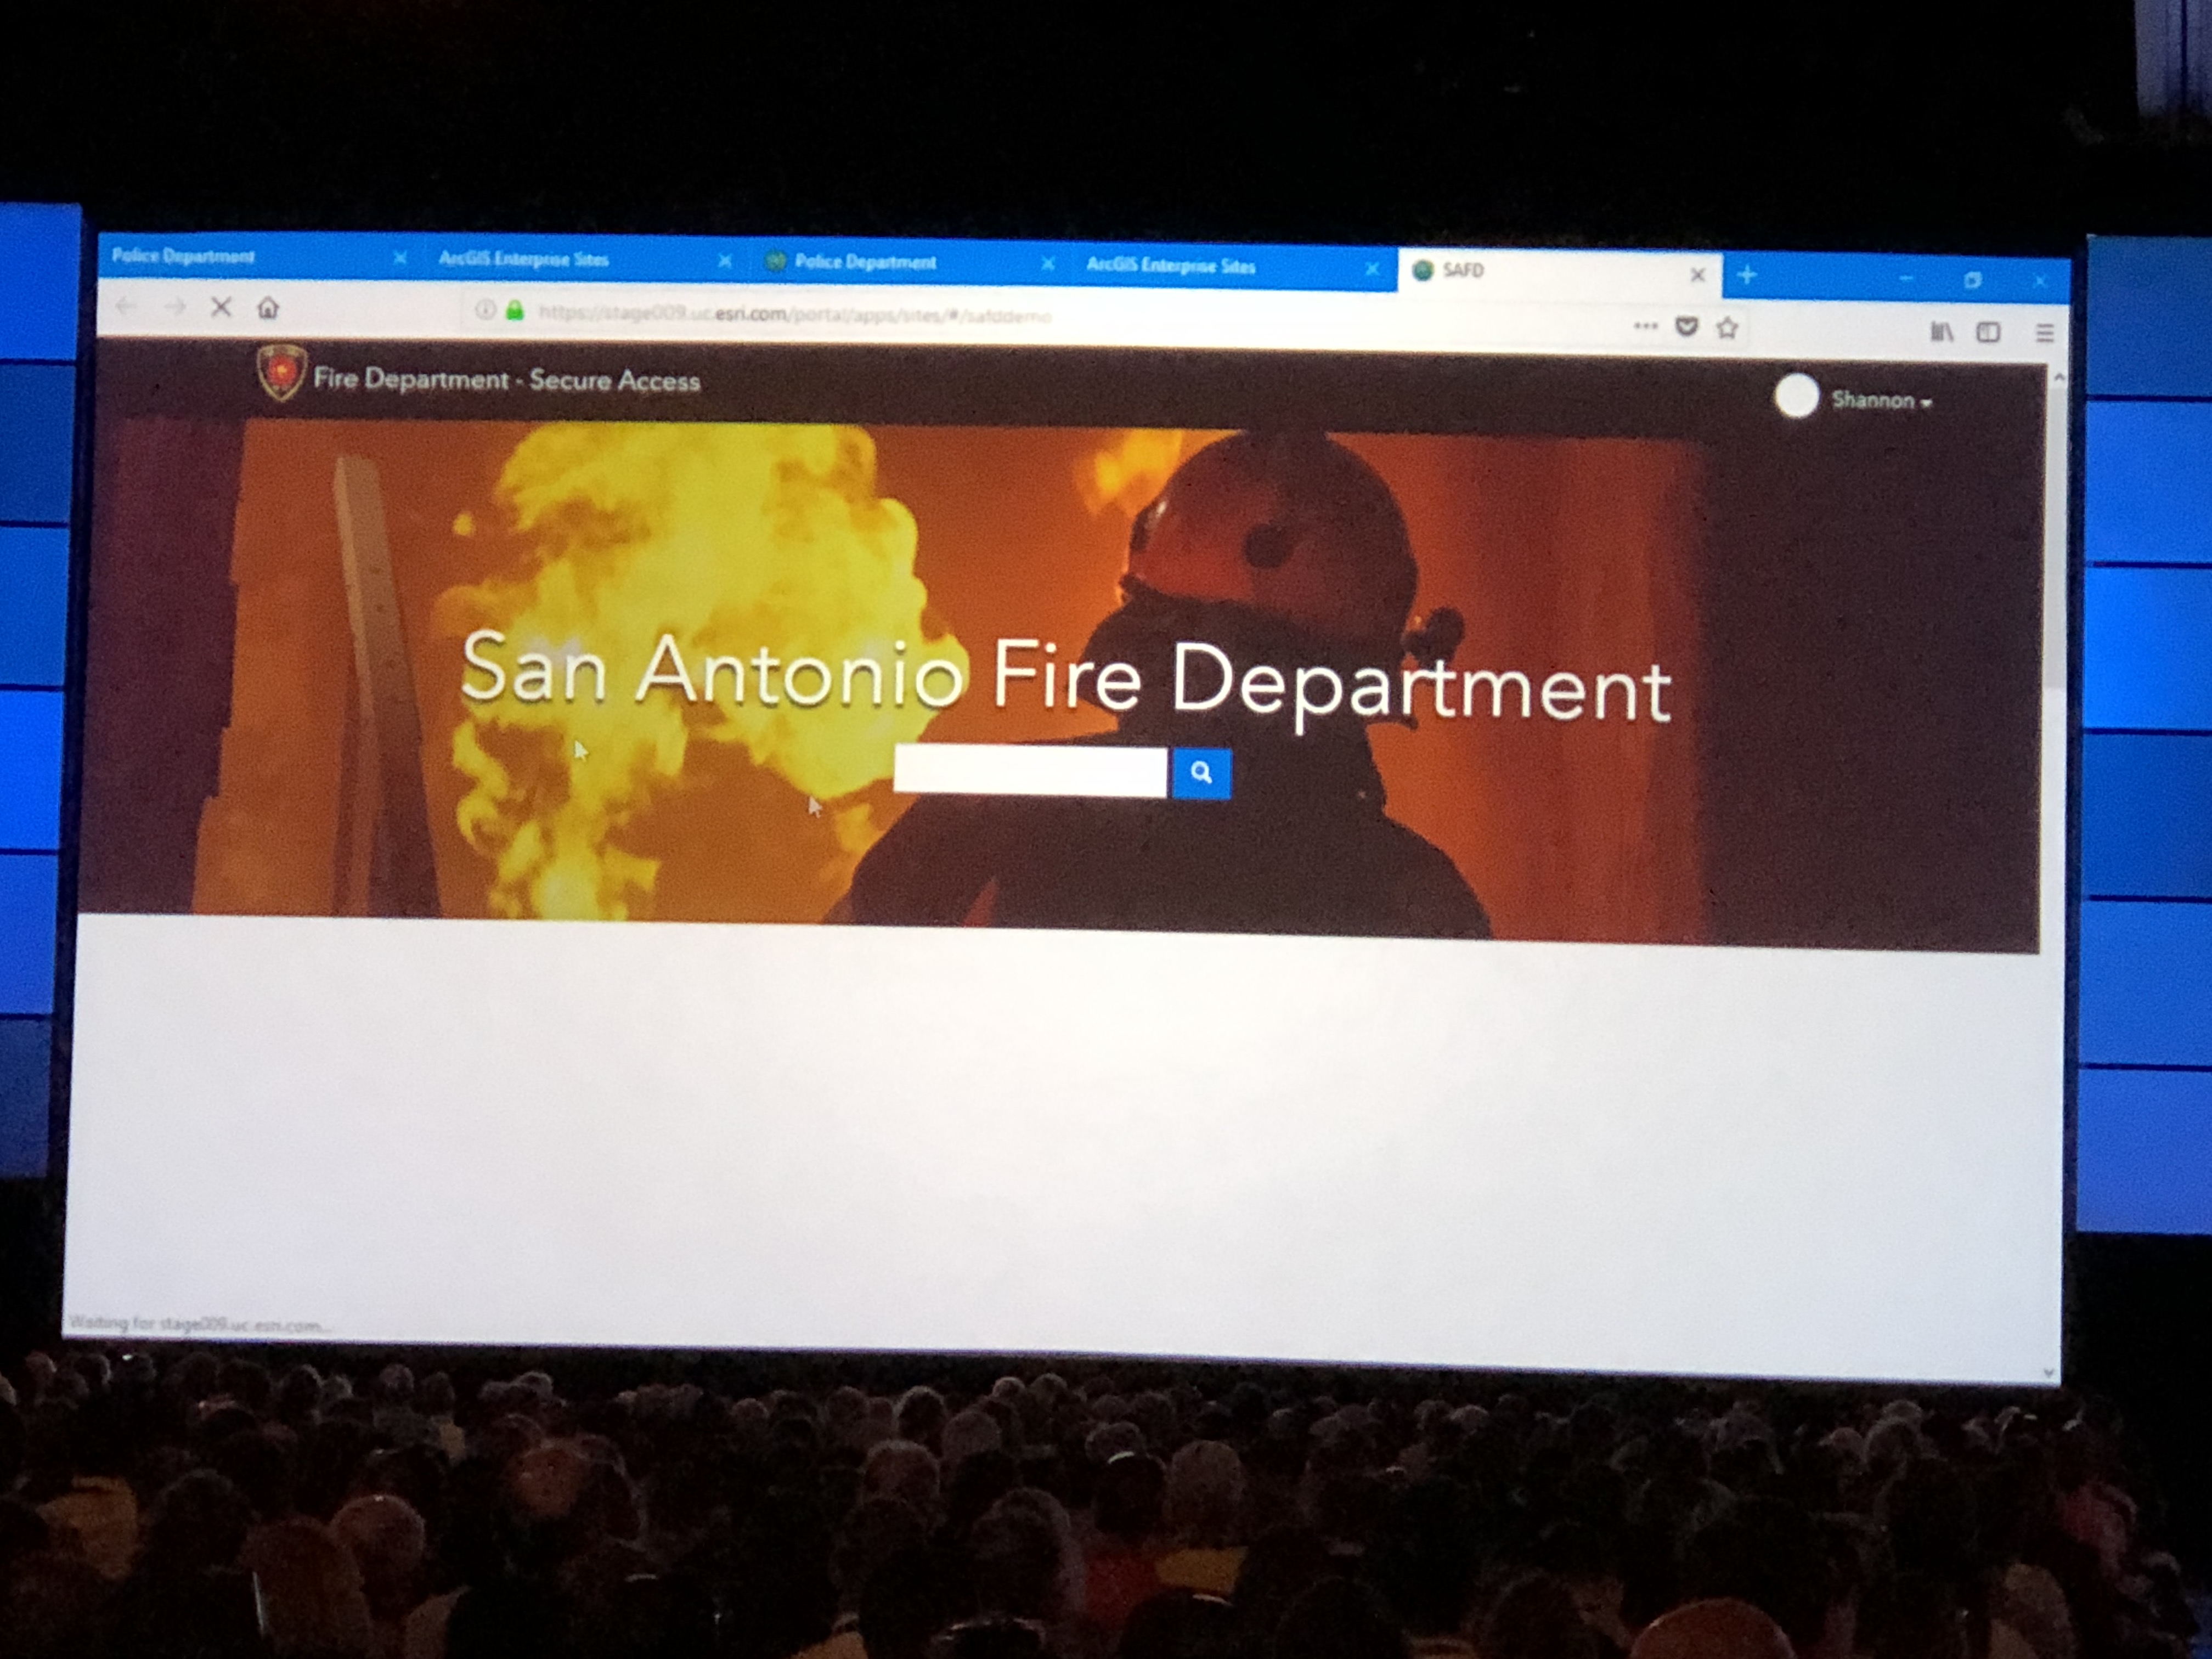
San Antonio Fire Department Sites Demo

She demonstrates how quick and easy it is to create a portal site for the San Antonio Fire Department without having to do or know web code. In only 5-minutes she creates adds groups that can access the new site. She then adds widgets with web map for calls, dashboards, service data and categories.

11:35 a.m. - ArcGIS Pro - Artificial Intelligence (AI)

Speakers: Rohit Singh, Esri and Chris Buscaglia, Esri
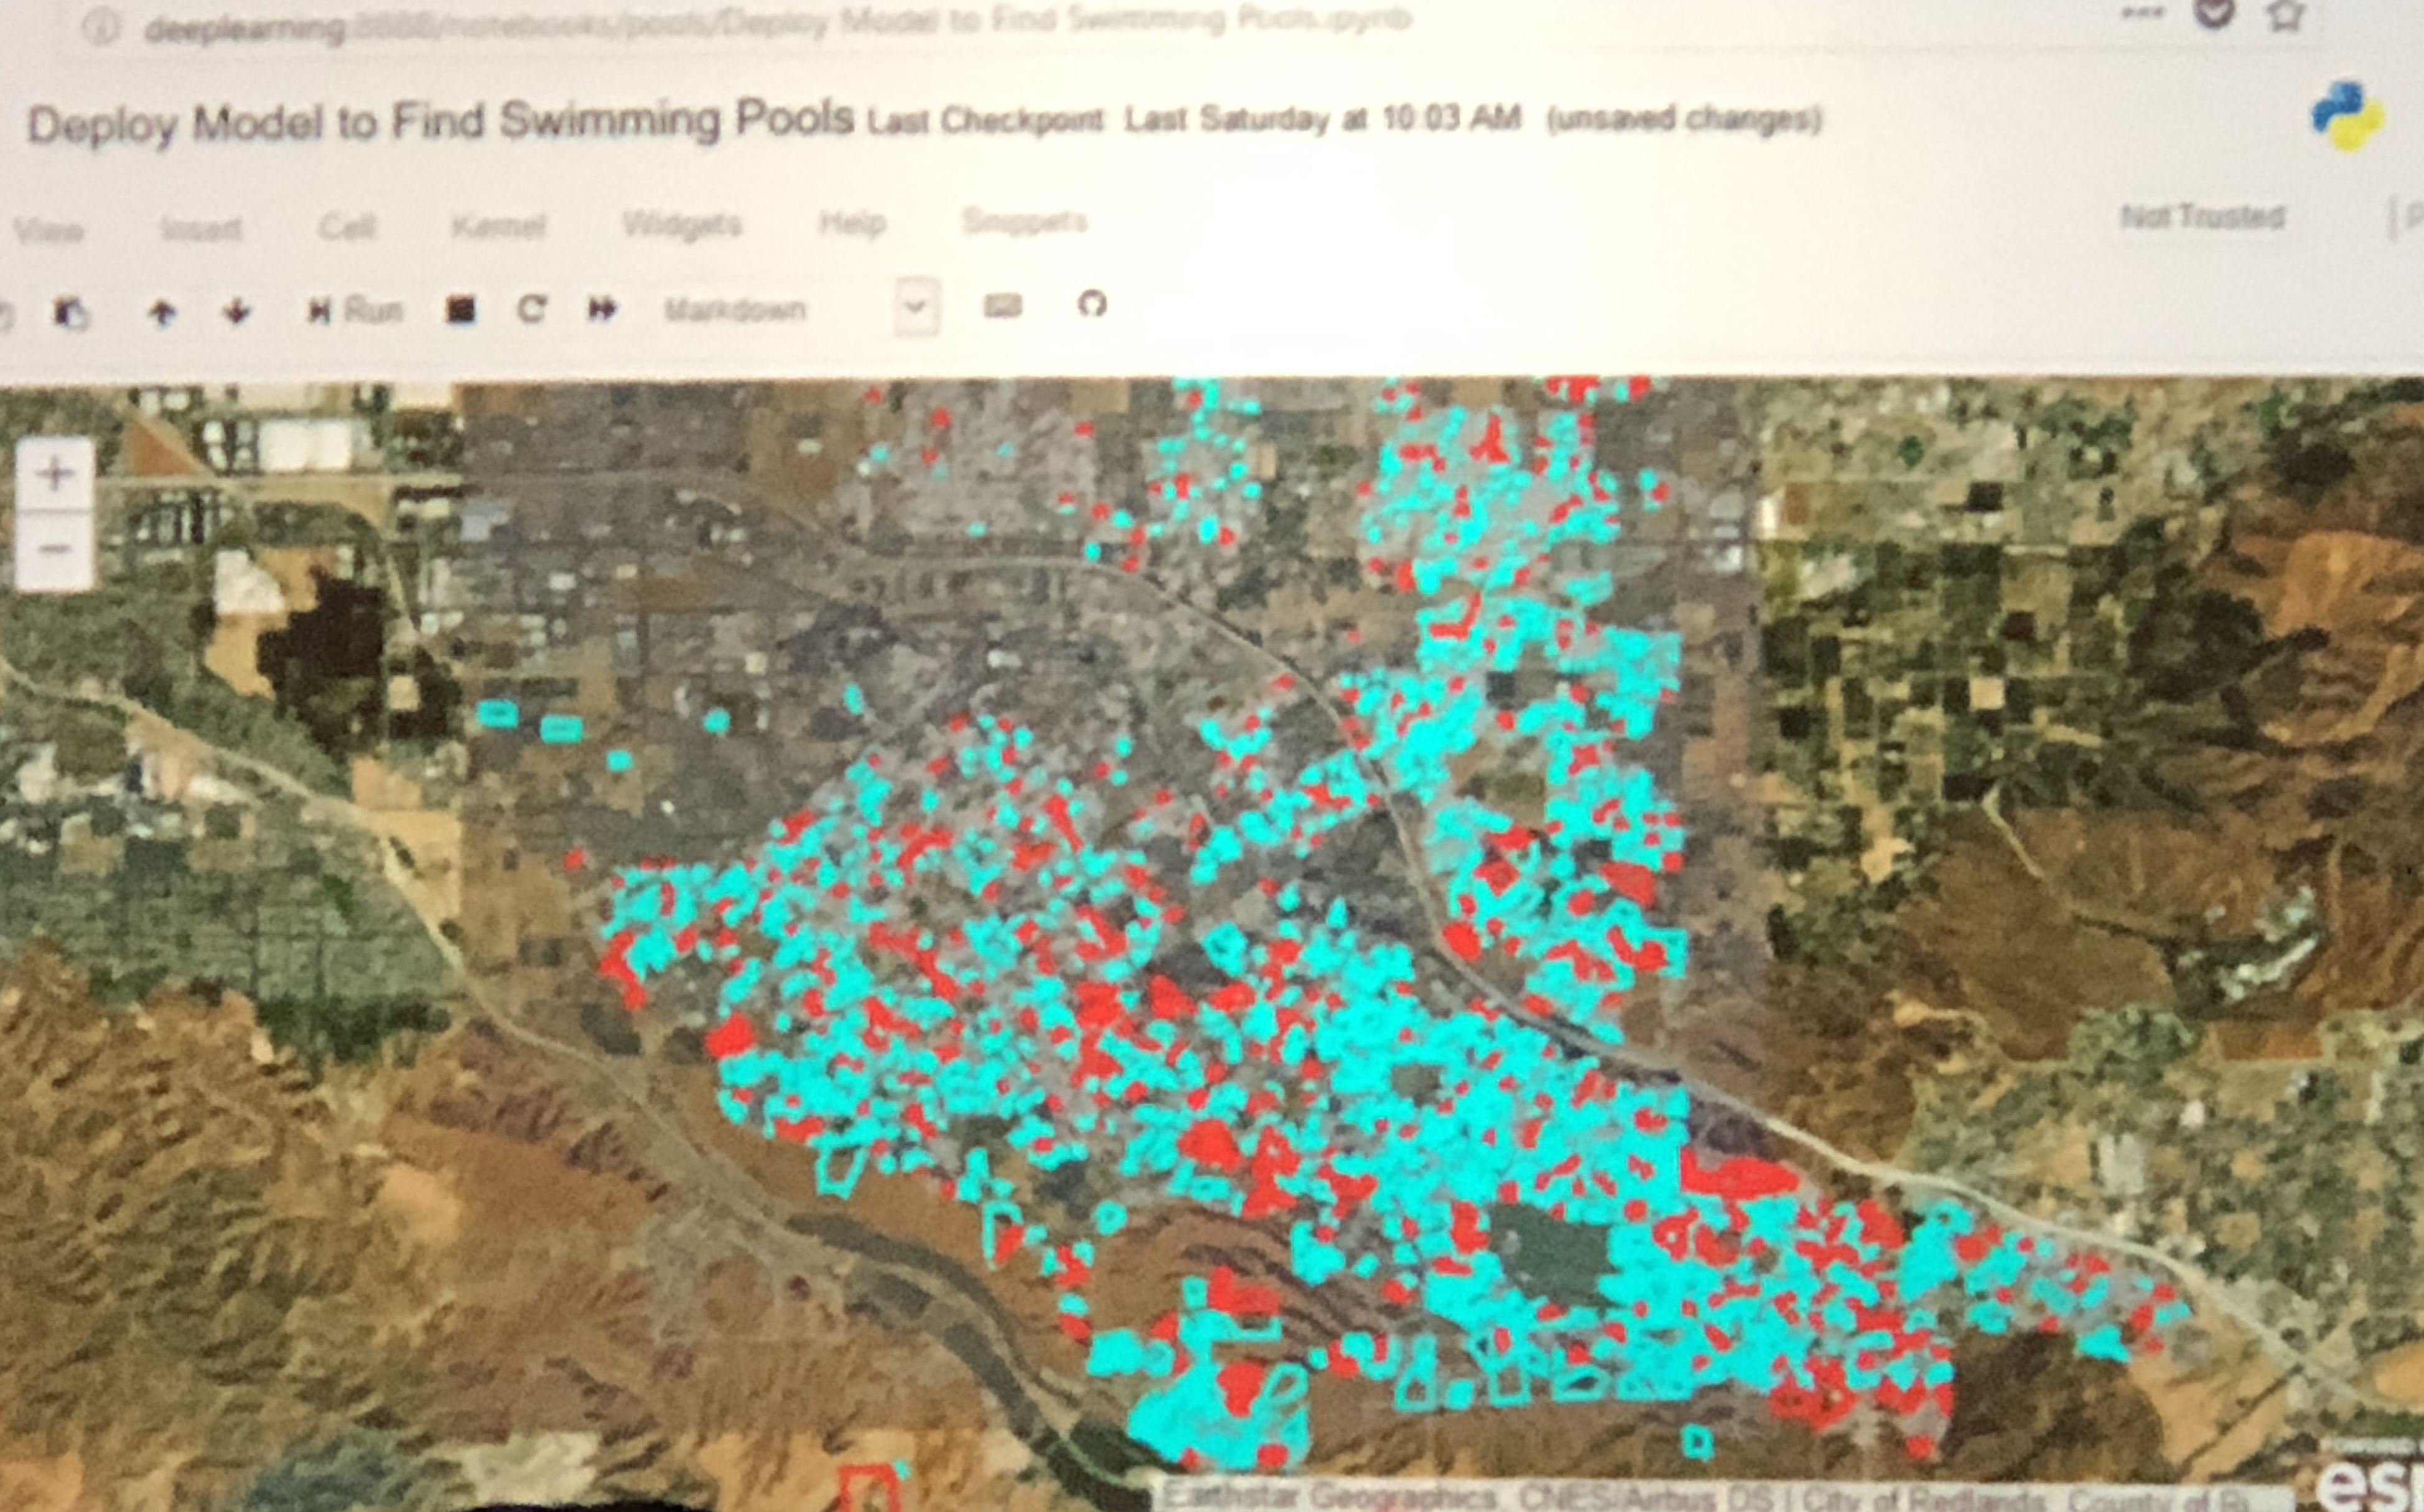
 

Deep LearningRohit, thanks Bern and gives an example demonstration for detecting swimming pools using infrared imaging to develop training data and object detection to create the training model that provides information of what properties have swimming pools. Deep learning of this kind can also be used to detect neglected pools that are at risk for mosquito breeding.

Chris takes us on a trip to New Orleans with visuals of blighted properties since before Hurricane Katrina. Images captured by city contractors from the street level.
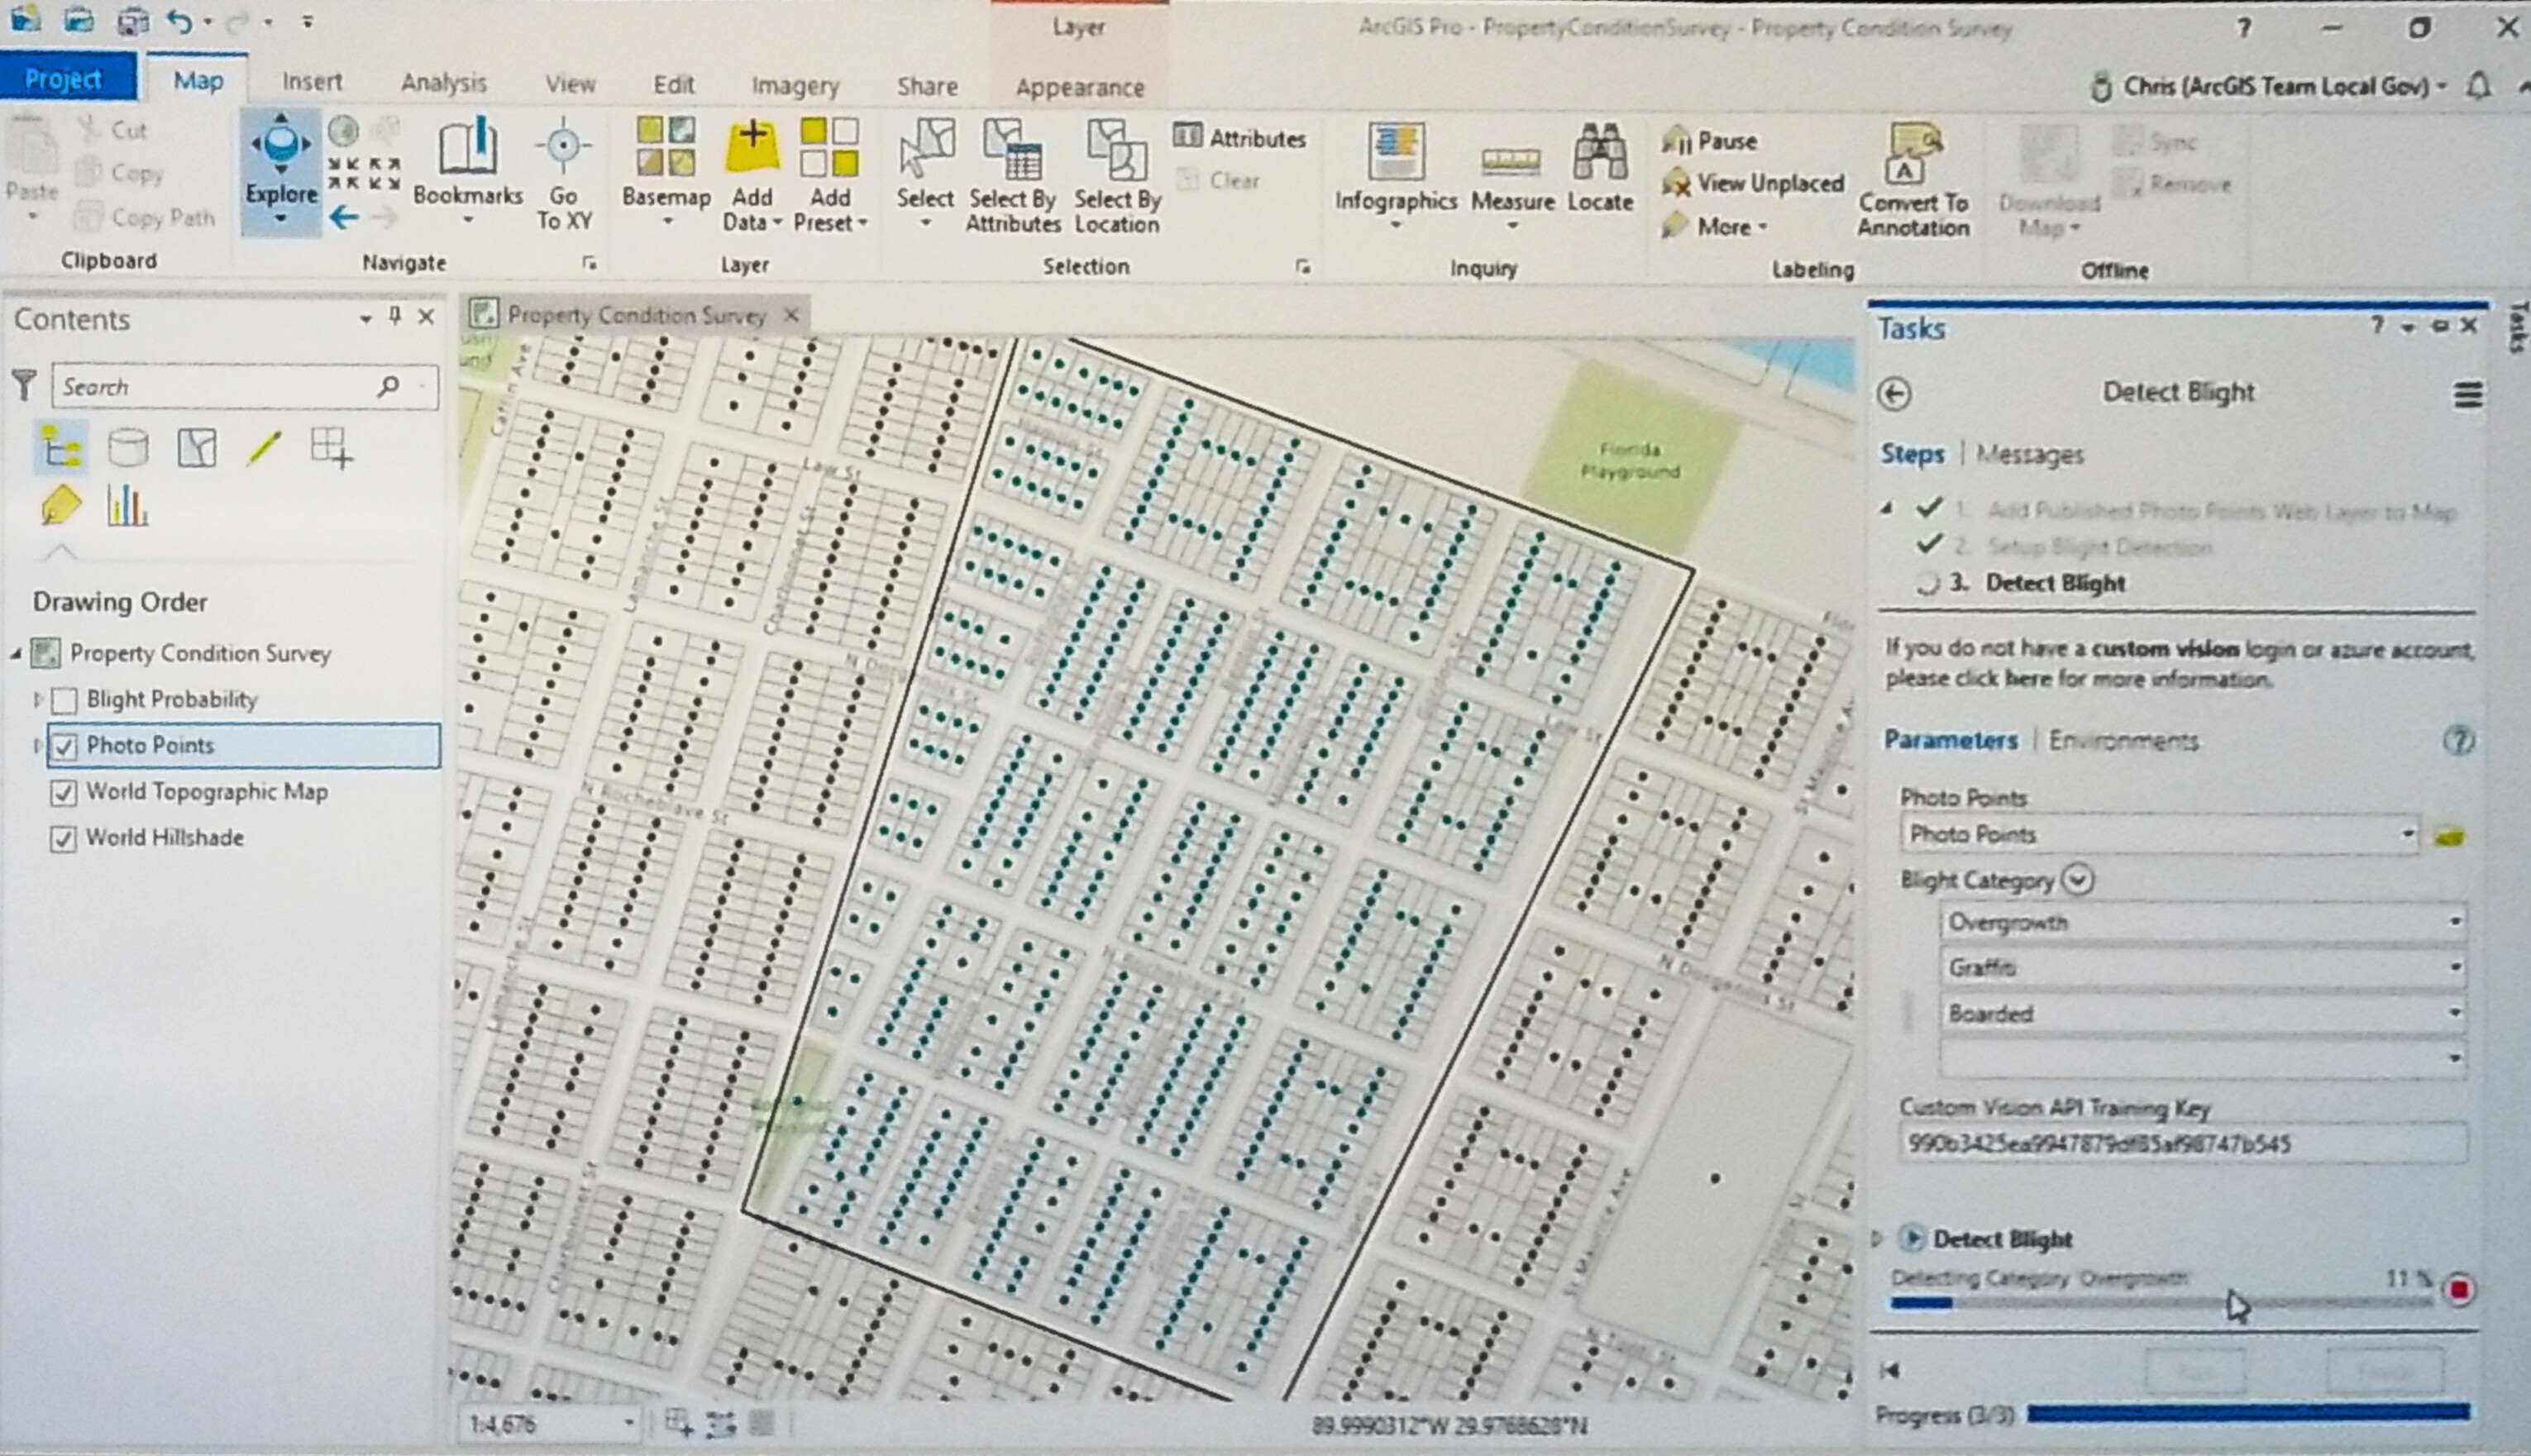
 Blight Areas in New Orleans

Using AI with the NEW Property Condition Survey and ArcGIS Pro, he can identify a neighborhood in New Orleans that has not been classified with blight categories. Integrating with the training key in Microsoft Custom Vision, using out-of-the-box training photos focused on graffiti, boarded windows, and overgrown yards, the AI can be trained with a blight model in Custom Vision, classifying these images with resulting layers that can be used in ArcGIS. 

Looking at these specific properties shows the overall blight probability score, more effectively prioritizing neighborhoods needing assessments. In under one minute, Chris is able to classify 600 properties for less than one dollar by using ArcGIS and AI together to solve difficult problems to understand a variety of neighborhood conditions.


Written by Matt Ball, Esri Staff Writer

Using deep learning workflows, Rohit Singh demonstrated the automatic detection of swimming pools in residential areas in a city. Using ArcGIS Pro with NAIP imagery from the Living Atlas he began by labeling sample pools. Then this training sample data integrates with Jupyter Notebook and the ArcGIS API for Python to integrate with PyTorch and the FastAI library to train an object detection model. The model helps find the pools across the entire city. Analysis tools from ArcGIS online allow us to join the pools to parcels. Next, we look at the properties that haven’t recorded pools in the assessor’s database, helping the city generate a report with properties that need to be field verified.

Chris Buscaglia showed the identification of areas of blight in New Orleans, detecting graffiti, boarded windows, and overgrown yards. The result showed buildings that needed further field verification. Instead of taking hundreds of hours, he was able to classify hundreds of photos in minutes.

11:40 a.m. - Restoring New York City’s Lower Catskill Aqueduct with GIS & BIM

Company: Mott MacDonald

Speakers: Cory Dippold and Anthony Renteria

Written by Matt Ball

Cory Dippold and Anthony Renteria from Mott MacDonald showcased the integration of GIS and BIM for the planned maintenance of the Lower Catskill Aqueduct.

New York City’s water supply system starts well above the city in the watersheds that feed reservoirs managed by the Department of Environmental Protection (DEP). 500 million gallons of water flows each day through aqueducts that run over 120 miles. The last twelve miles of the Catskill Aqueduct, which is more than 120 years old, has been targeted for repair. Cracks and weathering in this segment, known as the Lower Catskill Aqueduct, will be repaired over a ten-year span.

The project is born digital with the creation of a digital twin. Mott MacDonald has surveyed the aqueduct’s subsurface and surface using LiDAR scanning to capture the details of the aqueduct. Existing conditions are loaded into ArcGIS Online along with original contracting documents from 1911. The process detailed known assets for engineering evaluations, and it also discovered some unknown assets, such as manhole access points that were covered over by vegetation in the ensuing years. Porting all the information to ArcGIS Online made it easy to share with DEP, and this sharing will be ongoing throughout the maintenance process, providing visibility into the progress and performance of the job.

There’s a whole building information modeling (BIM) aspect to this project. The project context model is created in Autodesk InfraWorks with full asset information that aligns with the LiDAR data and satellite imagery. The data was imported into Autodesk InfraWorks to provide a project context model.

The BIM model is created in Autodesk Revit. The digital model is imported back to InfraWorks to create the context model. Now, for the first time, they can pull the Revit model into ArcGIS with a full-fidelity transfer. The model can be orbited and explored, looking at features both above and below grade.

New tools in ArcGIS Online allow Mott MacDonald to slice the GIS model and reveal the detailed BIM model below ground. These new tools allow the users to section and cut through the model like never before, removing the GIS data to reveal the planimetric data for a view of the engineering-grade model within GIS.

A small section of the aqueduct that’s no longer in use allowed Mott MacDonald to test the use of LiDAR to create a reality capture of the interior of the aqueduct. This information was loaded into GIS to examine defects and to quantify cracks and spalls to be sent to the contractors to repair them. This detailed information will help the contractor to expedite repairs while providing a database of all the defects to create a contractor job package.

Bringing the GIS and BIM data together, allows you to further explore the model. A single environment to navigate around the project. It allows those that aren’t practitioners of BIM or GIS to explore the engineering-grade model.

"Welcome to the new Workflow at Mott MacDonald." ~ Cory Dippold

11:49 a.m. - ArcGIS Utility Network Management

Speakers: Remi Myers, Esri and Sarayana Kesavan, Esri


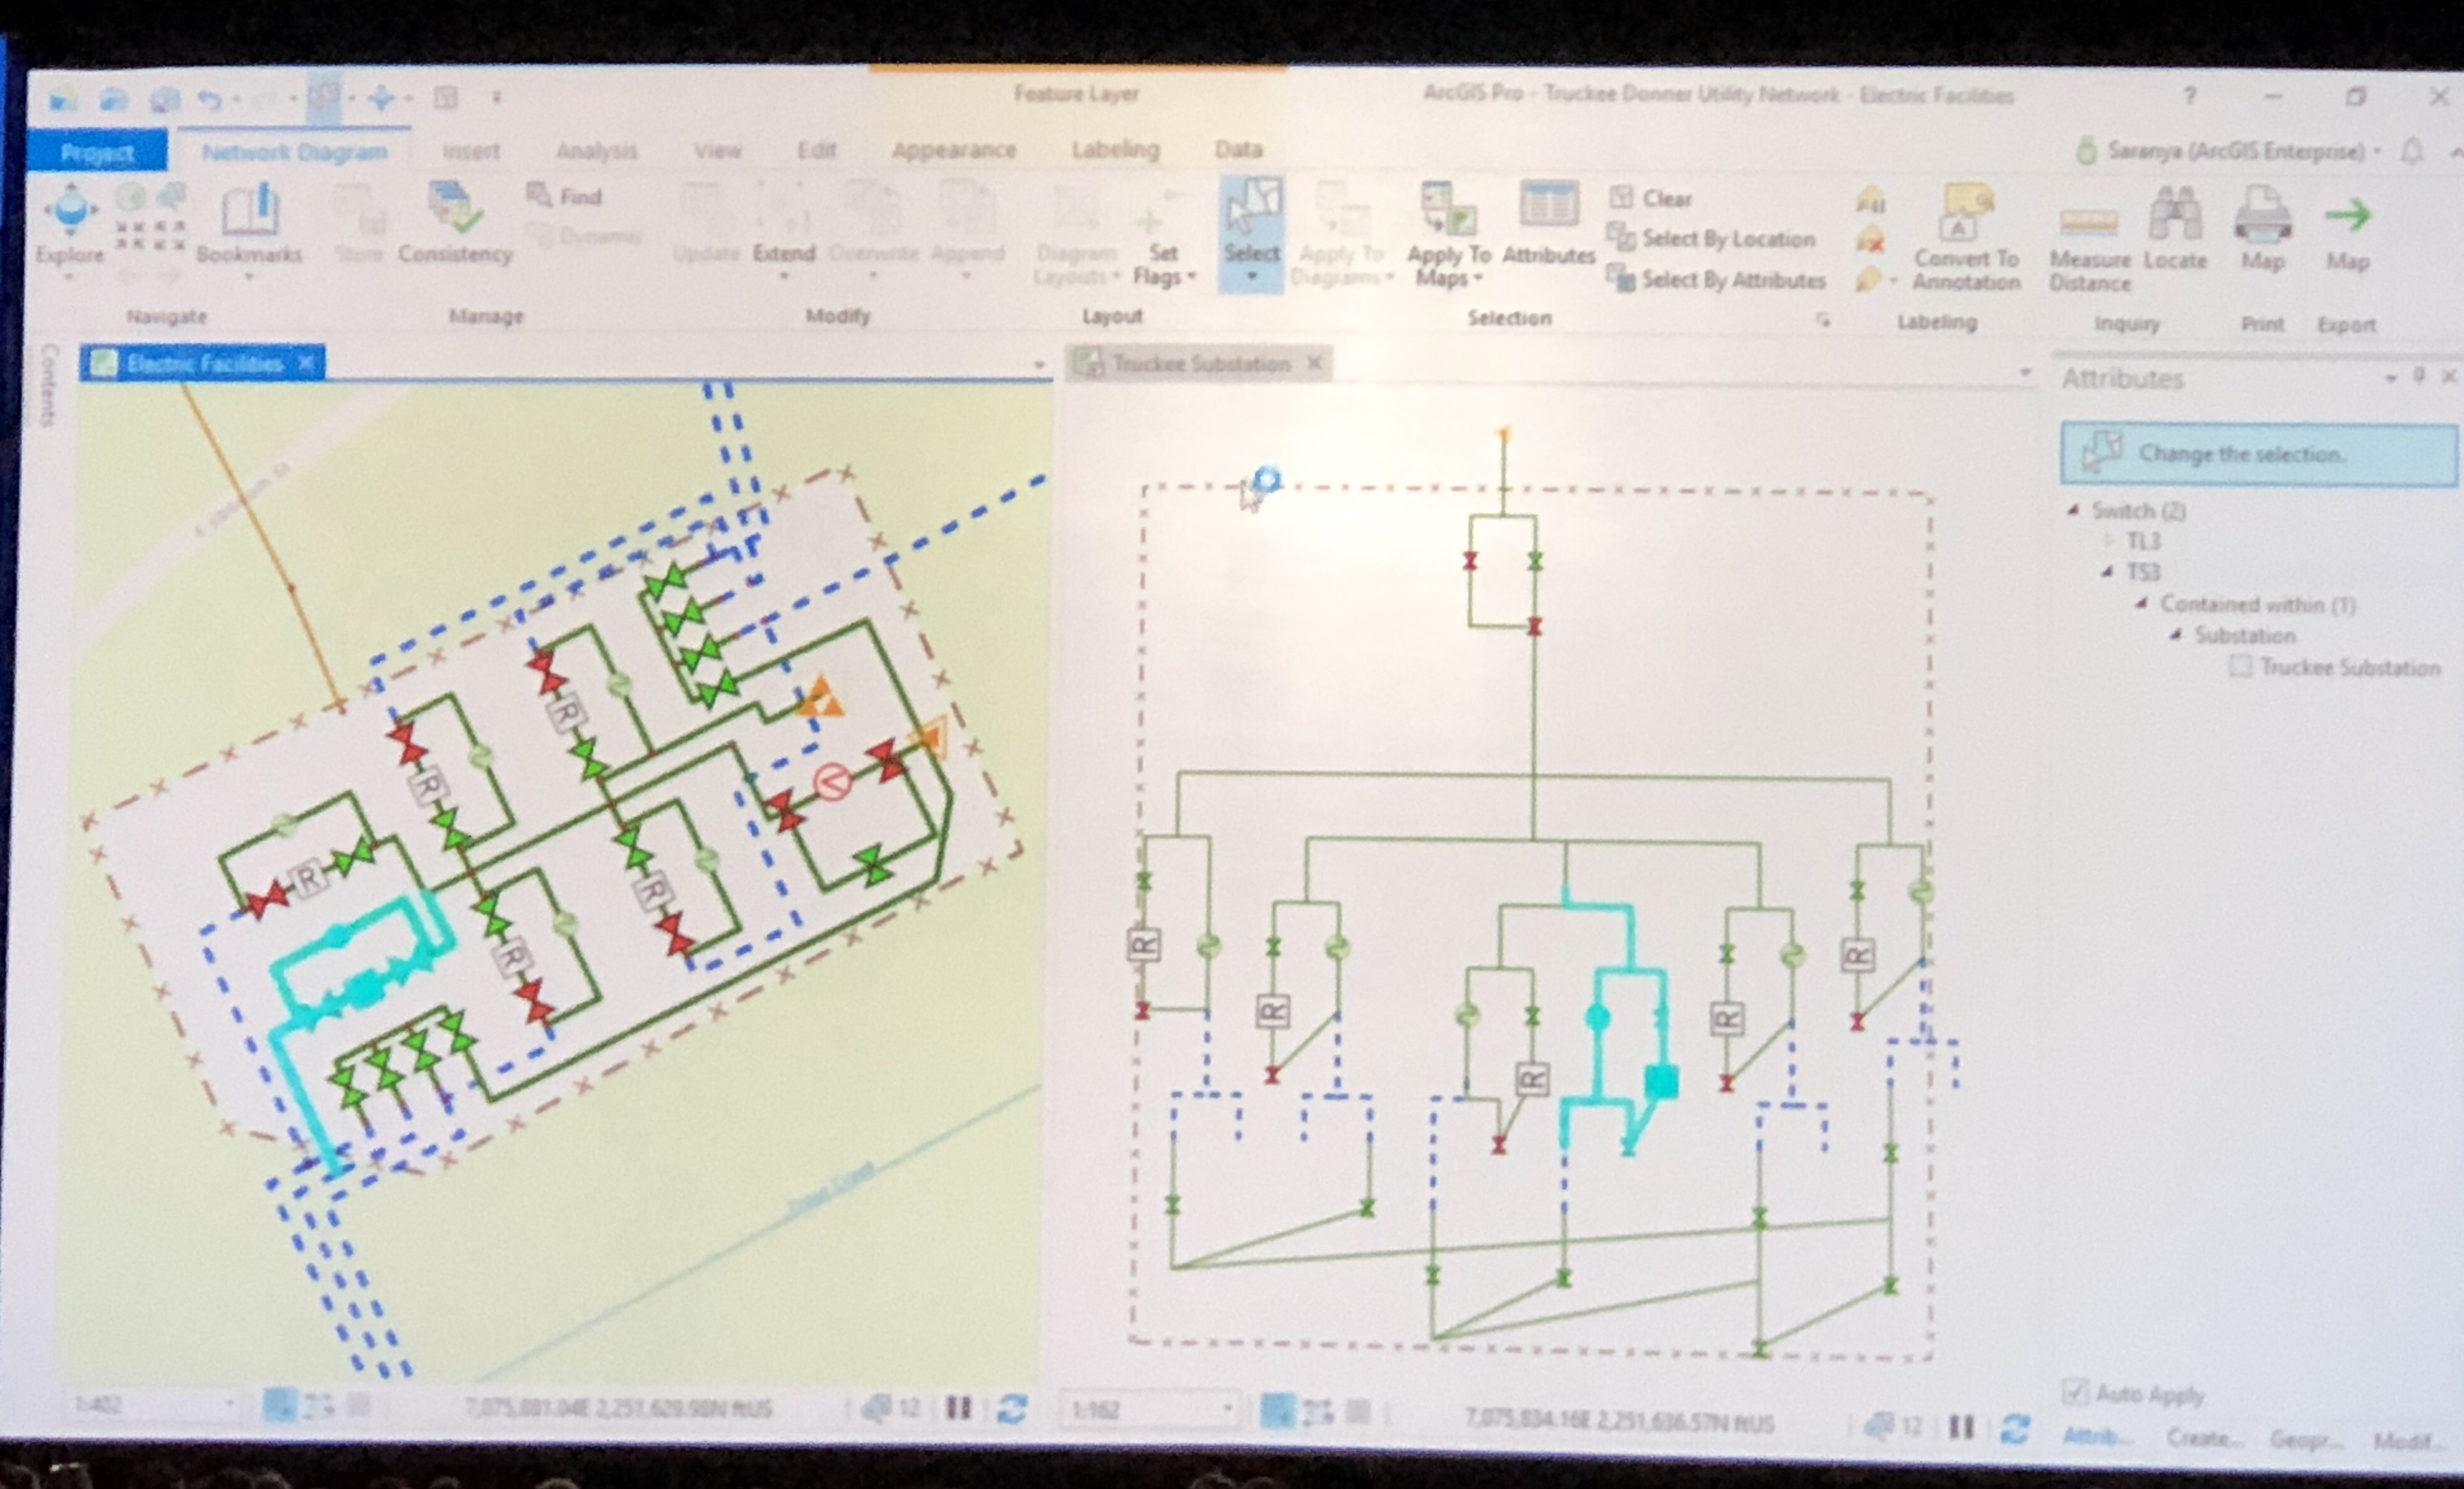
In a collaborative demonstration, Remi and Saranya show a Basemap using the ArcGIS Network Management Solution to help Truckee Donner Public Utility District deliver electric power and water to nearly 25,000 customers in northern California.
 

Remi describes how ArcGIS is used in UtilitiesSarayana zooms into a neighborhood from above seeing electrical and water systems, valves, switches, transformer containment banks, connectivity lines, and how easily she can reconfigure a pole from one location to

another for a road widening project.

Remi explains how hospitals, such as the Tahoe Forest hospital, is served by multiple sources of power to reduce risks of accidents and equipment failure. By expanding the map views to review terrain and historical weather patterns using a historical marker, they can determine that an additional source of power can be routed from a nearby substation to the hospital.


Sarayana and Remi then demonstrate how easily they can map and create a template for power to a golf course and switch it to a 3D model to view potential terrain issues and any risk from the nearby water network.
 Utilities

Wrapping up their demonstration, they show how easily a field user can access the same data from a mobile device using Explorer.


Additional GeoNet resources:

Electric and Gas

Water Utilities

11:53 a.m. - Location Tracking

Speaker: Craig Gillgrass

Craig uses a location tracking the app to configure his profile for tracking when he is only working and turns off the tracking when he is off the clock.

11:58 a.m. - ArcGIS Indoors

Speaker: Madeline Schueren and Adrien Meriaux (demonstration)


Madeline gives a sneak peek into three mobile applications that are coming later this year.

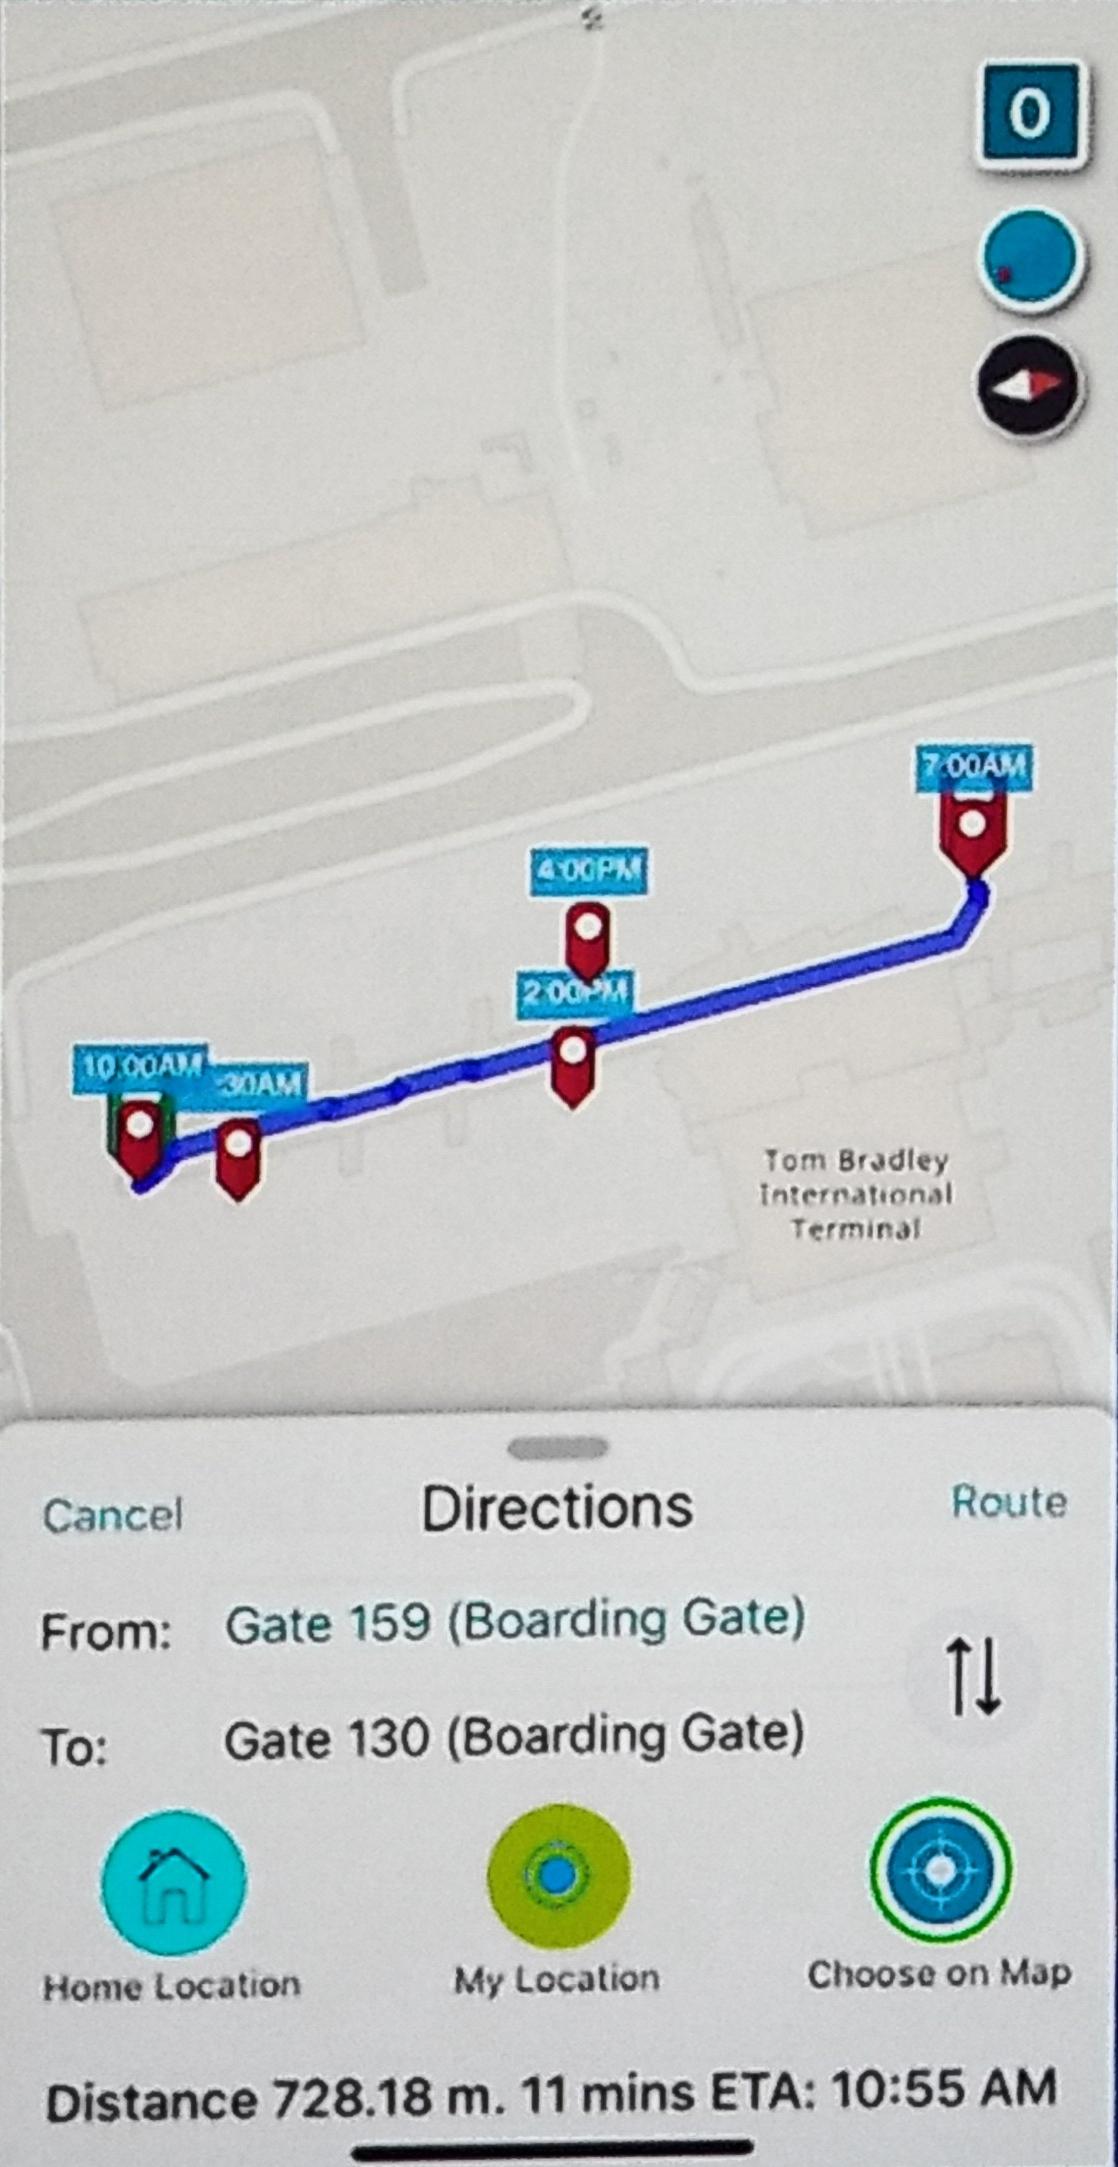
The first new native app being released later in 2018 is ArcGIS Indoors. The demonstration of the day-in-the-life of an LAX gate agent, ArcGIS Indoors will bring efficiency to workflows by allowing users to look at facilities maps that include locations, routes, scheduling, detailed information, and help an employee such as our LAX gate agent to better plan the day and create reports as assignments are completed. 


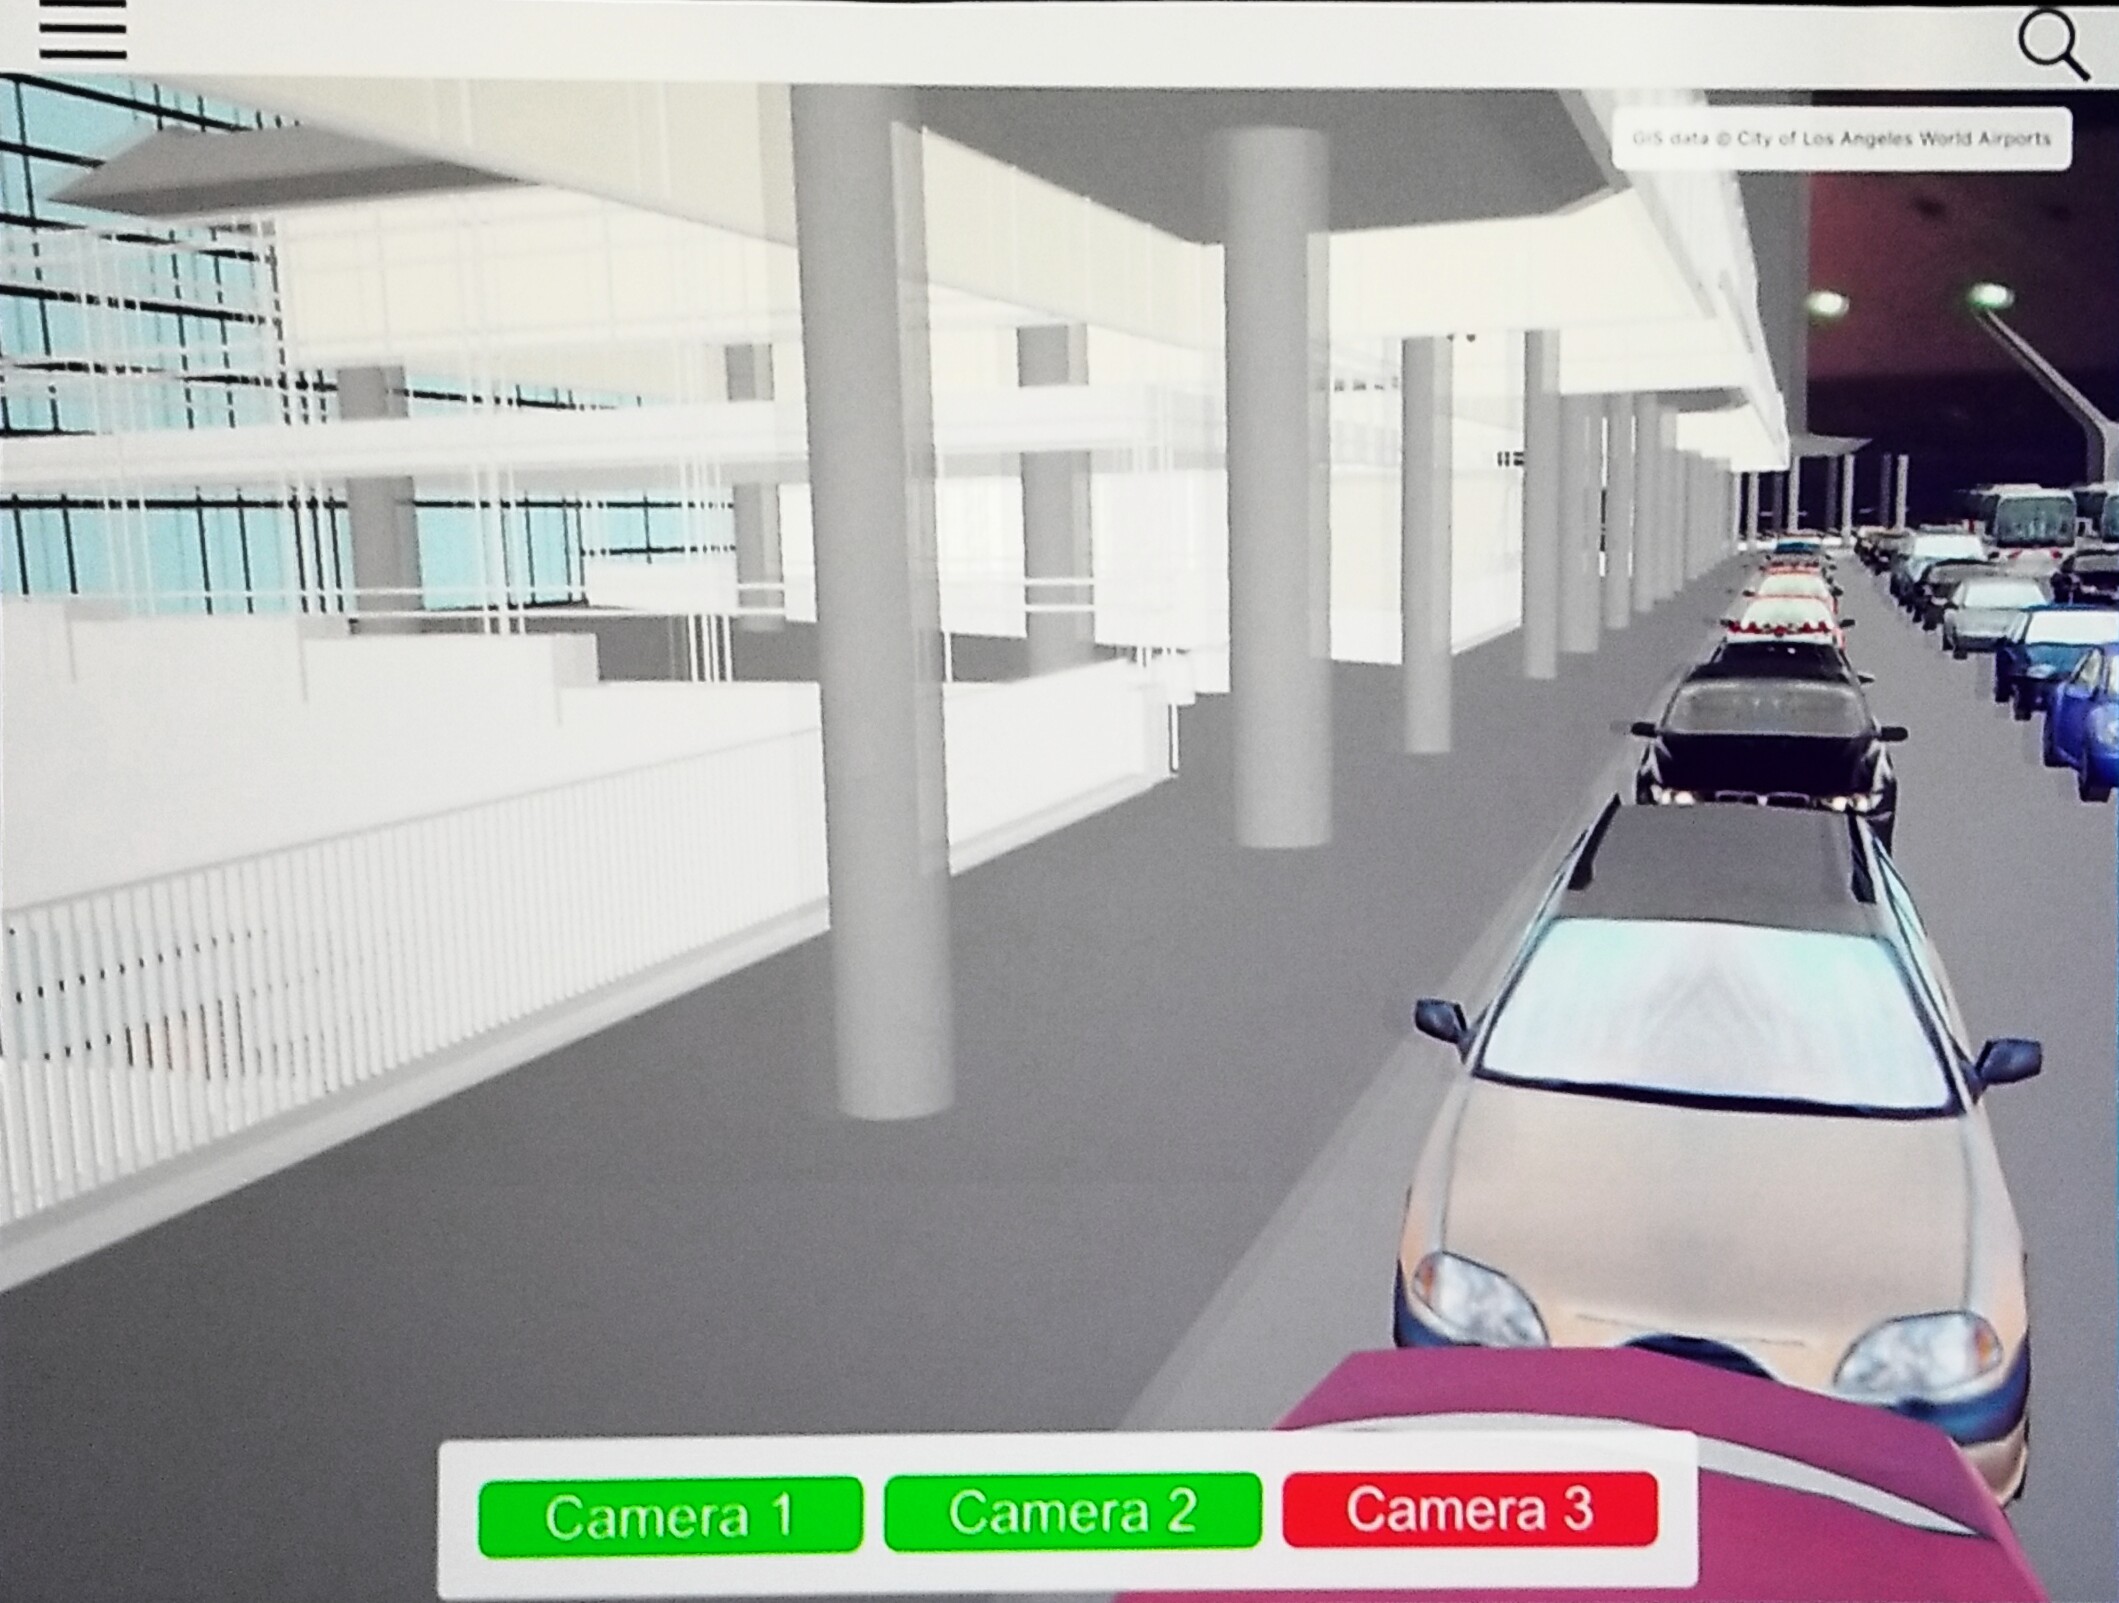
With assistance from Adrien Meriaux, She continues to demonstrate the ArcGIS Runtime AR/VR Beta app on a mobile device. Selecting the orange dot in the map locks the location and a model of LAX pops up. When you move to the mobile device, the map moves with you.

Mobile View of LAX3D Street View
LAX mobile appLAX Street View

The first new native app being released later in 2018 is ArcGIS Indoors. The demonstration of the day-in-the-life of an LAX gate agent, ArcGIS Indoors will bring efficiency to workflows by allowing users to look at facilities maps that include locations, routes, scheduling, detailed information, and help an employee such as our LAX gate agent to better plan the day and create reports as assignments are completed. 


With assistance from Adrien Meriaux, She continues to demonstrate the ArcGIS Runtime AR/VR Beta app on a mobile device. Selecting the orange dot in the map locks the location and a model of LAX pops up. When you move to the mobile device, the map moves with you.

“Navigating this 3D environment in AR is easy & natural.” ~ Madeline Schueren

12:03 a.m. - U-Spatial—Advancing Spatial Science and the Workforce of Tomorrow

Company: University of Minnesota (UMN)

Speakers: Len Kne, Coleman Shepard, Kevin Erhman-Solberg, Somayeh Dodge, and Tom Fisher


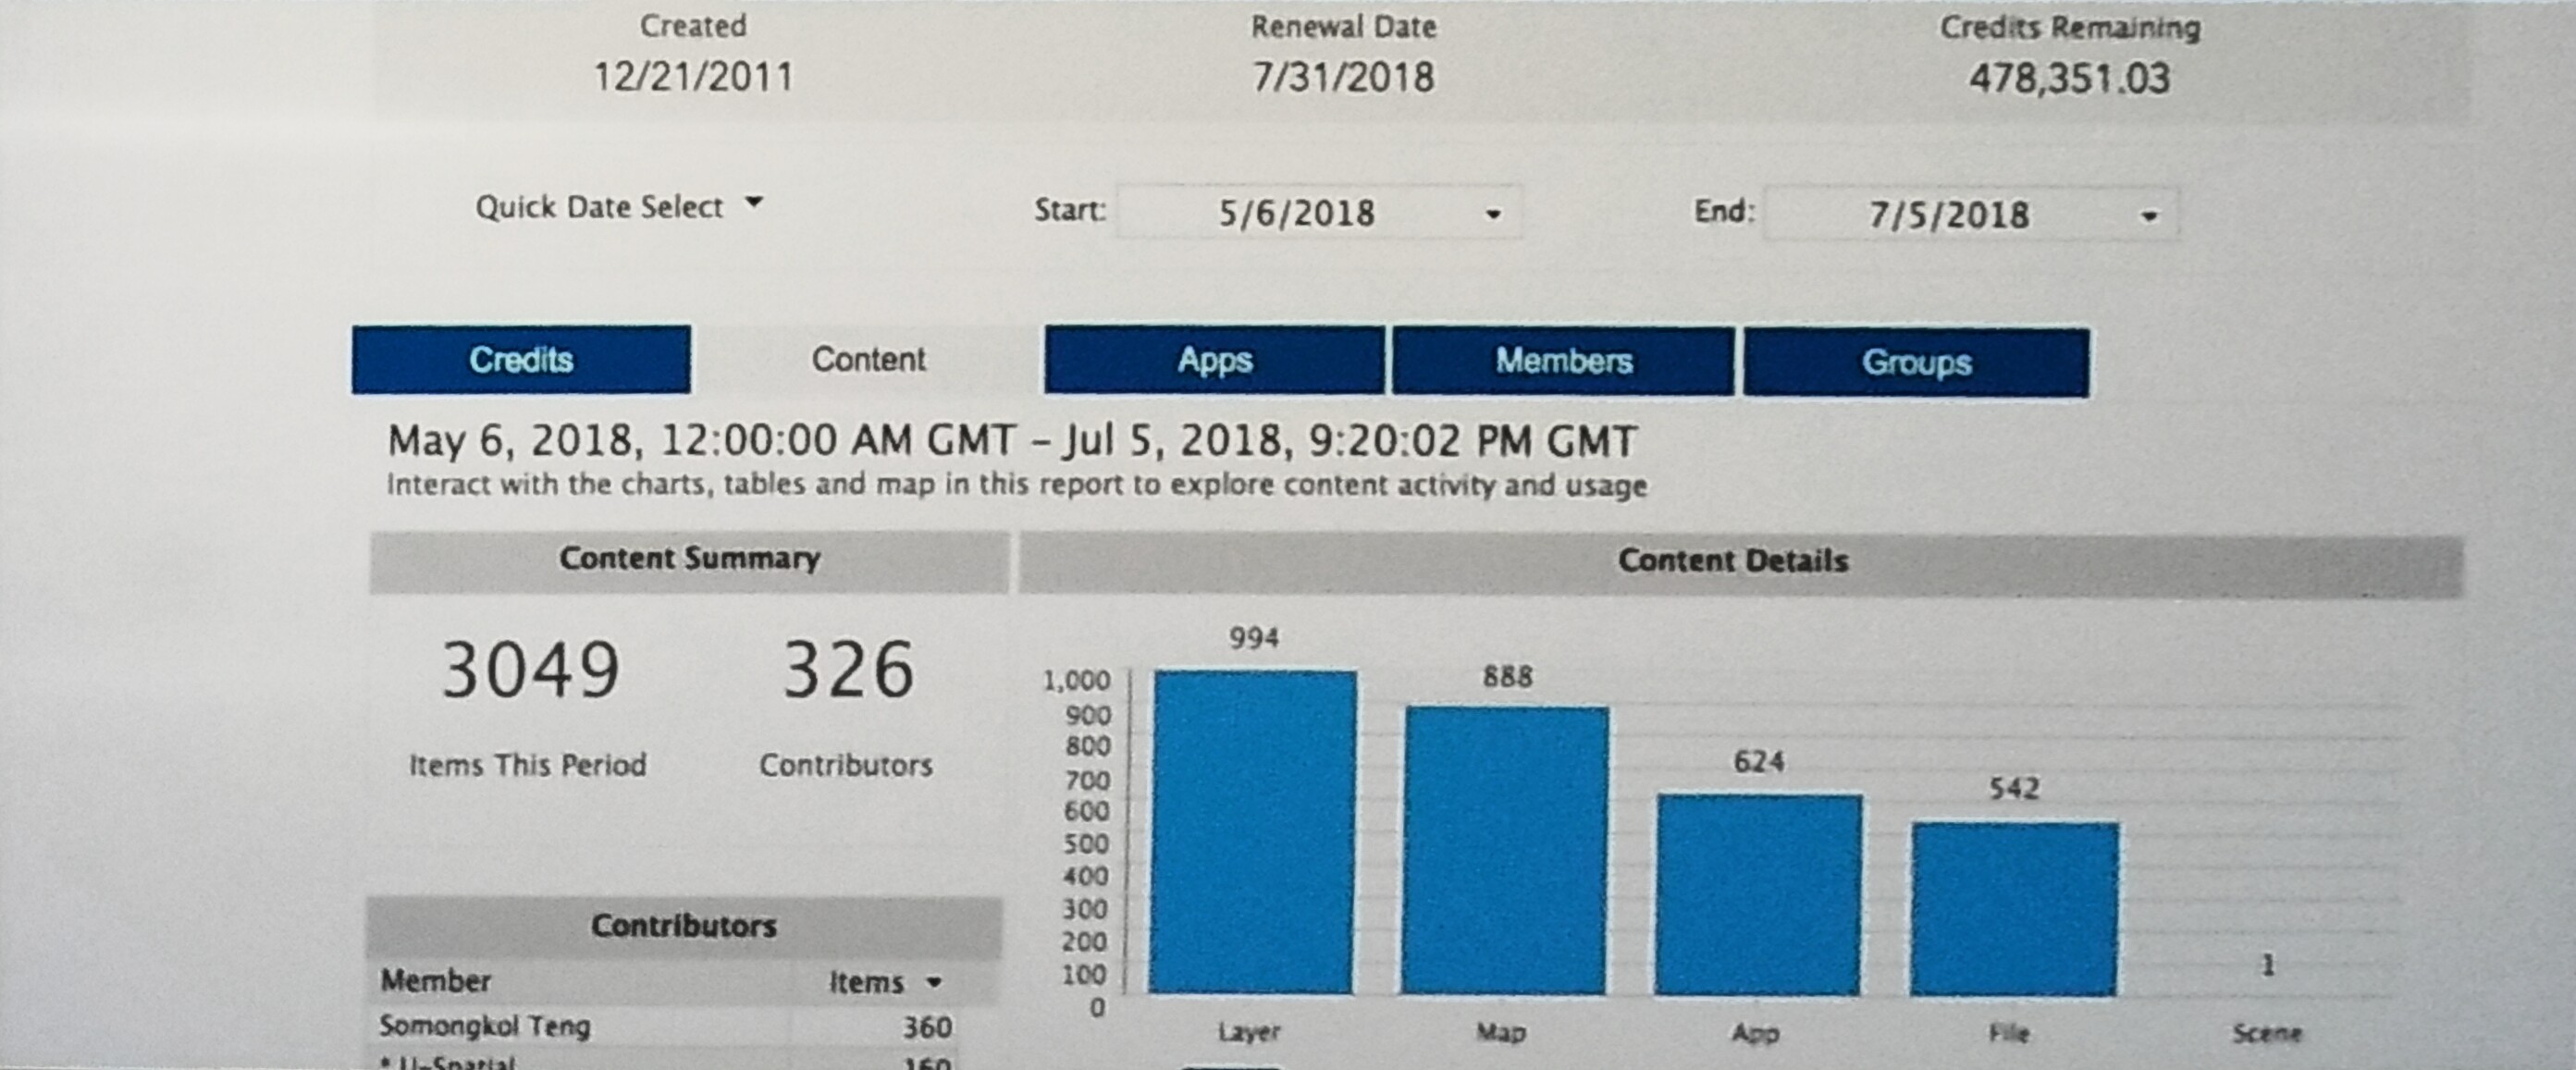
Len Kne opens with, “We are a spatial university,” and a map showing where GIS is located on the University of Minnesota campus. The entire campus uses GIS and often through ArcGIS Online for a variety of reasons, all focused on accomplishing the university’s mission: teaching, research, and outreach. Len continues to explain how the Enterprise GIS department supports the campus infrastructure for public safety, land care, building maintenance, and construction. The University now has 6,300 students, faculty and staff with named user account on ArcGIS Online. 
Student license at UMN


In collaboration with The Ohio State University Byrd Polar & Climate Research Center, they plan to release a new DEM at 8 m spatial resolution that will be free and open to the public.

The charge for U-Spatial and everyone in higher education is to:

  • Develop the GIS workforce of tomorrow,
  • Ensure that everyone in the workforce is thinking spatially, and
  • Advance the spatial sciences.

The future generation of GIS professionals will continue expanding these skill sets, as they maximize

creative problem-solving skills.


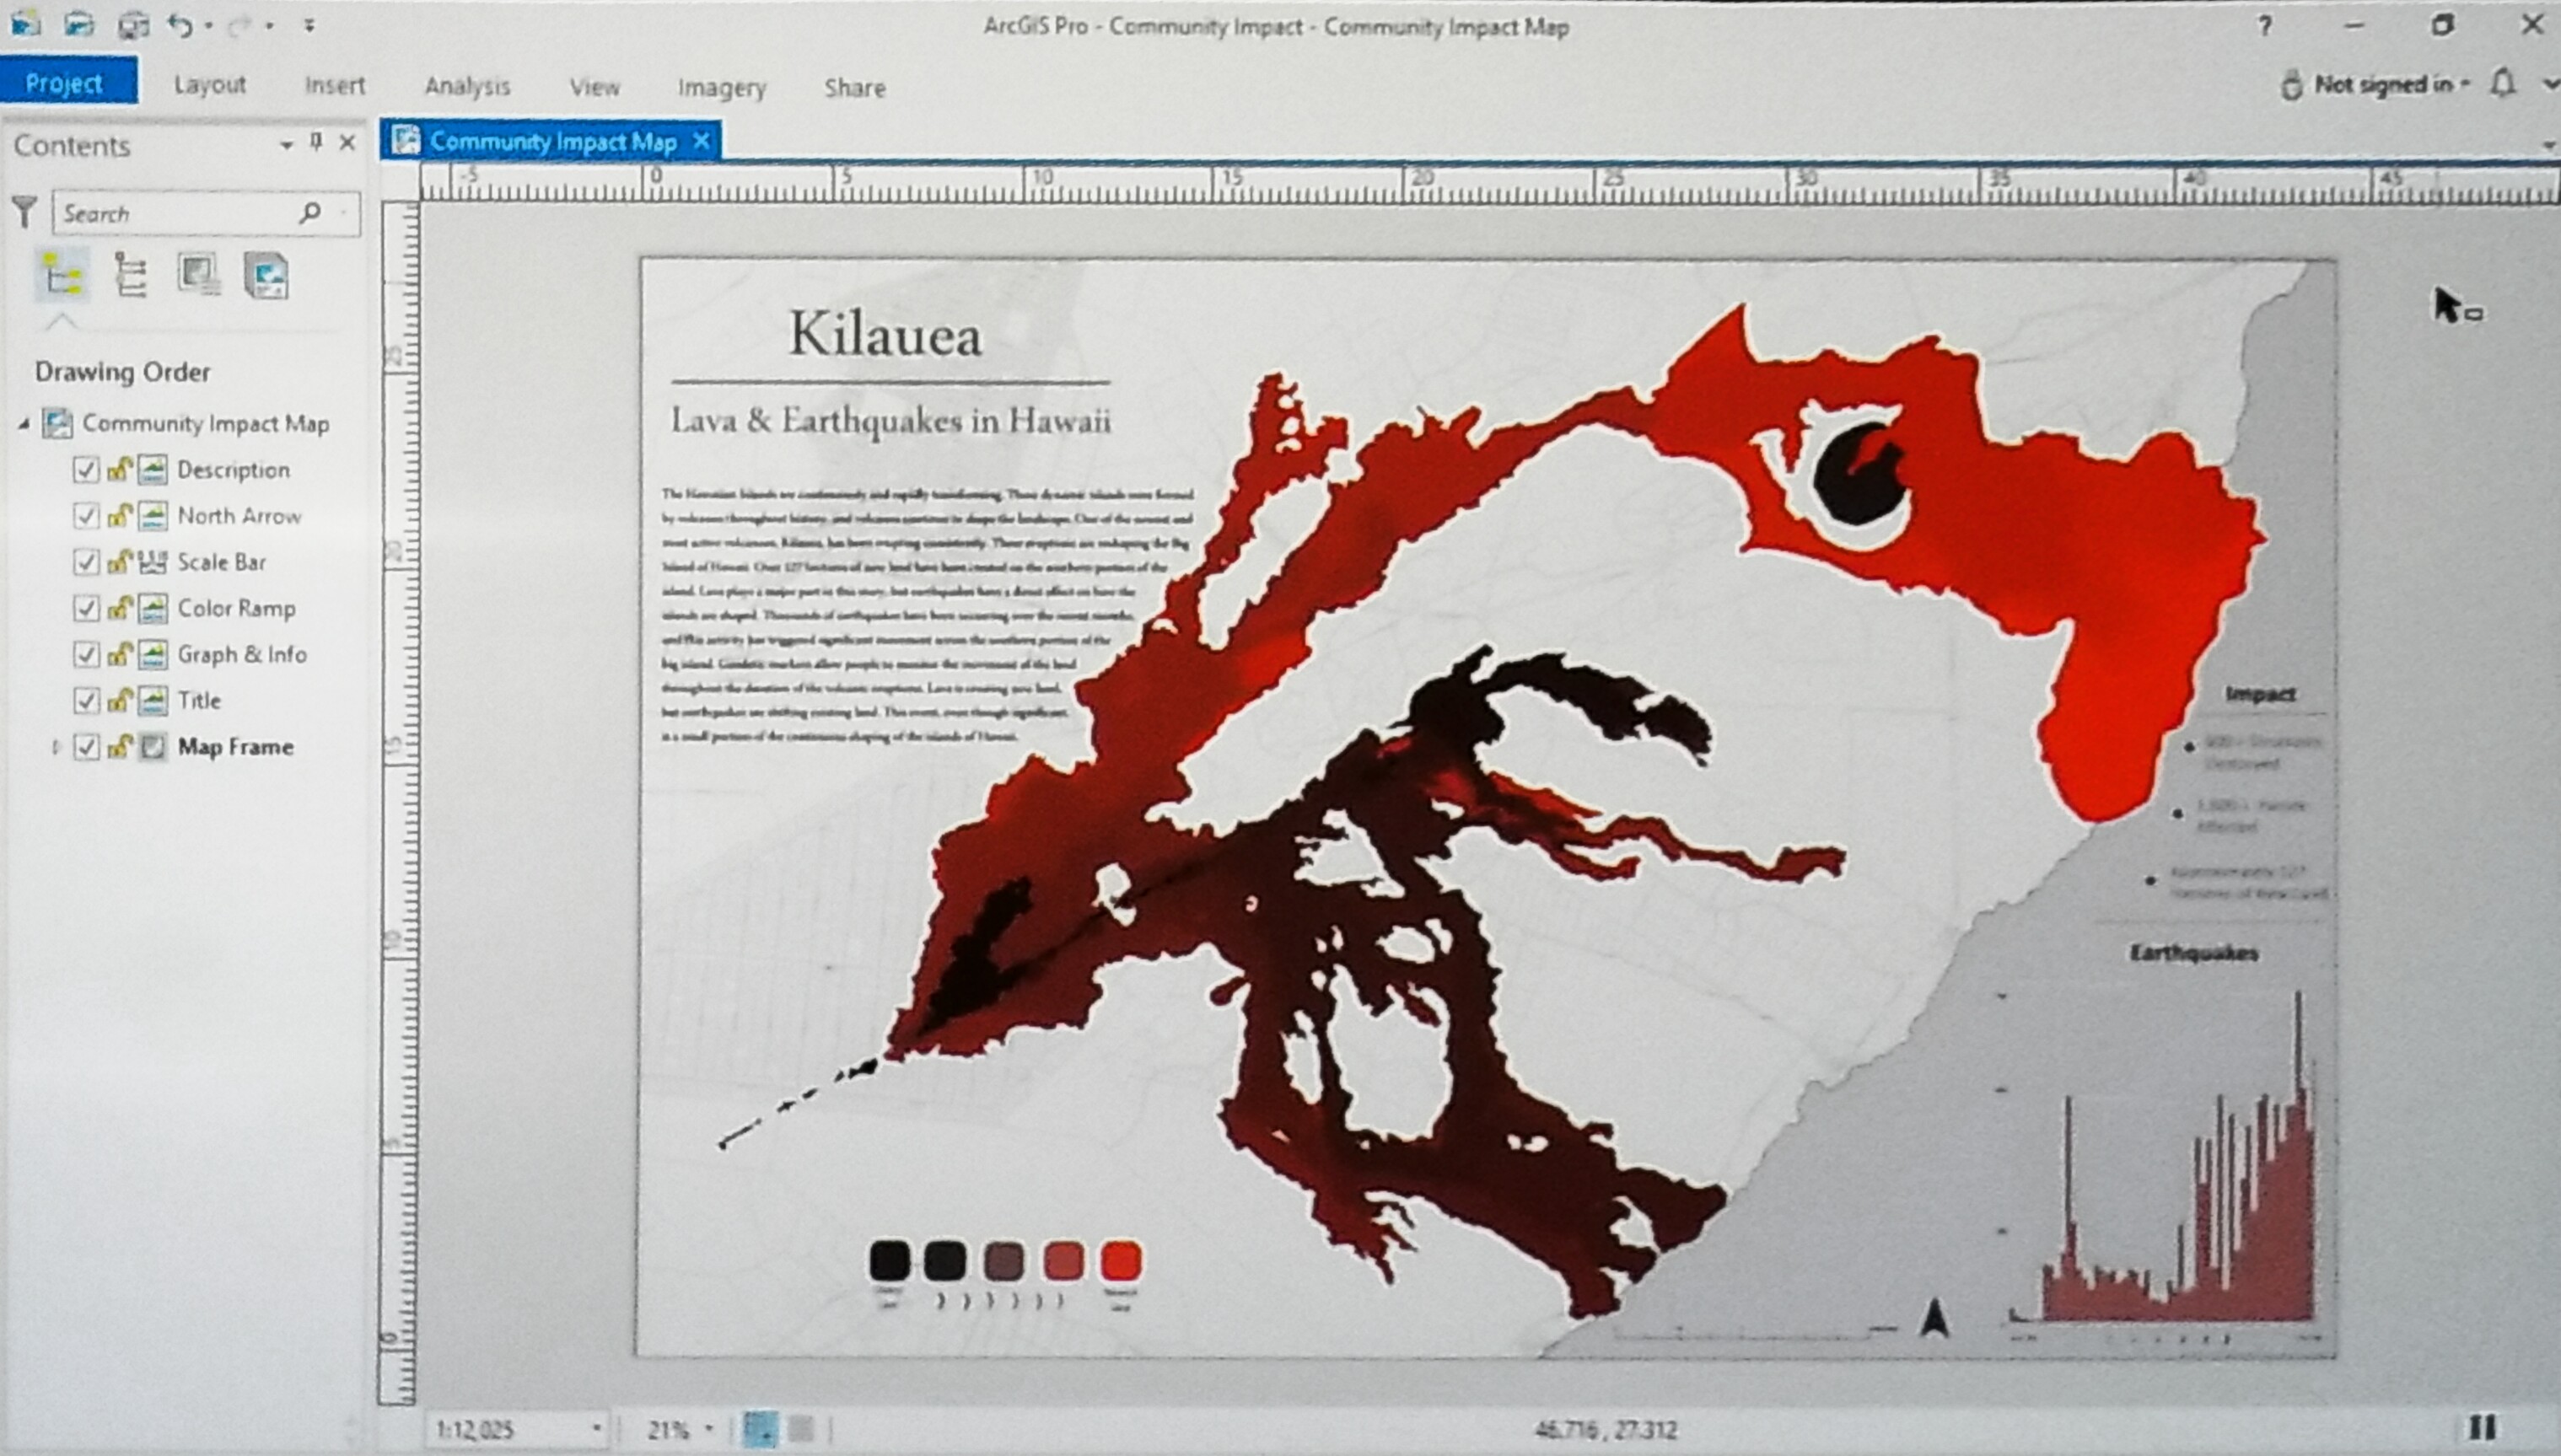
Len introduces Coleman Shepard and his current project to gain a deeper understanding of the activity happening right now with the eruption of Kilauea.


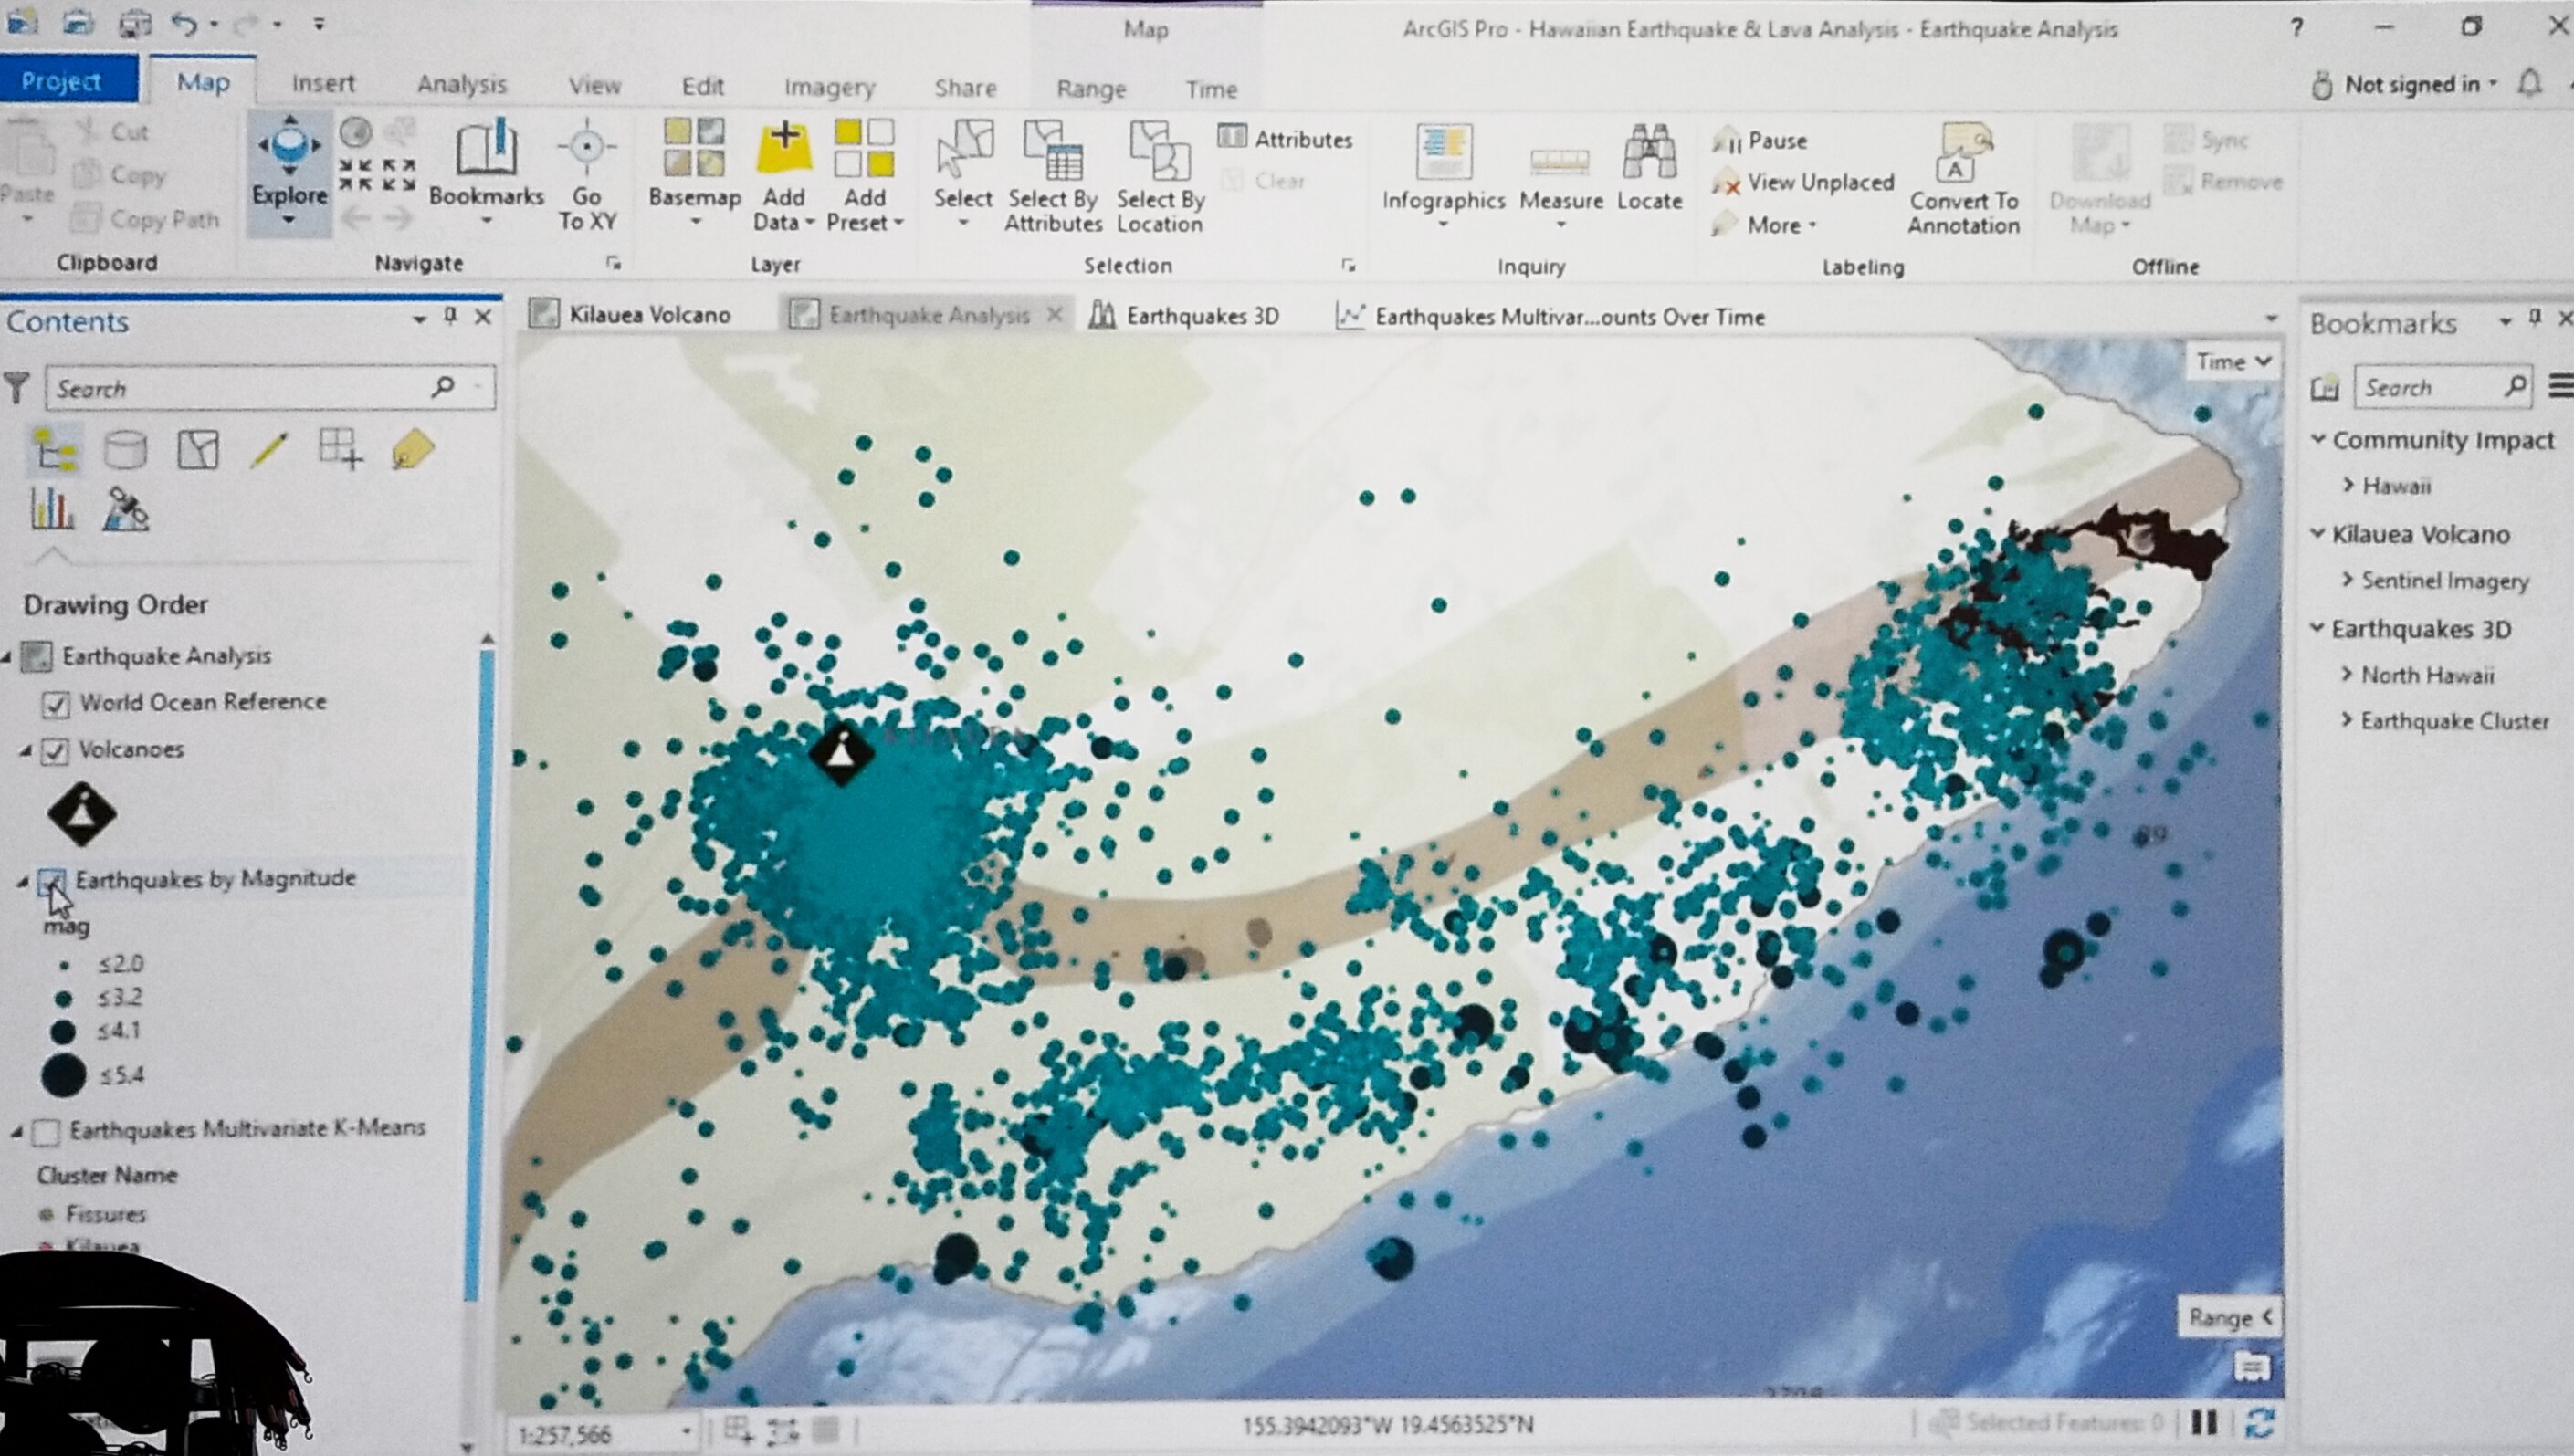
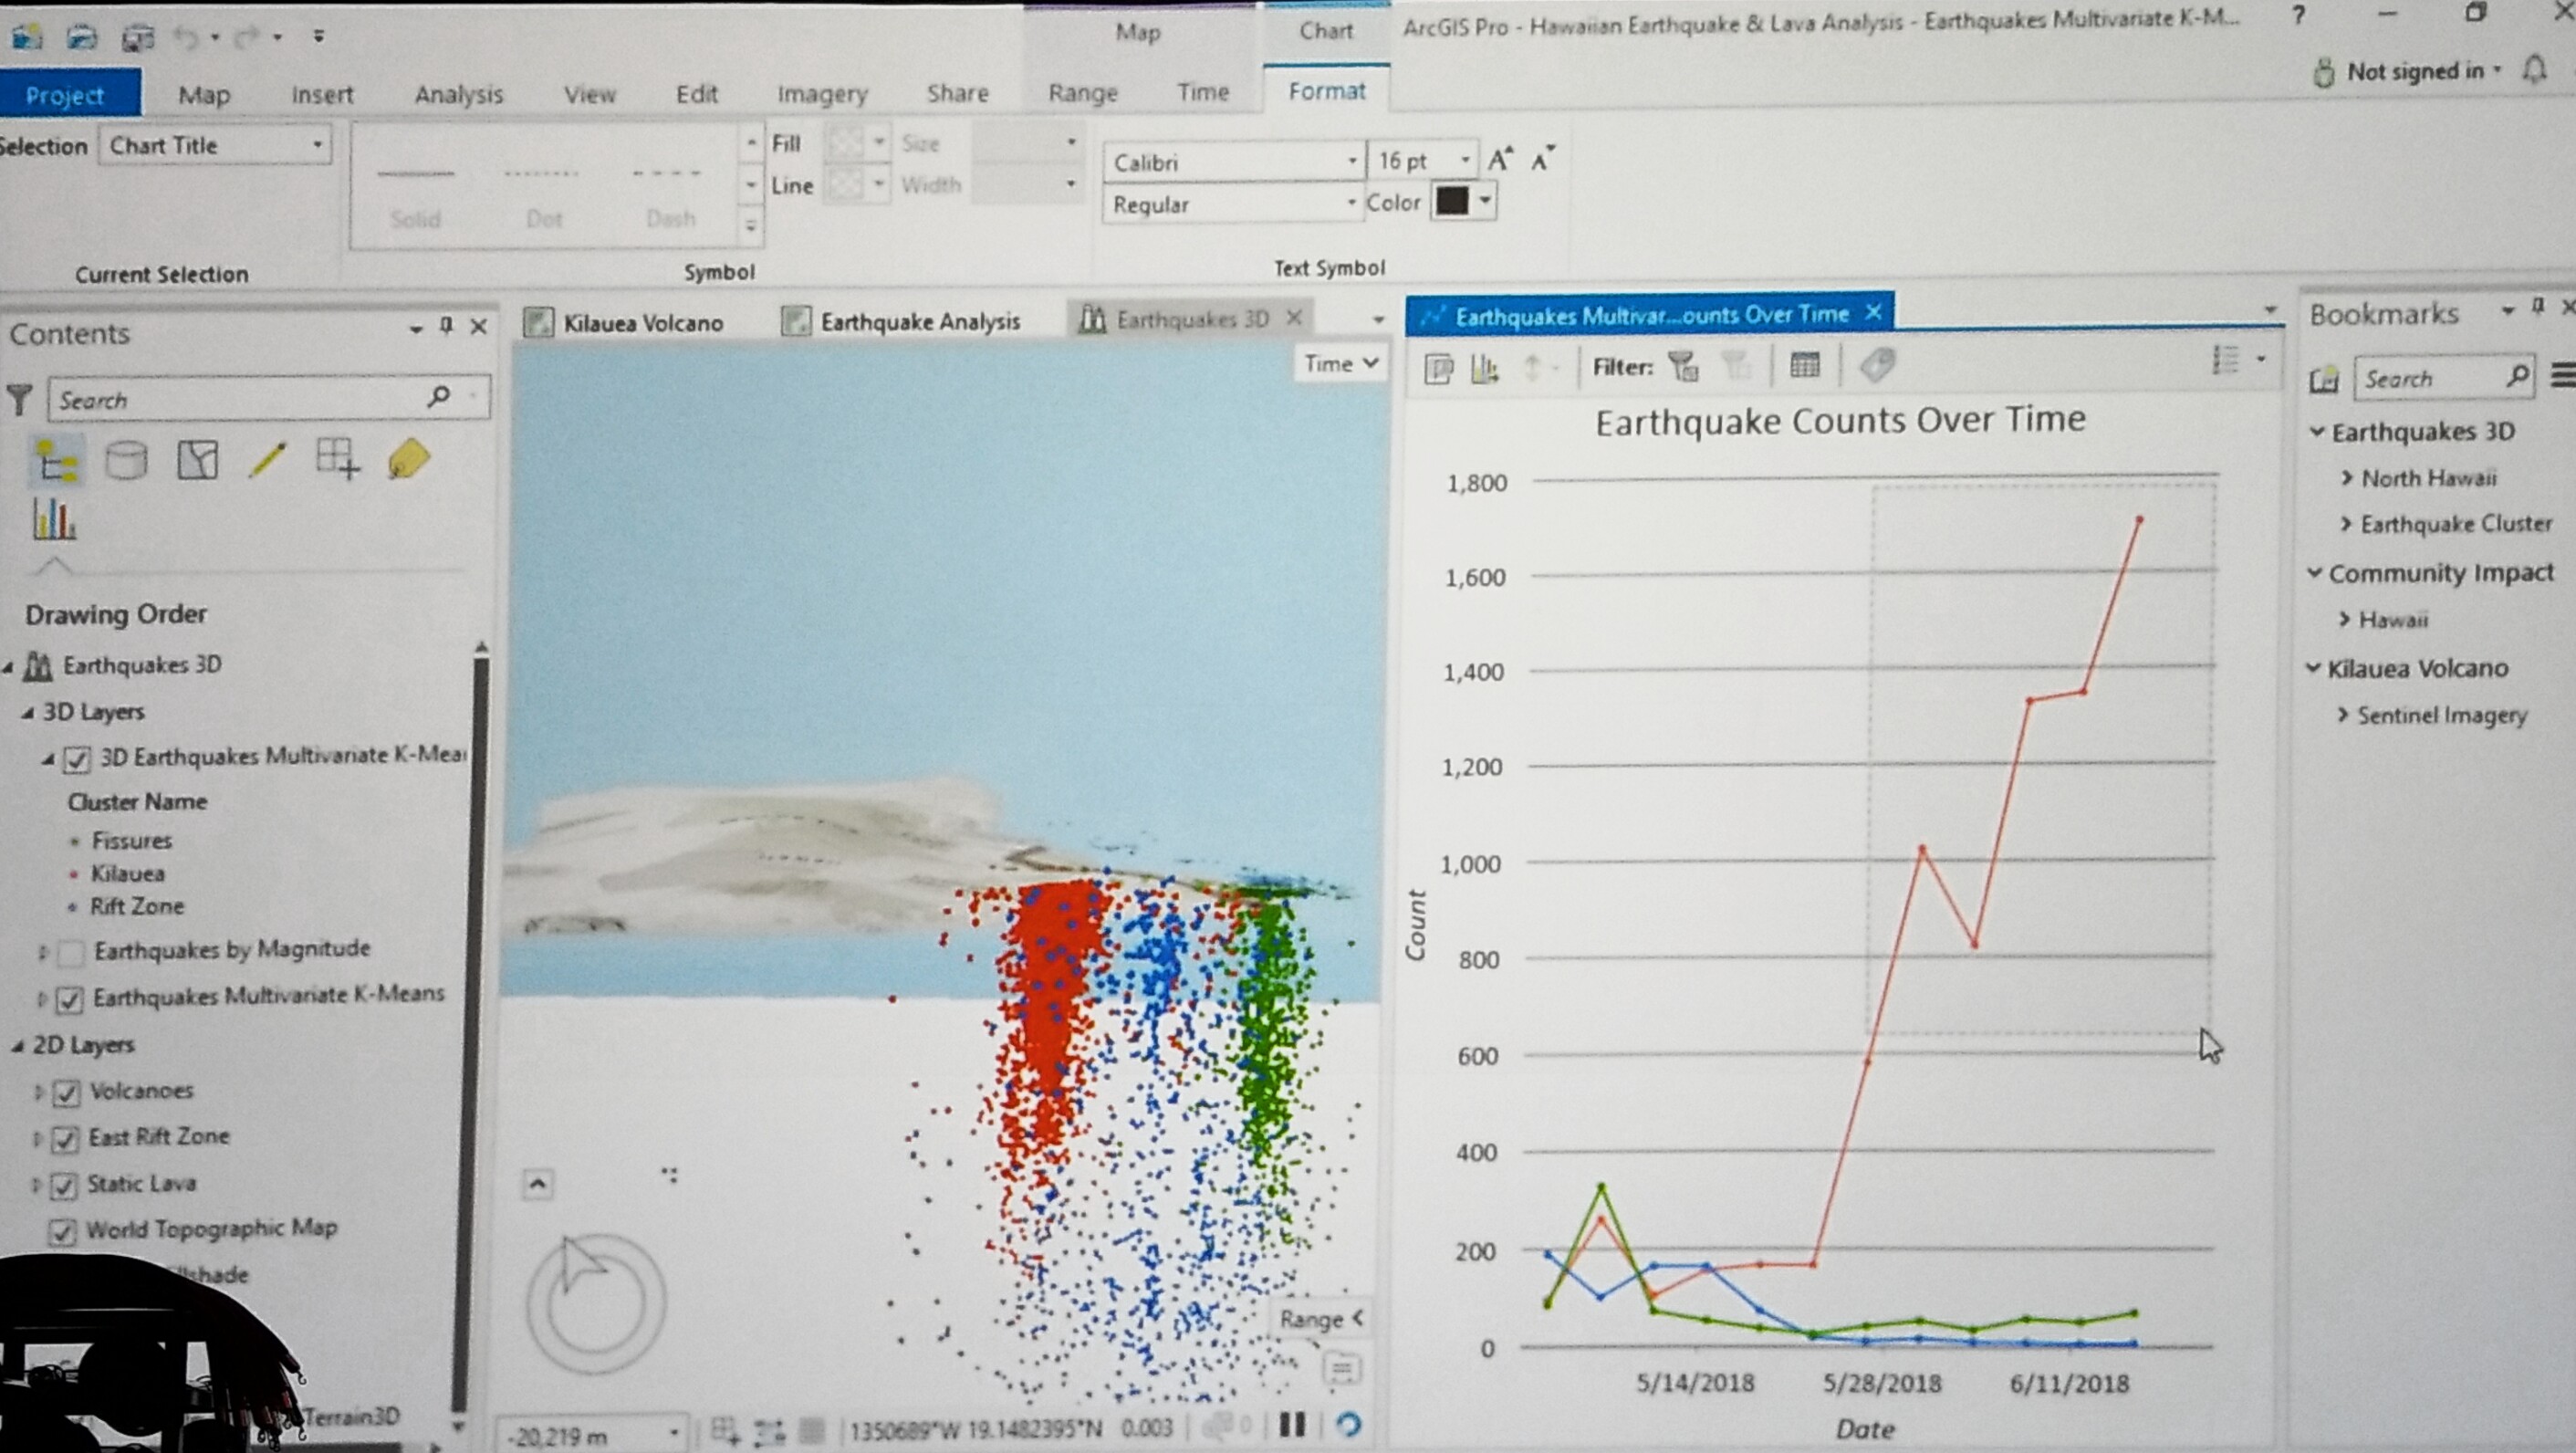
Coleman demonstrates the use of ArcGIS Pro 2D for earthquake analysis. More than 16,000 earthquakes have rumbled Kilauea since the start of the eruption. He conducted multi-variate clustering using K-means to cluster the earthquakes based on 4-dimensions revealing three distinct clusters representing zones of Kilauea.


Using ArcGIS 3D capabilities Coleman visualizes the depth of the seismic activity by cluster and over time was able to see the number of earthquakes near the volcano continuing to increase.

Kilaeua clustersKilaeua earthquake clusters
Kilaeua earthquake clusters 3D below surfaceKilaeua earthquake clusters collapse


He wanted to know more so he extracted publicly available data of geodetic stations to measure the displacement of geodetic markers over time using Python in Jupyter Notebook. He was able to indicate the eventual collapse of the crater.


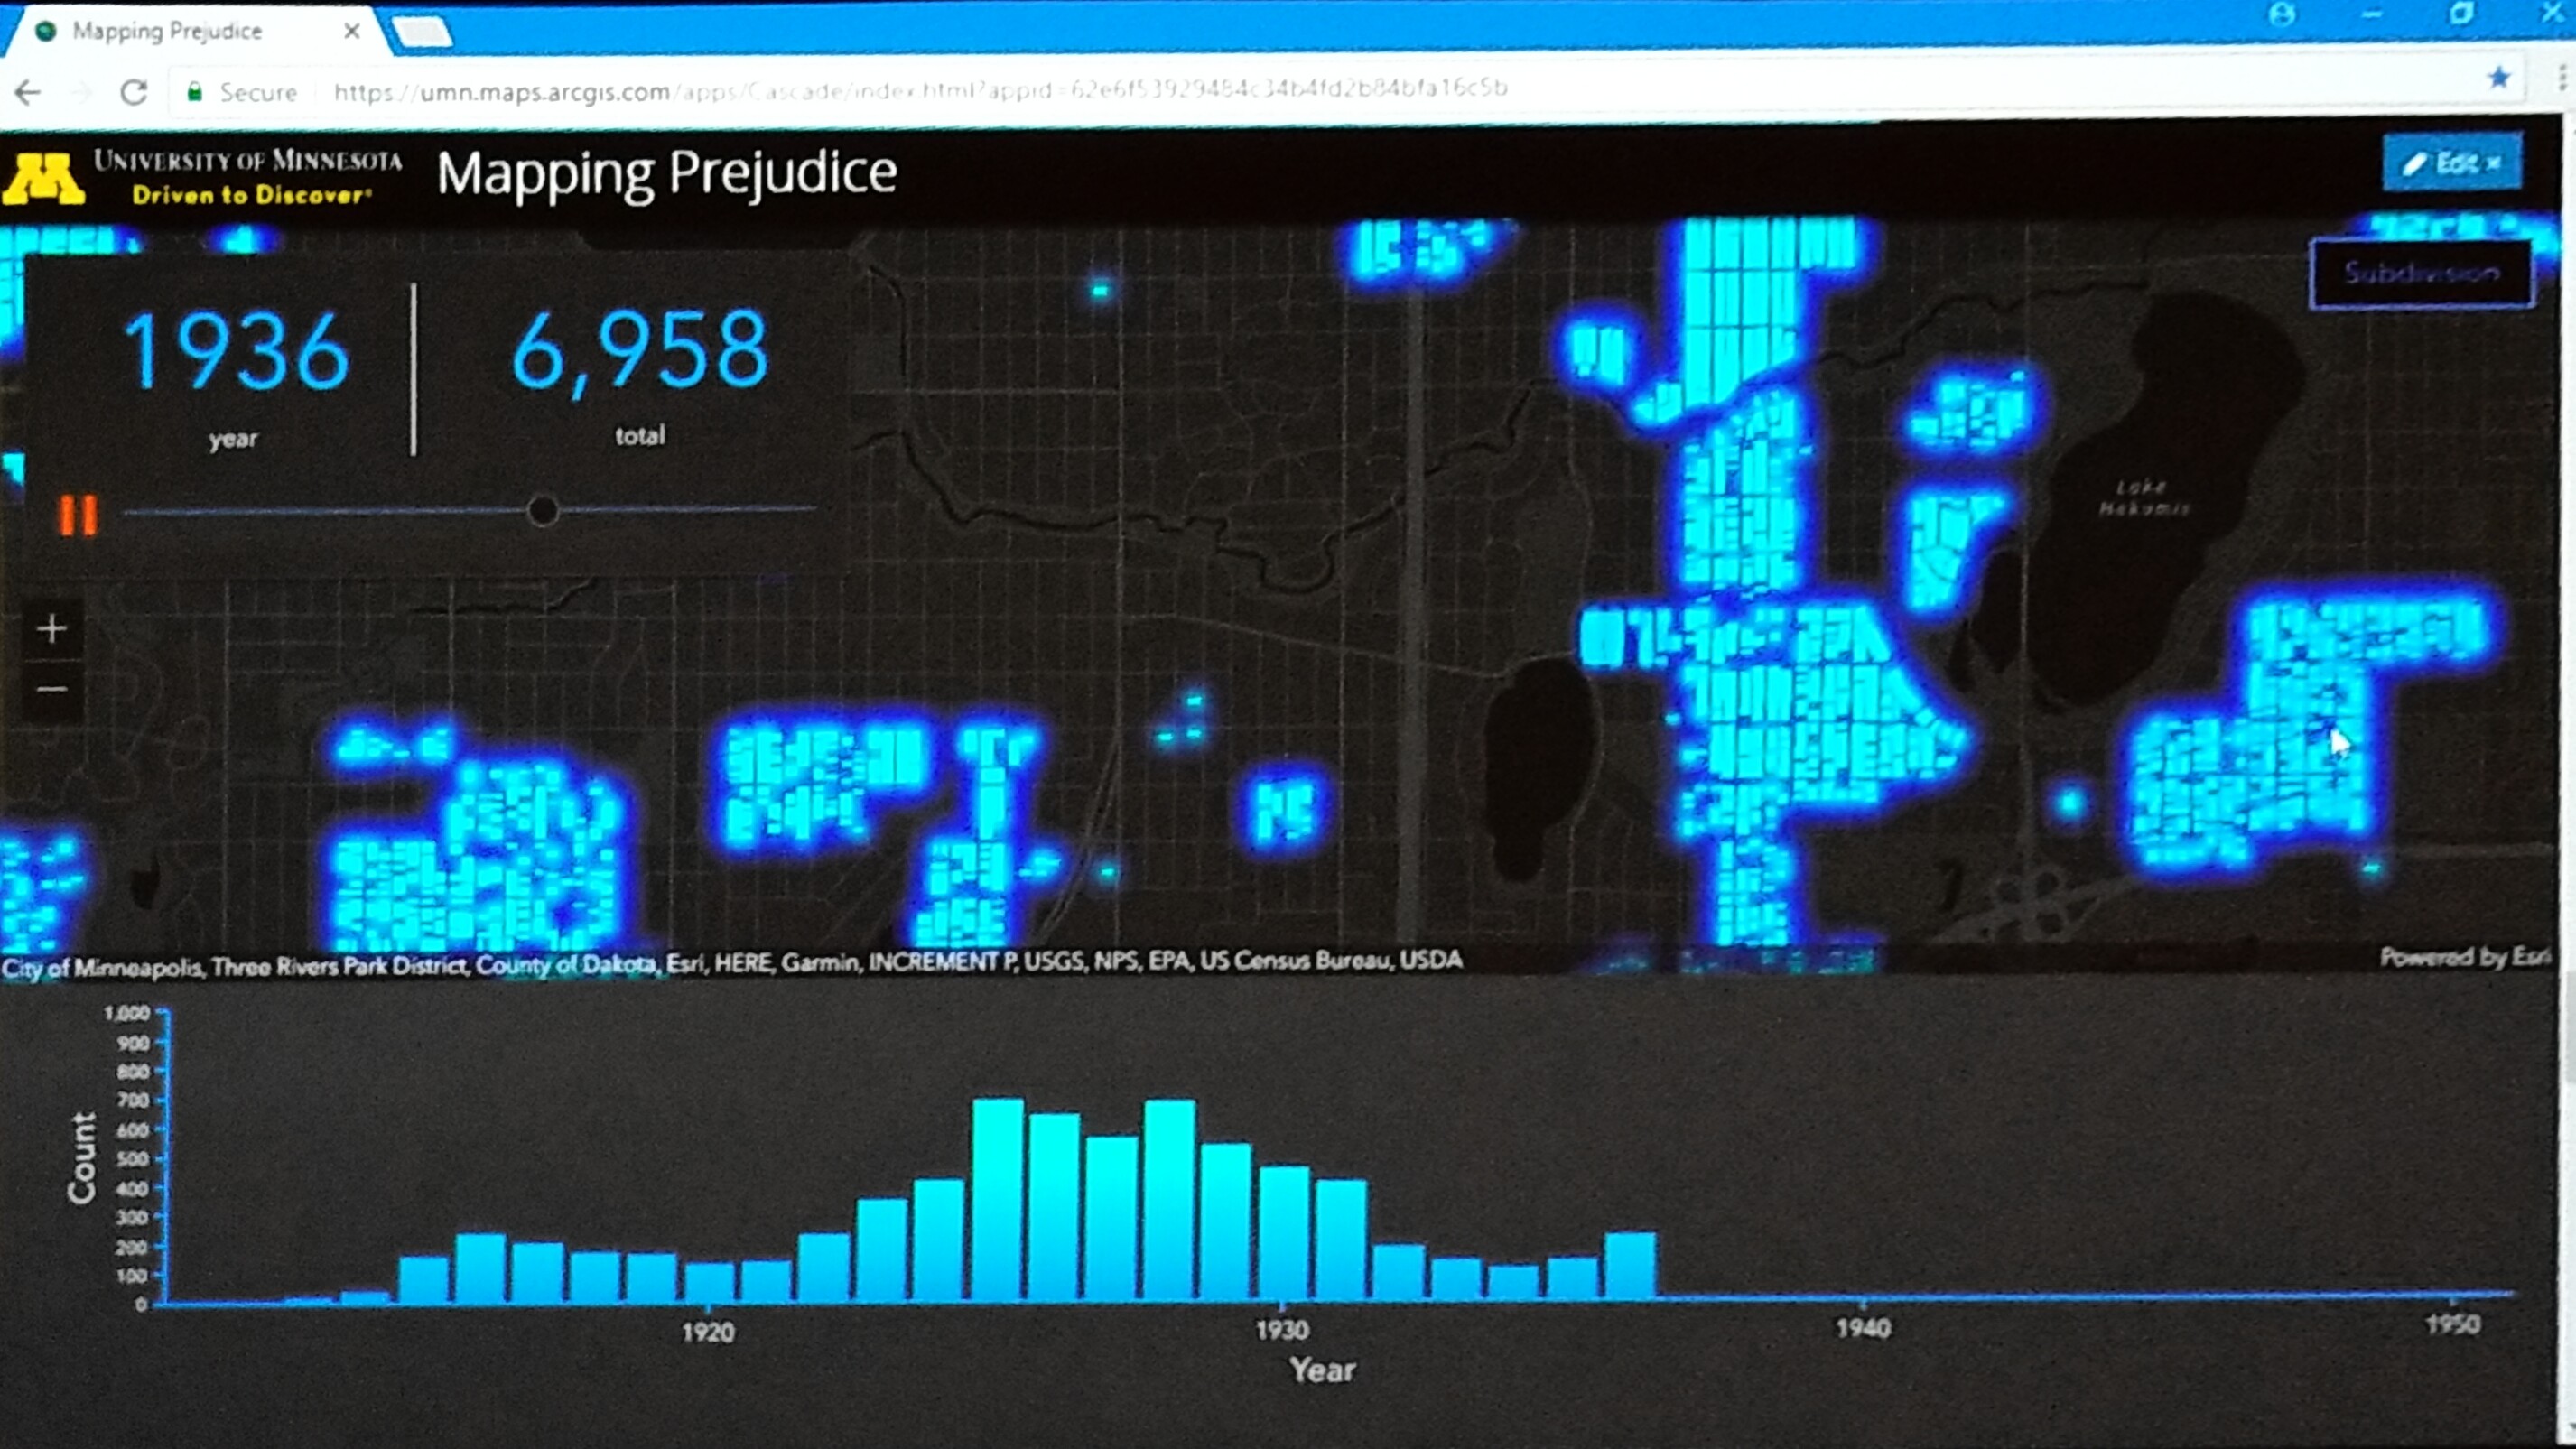
Coleman introduces Kevin Ehrman-Solberg, Ph. D. student in the Geography, Environment and Society department at the University of Minnesota. He is also the co-founder of the Mapping Prejudice Project creating a spatial database of racial covenants in Hennepin County.

Kevin explains the meaning behind the racial covenants as lines of text in warranty deeds for real estate. Using OCR to translate historic property records into searchable text documents, they can parse the text files using Python to flag deeds containing racial language.
 Mapping Prejudice

The flagged documents are then uploaded to Zooniverse to enter the attribute information necessary to build the map. This information is exported to JSON and joined with a spatial layer in ArcGIS Pro flagging over 30,000 deeds and mapping more than 15,000. The blue dots denote a property parcel in Hennepin County exclusively reserved for “white” Americans.


With historical census data and these maps, they can see the racial segregation of real estate in the Minneapolis area. These maps powerfully demonstrate how GIS can change our understanding of the world we live in.
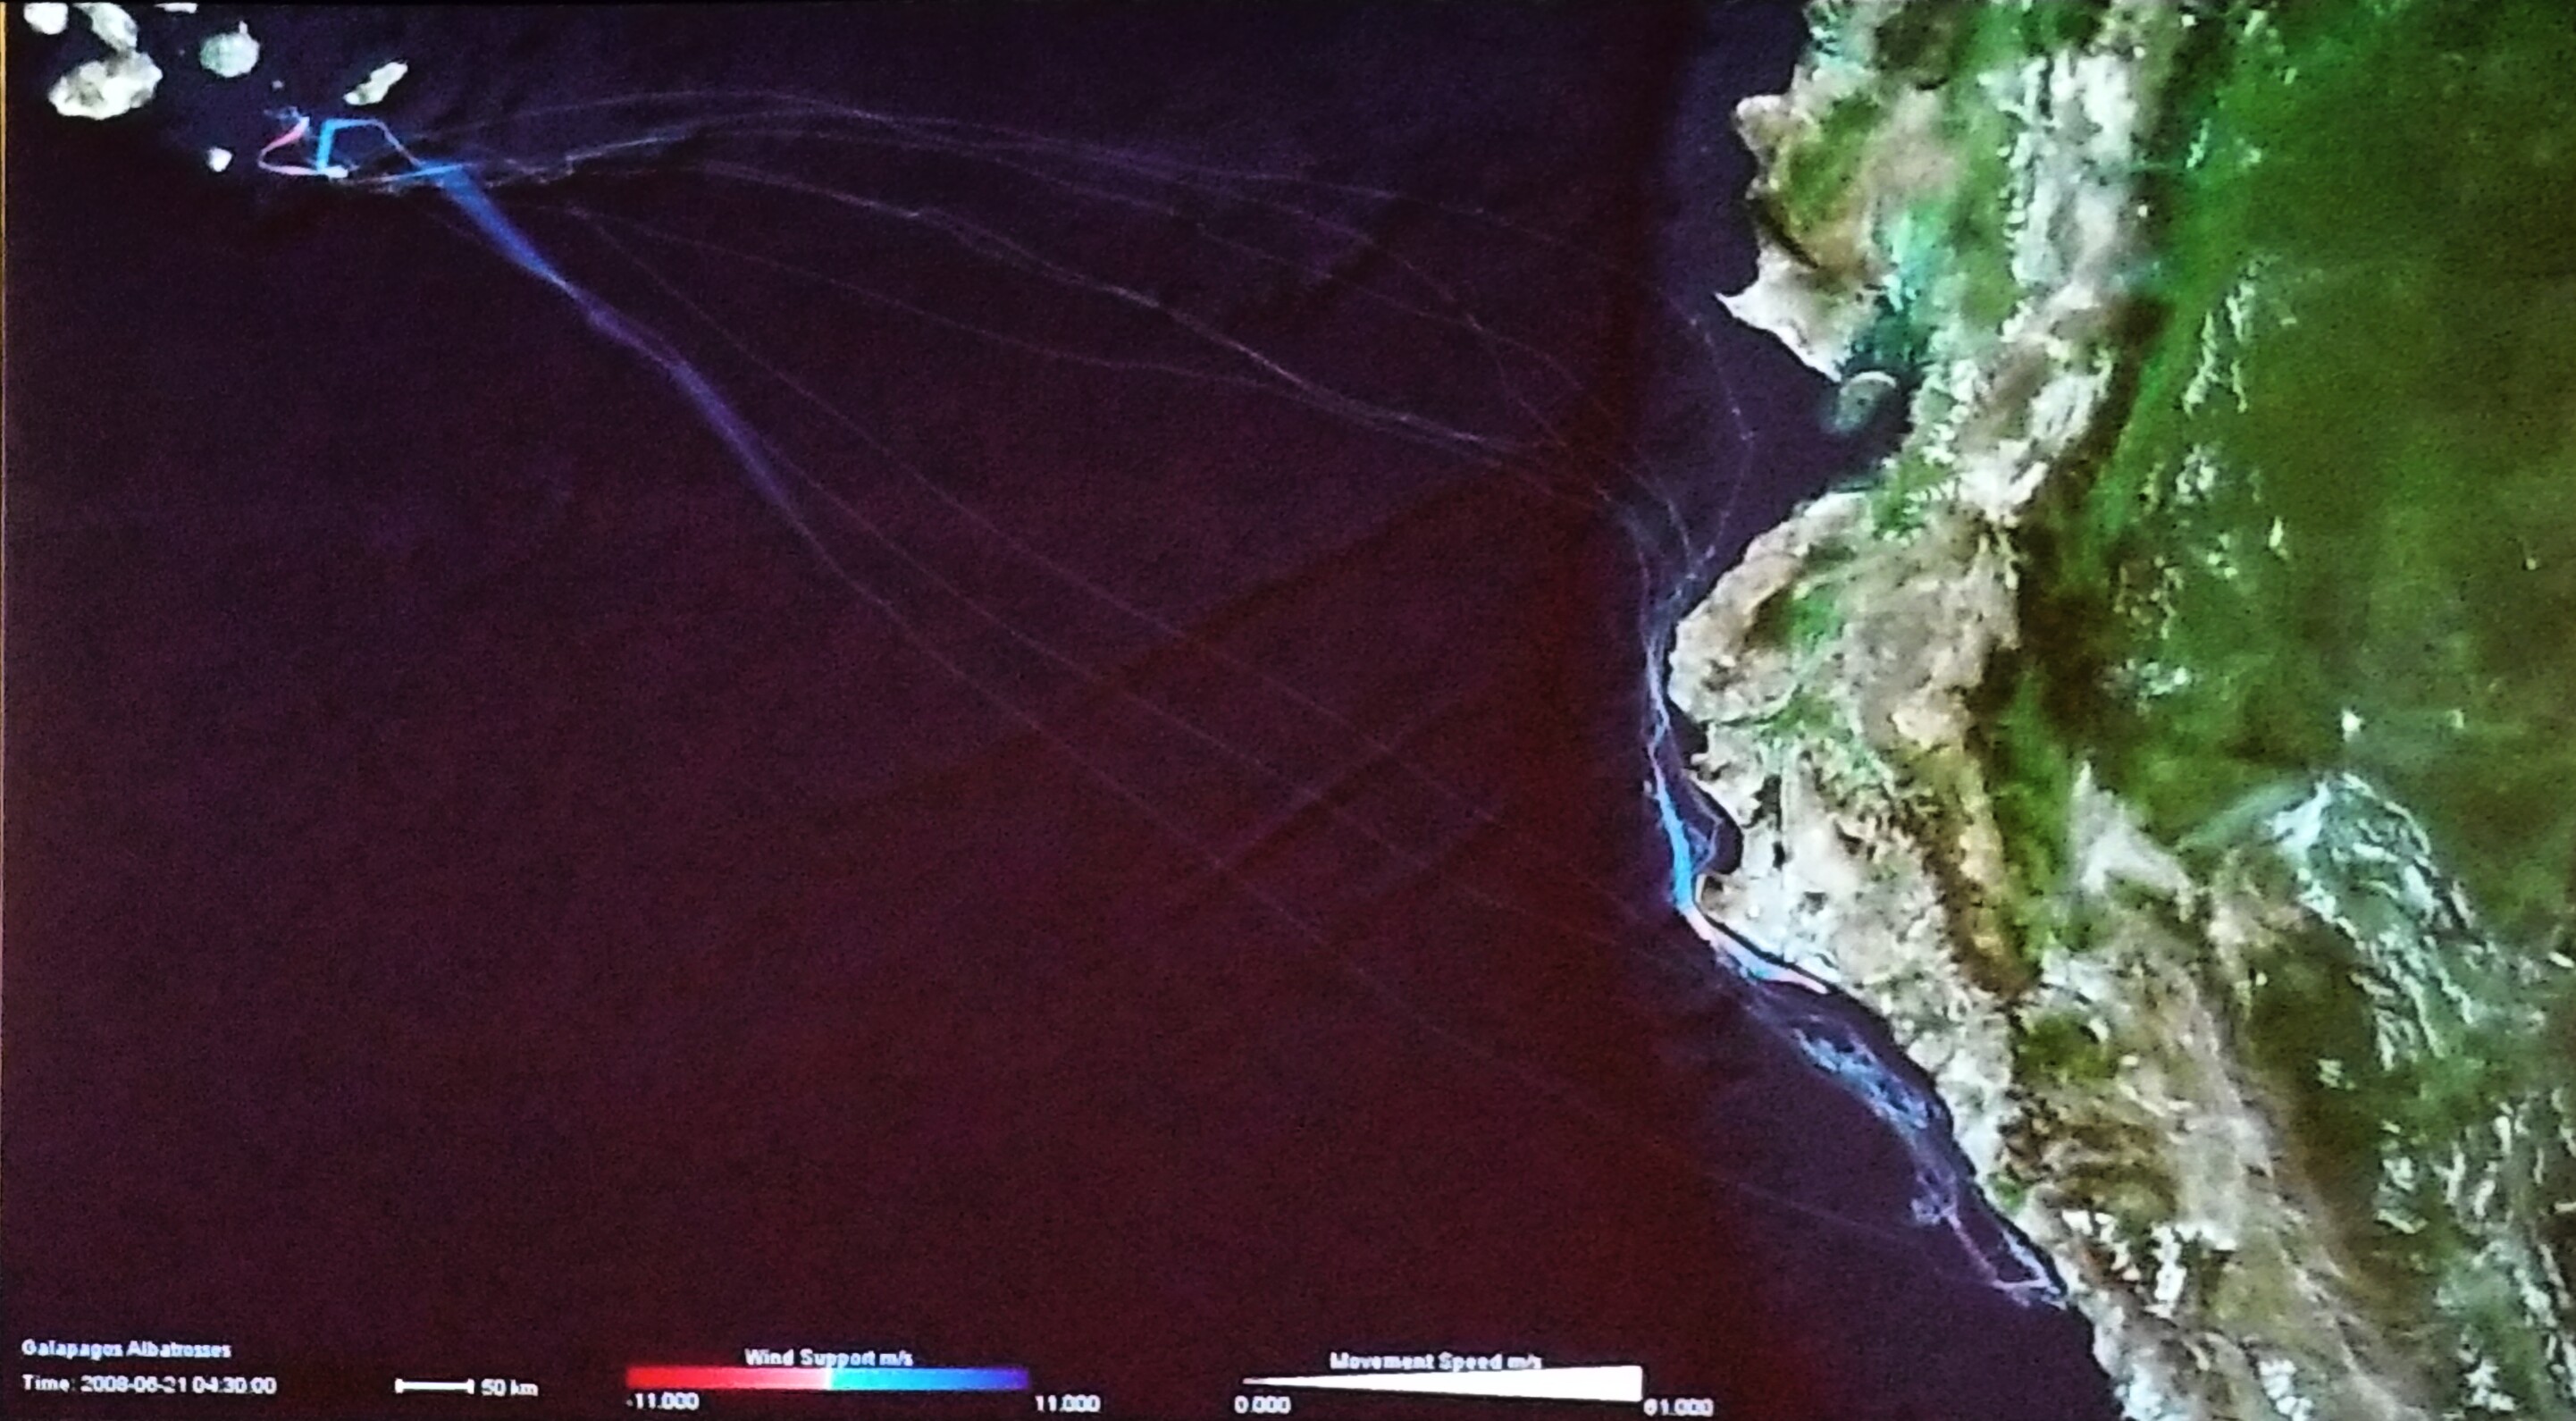
 

University of Minnesota - Albatross patternsFollowing Kevin’s presentation, Somayeh introduces the study of movement (human and animal movement) predicting changes in the behavior of individuals in natural and human systems.

Somayeh tells how UMN is using GPS enabled data tracking to track the migratory behavior of the albatross and how the albatross use the wind patterns and chlorophyll concentrations to know exactly where the ocean productivity is highest near Peru.  Maps in Motion help scientists to better understand and develop the hypothesis of tiger behaviors.
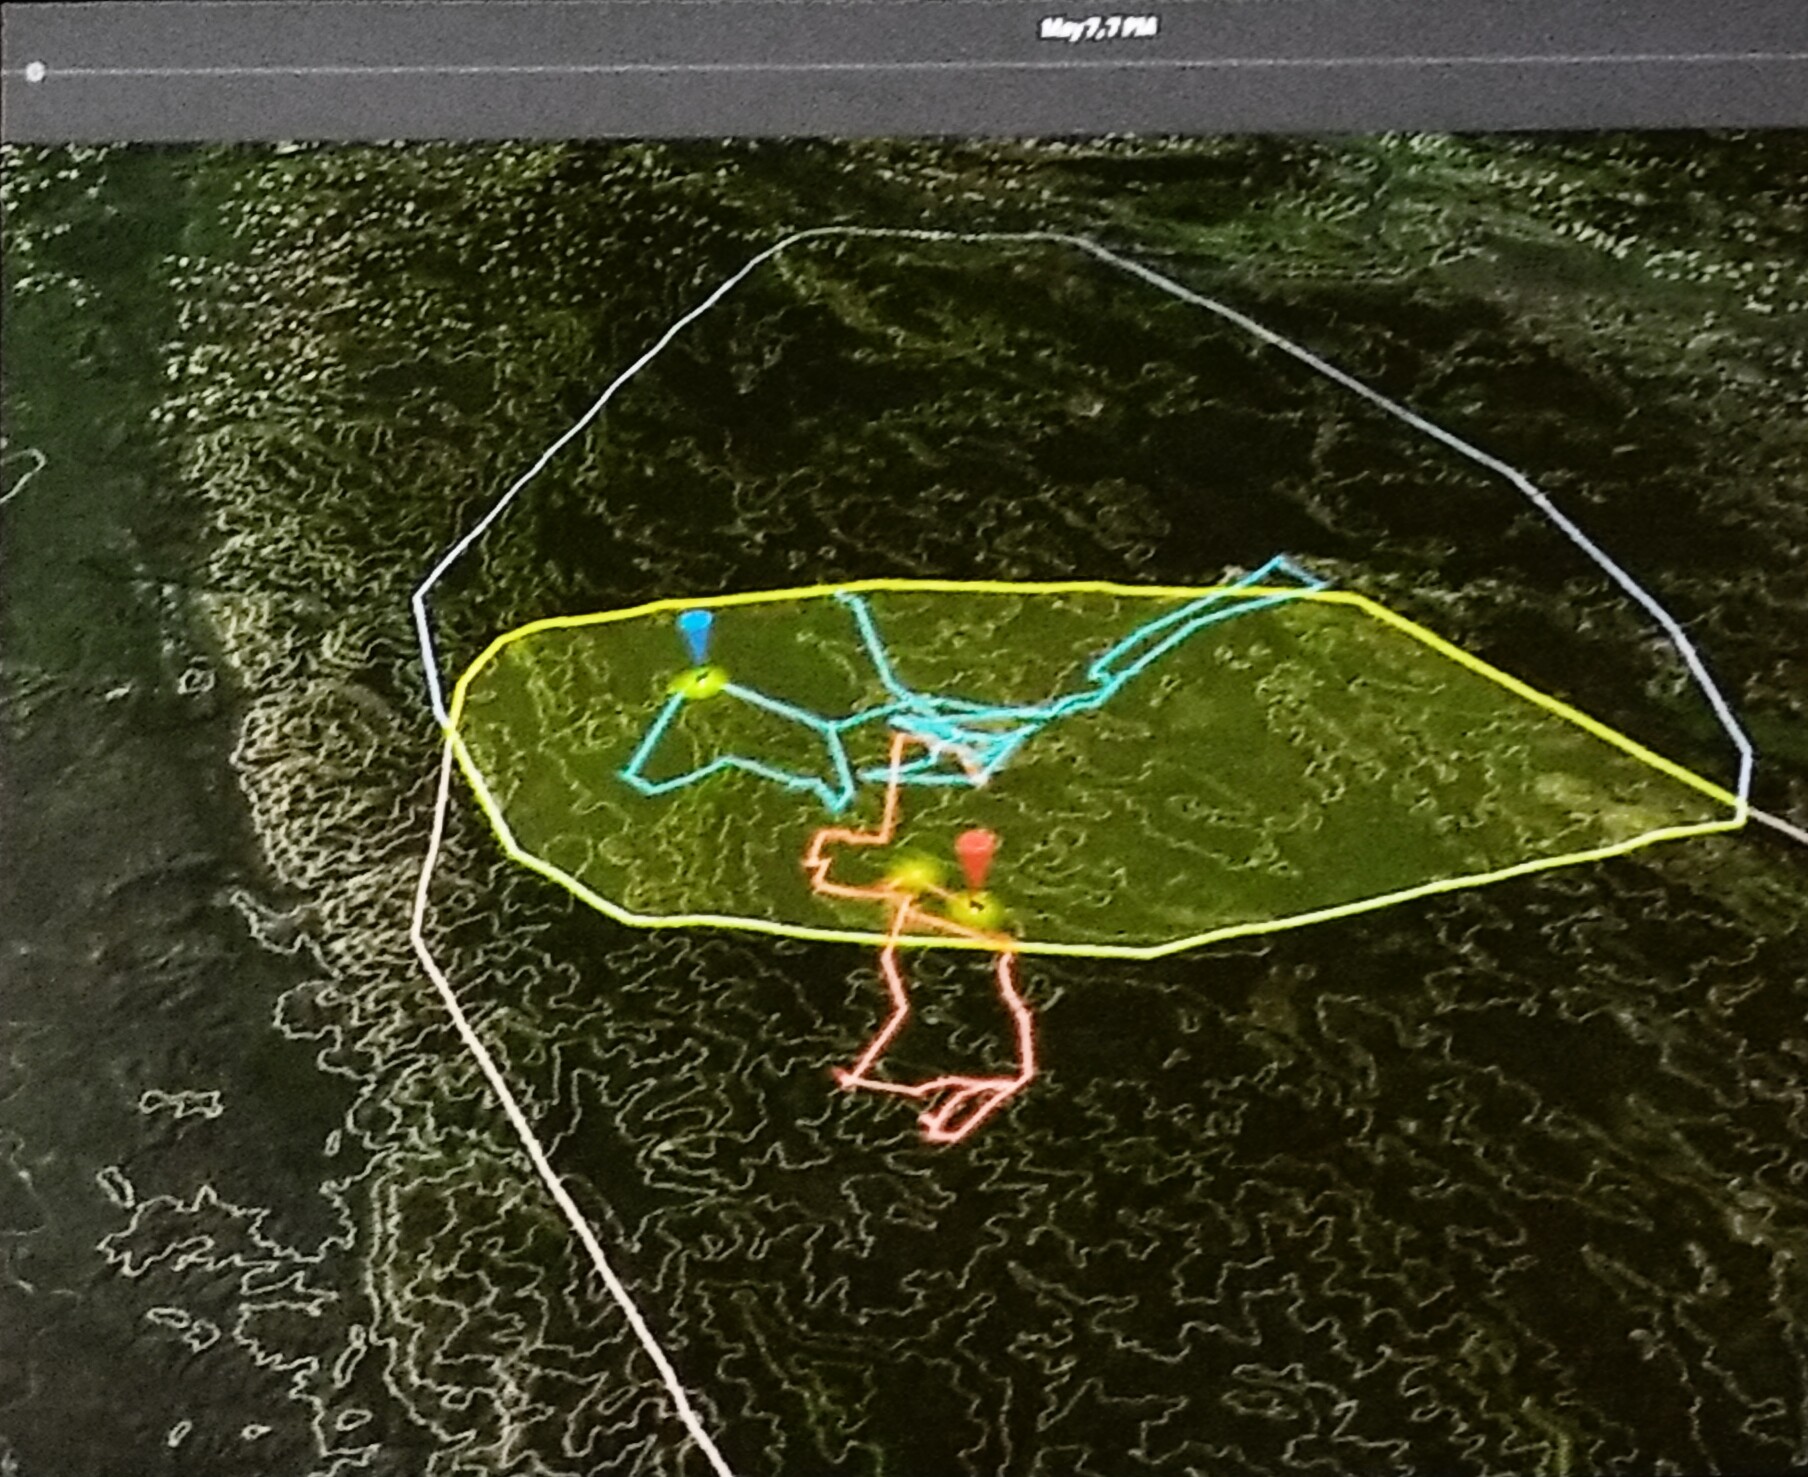
University of Minnesota - Tiger patterns

"By advancing our knowledge of movement, we can develop better strategies to protect wildlife populations, and prevent human-wildlife conflicts., ” expresses Someyah.

Tom Fisher begins with a history lesson describing how as a human society we spent most of our history living nomadically, moving from place to place. It is only a fragment of our history that we have become permanent settlers living in fixed structures and infrastructures that can be mapped.


He continues to explain that once more, our society is becoming nomadic because of the ability to freely travel, use mobile devices, spatial tools, and digital apps too, access what we need when we need it while paying for only what we use without having to own it.”


Companies offering short-term services such as Airbnb, Uber, Lyft, Lending Club, Task Rabbit, and others have prospered by offering convenience, lower prices, and increased efficiency.


With a call to action, Tom expresses that GIS Professionals have a leadership role to play in the transformation of an economy that demands spatial thinking and locational skills. With the growth of a sharing economy, a need for spatial analysts, geo-designers, and the GIS community’s creative use of spatial thinking in boardrooms, council chambers, and corner offices.  “Ours is a leadership role that we owe the customers and citizens we serve – and that we owe to ourselves.” 

Stay tuned for Part III of the https://community.esri.com/community/events/user-conference/blog/2018/07/09/live-from-the-2018-user-...‌.

more
7 8 5,596
CharlottePapp
Occasional Contributor II

As the conference continues to grow, so does the demand for quick and close lunch options. In addition to a variety of restaurants in the immediate area, this year we’ve added more choices that are close, quick, and reasonably priced all within minutes from the conference.

At the Convention CenterWoman holding food from a food truck

For a full list of concessions, menus, and hours of operation, please see the attached PDF.

At Nearby Hotels

Inside the Hilton San Diego Bayfront is the Fox Sports Grill and Vela Restaurant. At the Marriott, there is the Marina Kitchen Restaurant & Bar.

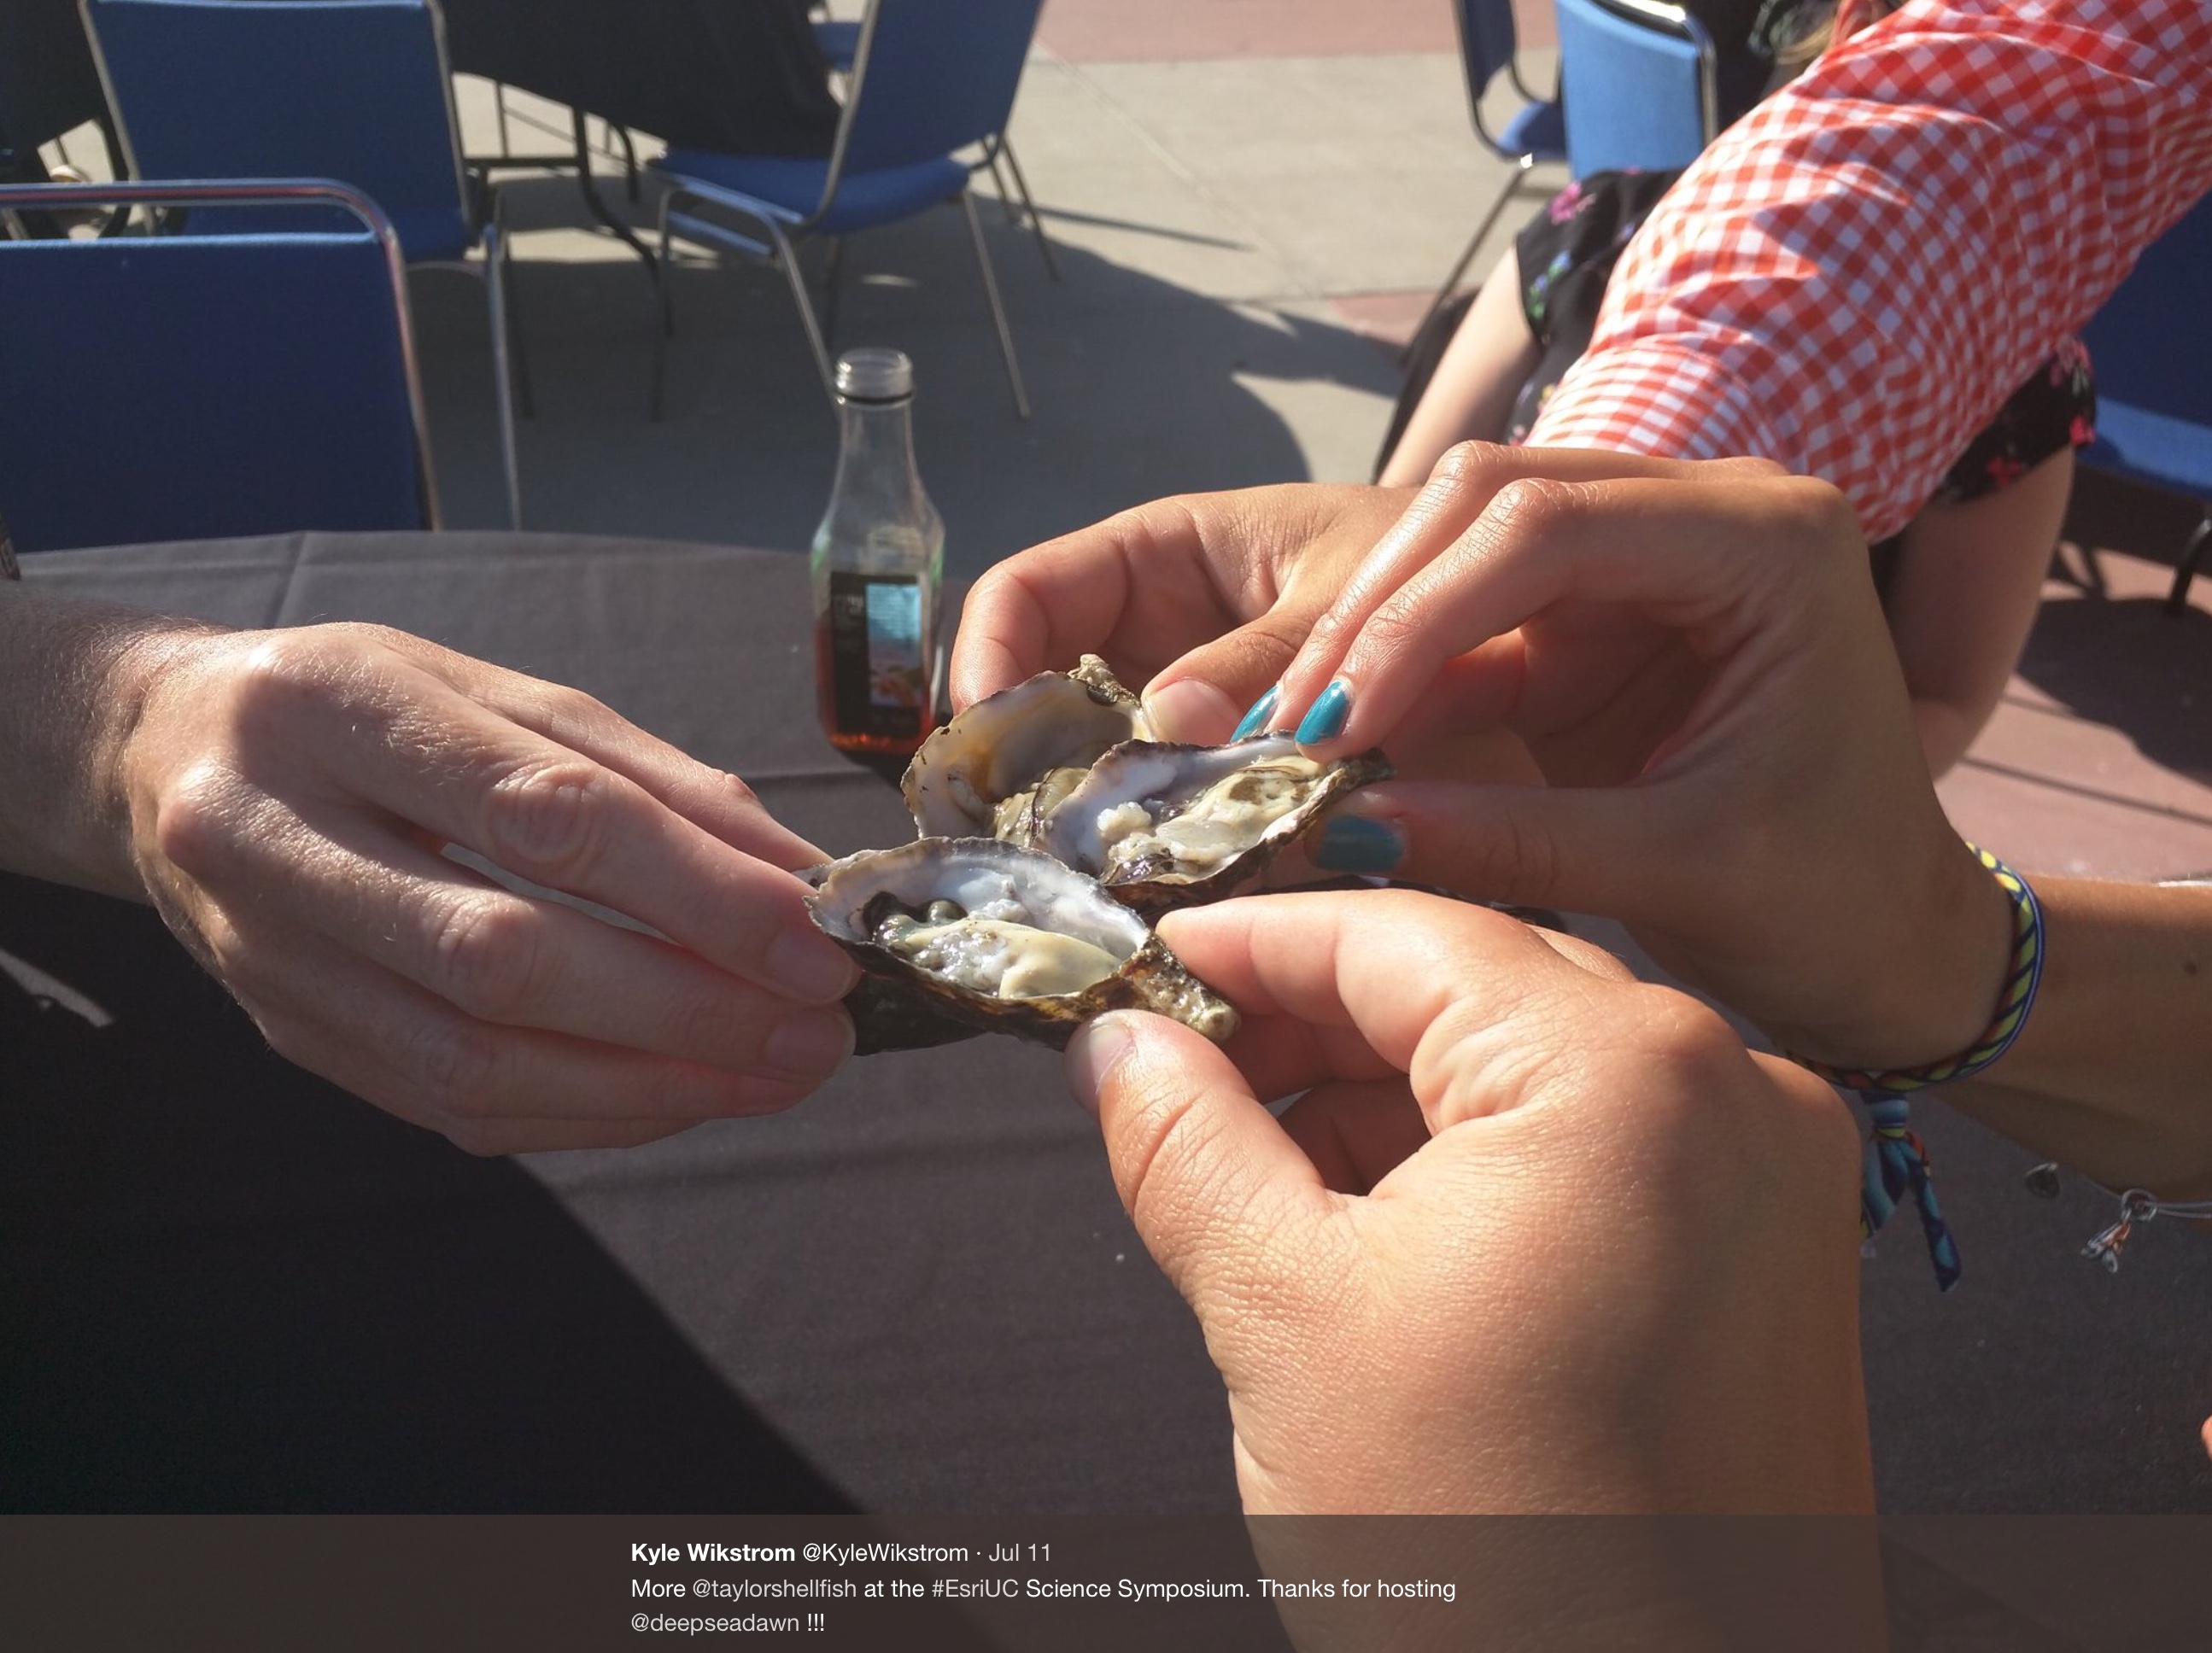
Group holding oystersIn San Diego

San Diego has an amazing variety of dining options.  Visit the concierge desk in the convention center, located on the ground floor between Halls B and C. These local experts have wonderful insights on local places to visit and where to eat in San Diego. You can also go to the concierge to learn where you can get discounts with your conference badge.

Check out our Some Places to Eat in San Diego, California story map for more great places to eat.

Tips from the Team:

  • Get to the convention center early to orient yourself
  • Wear comfortable shoes
  • Utilize the info booths (both Esri booths and the Convention Center booths)
  • Keep track of how many steps you take each day (you will be surprised!)

For Discussion:

Where do you get great food during the conference or when visiting San Diego?

more
2 1 2,135
CandaceLoya
Occasional Contributor III

Welcome and thank you for following the 2018 User Conference Plenary! We will be sharing the latest news and updates during the plenary, and we look forward to seeing your feedback and contributions in the comments below!

Be sure to follow the User Conference space for daily recaps, pictures, discussions, and more. 
  

Esri UC 2018 Plenary ScheduleUC Exhibit Hall

Doors Open at 7: 45 a.m.

Morning Session: 8:30 a.m. - 10:15 a.m.

Mid-Morning Session: 10:45 a.m. - noon

Afternoon Session: 2:00 p.m. - 3:30 p.m.

And We're Live with the GeoNet team and the Customer Advocacy team contributing to today's blog in the comments below. 

8:30 a.m. - Opening video and Jack's Welcome

Jack on stage8:33 a.m. -  The audience applauds, and Jack enters the stage. Jack opens the Plenary with his vibrant, “Welcome” to the audience. He continues with the purpose of the conference...GIS continues to evolve and increasingly plays a vital role in digital transformation, working smarter, providing a wealth of information at the fingertips of everyone all over the planet.

And to keep with his conference tradition and instill the sense of community, Jack encourages everyone to turn and meet someone around them they do not know.

Meet & Greet at UC 2018 Plenary

After the audience settles, he continues to discuss the fantastic work of others, 13 user slides showing examples of work submitted by Esri customers; work that demonstrates some of the most innovative of uses with Esri products and Applications. Each submission that was selected will receive a certificate.

And the categories are…

Environmental Modeling and Assessment
  • Air Quality Modeling 
Natural Resource Management 
Managing and Analyzing Land Information
  • CAMA

 Planning and Urban Design

  • South Korea - Urban Redevelopment
  • Abu Dhabi
Transportation Planning and Management
Engineering and Public Works
  • Sidewalk Vertical
  • The growth of Dashboards as a means of communication
Utilities and Telecommunications
  • Outage and Voltage dashboards with real-time status systems from Colorado 
Business Analysis and Location Intelligence 
Public Health and Demographics
  • High-risk schools index - San Bernardino
  • Kenya Presidential Elections - 3D democracy
Public Safety and Security
  • Incident planning response with Super Bowl
Preparing for and Responding to Disasters
  • Earthquakes to hurricanes, wildfires, and floods 
Portal, Open Data, and Citizens Engagement
  • Abu Dhabi – One-Stop Citizen Hub
  • Citizen Engagement
  • FEMA Open Data
  • And Org portals
Cartography
  • Swiss Topo as the gold standard in cartography
  • NGA - quantity and million updates per day
  • DNA mapping - London DNA Compass
 Story Maps | Telling Stories About Everything
  • Killer Whales
  • Columbia

8:46 a.m. - And the Awards go to…UC 2018 Awards

Story Map and Special Achievement in GIS (SAG) Awards

Jack announces the Special Achievement in GIS Awards winners.


Enterprise GIS - Sempra Energy AwardSempra Energy receives award

Sempra Video - Representatives receive an award

Jimmy Cho - Senior Vice President

Katie Spears - Vice President

Debbie Booy - GIS Manager

Jamie Exon - Solutions Manager


Thomas Edghill‌ shares a comment for Sempra Energy. 


Leadership in Government Award

Governor Hickenlooper - Colorado

Governor Hickenlooper receives award

President's Award – American Red Cross

American Red Cross

8:59 a.m. Vision

Jack shares the vision of GIS and what we should do next. Envisioning what's possible. Accelerating and improving efficiency. Integrating environmental thinking in everything we do. 

Matt Ball‌ 

How do we take the next step? We need to embrace the digital transformation to create a societal GIS. My sense over the years is not whether this is possible, it’s essential and inevitable. You will be participating in this, and making it happen.

Web GIS is Driving Digital Transformation - Helping Organizations to re-envision their workflows.

Jack shares what's next. 

See comment shared below  >>

9:15 a.m. - Our Work

ArcGIS supports two kinds of community. It integrates and embodies all types of data by organizing content and information you creating a common language. It focuses on three main areas of the Enterprise - Systems of records, systems of insights and systems of engagement.

9:15 a.m. - Seedling to Shelf – The Transformation of GIS Across a Vertically Integrated Forestry Supply Chain

J.D. Irving, Limited (JDI)

Speakers: Jason Killiam, J.D. Irving and Heather Morrison, Esri


Jack introduces Jason Killiam, Chief Forester.


Jason reflects in time to 1882 when J.D. Irving, Limited (JDI) began in a small town in Atlantics, Canada. This small family business continues to grow and diversify with 15,000 employees operating in 22 States and eight Provinces. JDI is pursuing a vision using GIS as a way to keep their growing business connected.


Jason continues to tell how JDI started their GIS journey in 1984 as a system of records for 6-million acres of woodlands that they managed. As the business grew, so did their records from paper maps to a digital GIS platform.


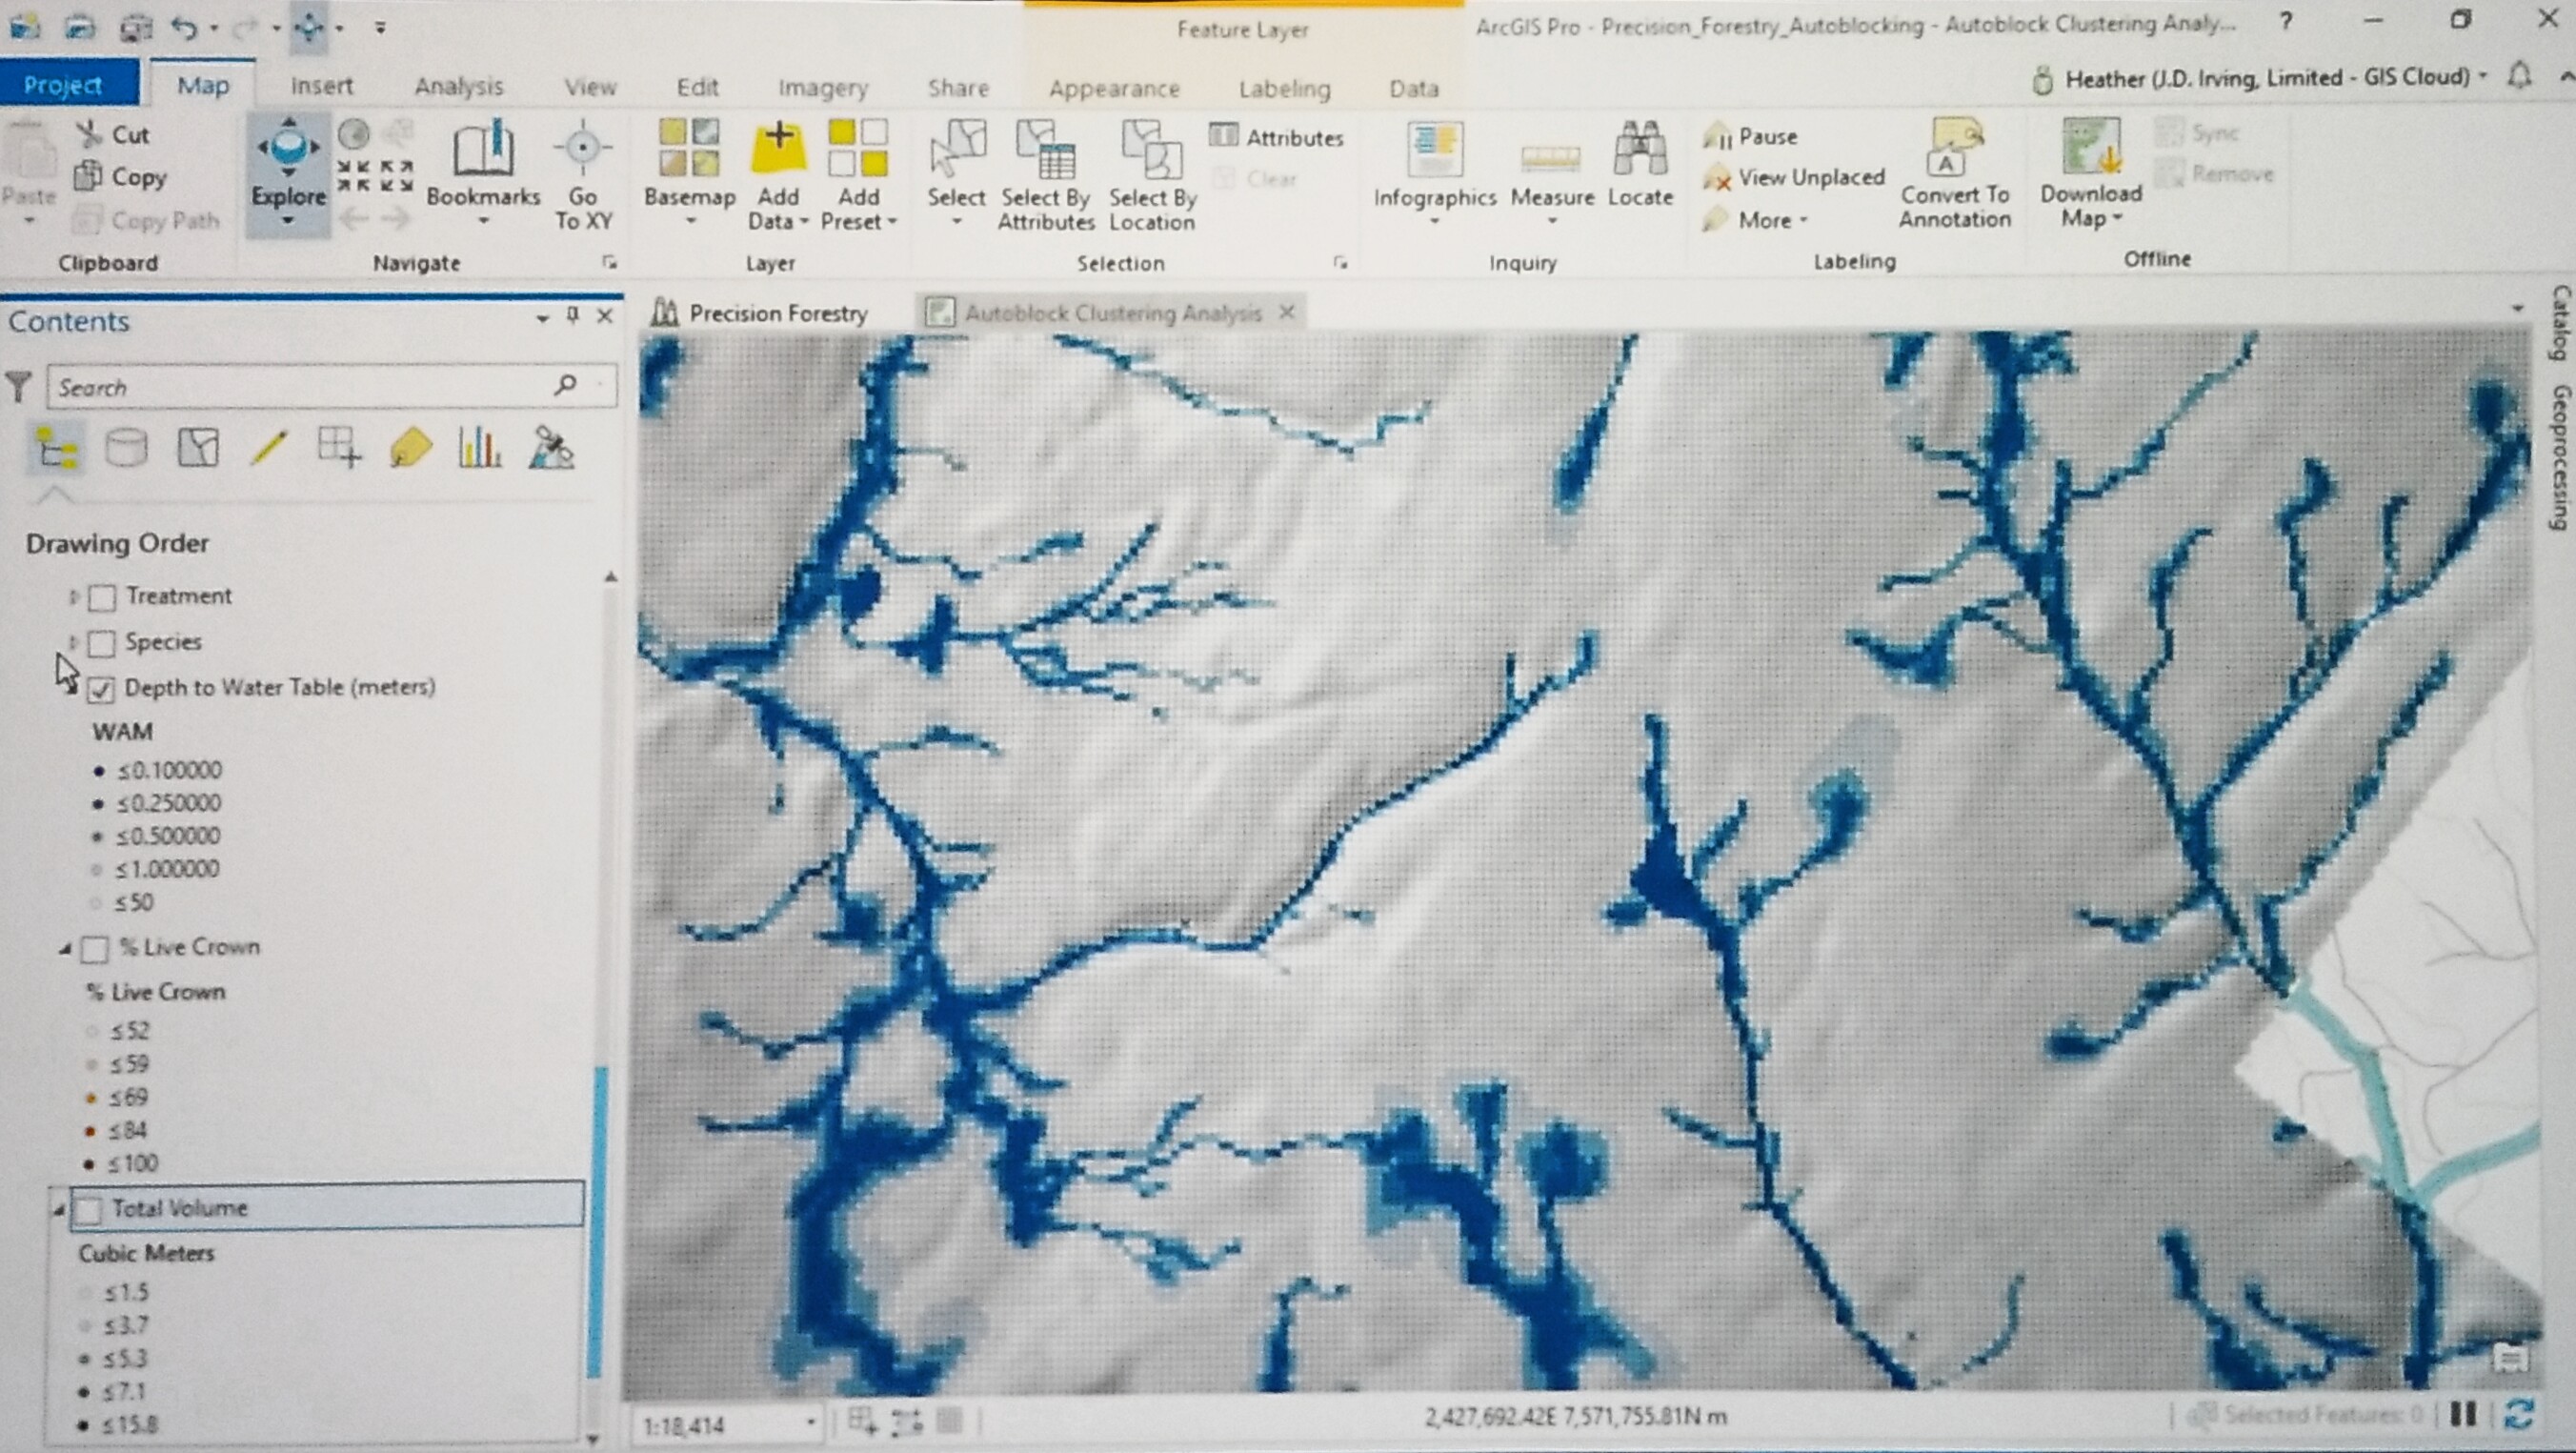
Lidar technology has changed how JDI, sees the forest; with a hyper-accurate scan of the forest, they can uncover new opportunities to use the technology to propel decision-making.

Jason shares the Seed to Shelf video. The video begins with the seedlings grown in the nurseries to the planting and harvesting to make paper.Waterways


He continues the demonstration with a Lidar image using modeling, displaying the outputs of our new precision inventory.

  • How much volume is standing in the forest
  • The percent of live crown of the trees
  • Map how deep the water table is below the surface of the land
  • Better protect waterways and areas in their operations

Over the last few years....we’ve been investing in precision forestry....which for us means taking the Lidar scan of the forest....and transforming the inner workings of our supply chain processes.


Heather chimes in with a Field Demo on Ops Explorer where they are taking advantage of the offline capabilities of Explorer and giving the power of GIS and precision forestry into the hands of foresters in the field.

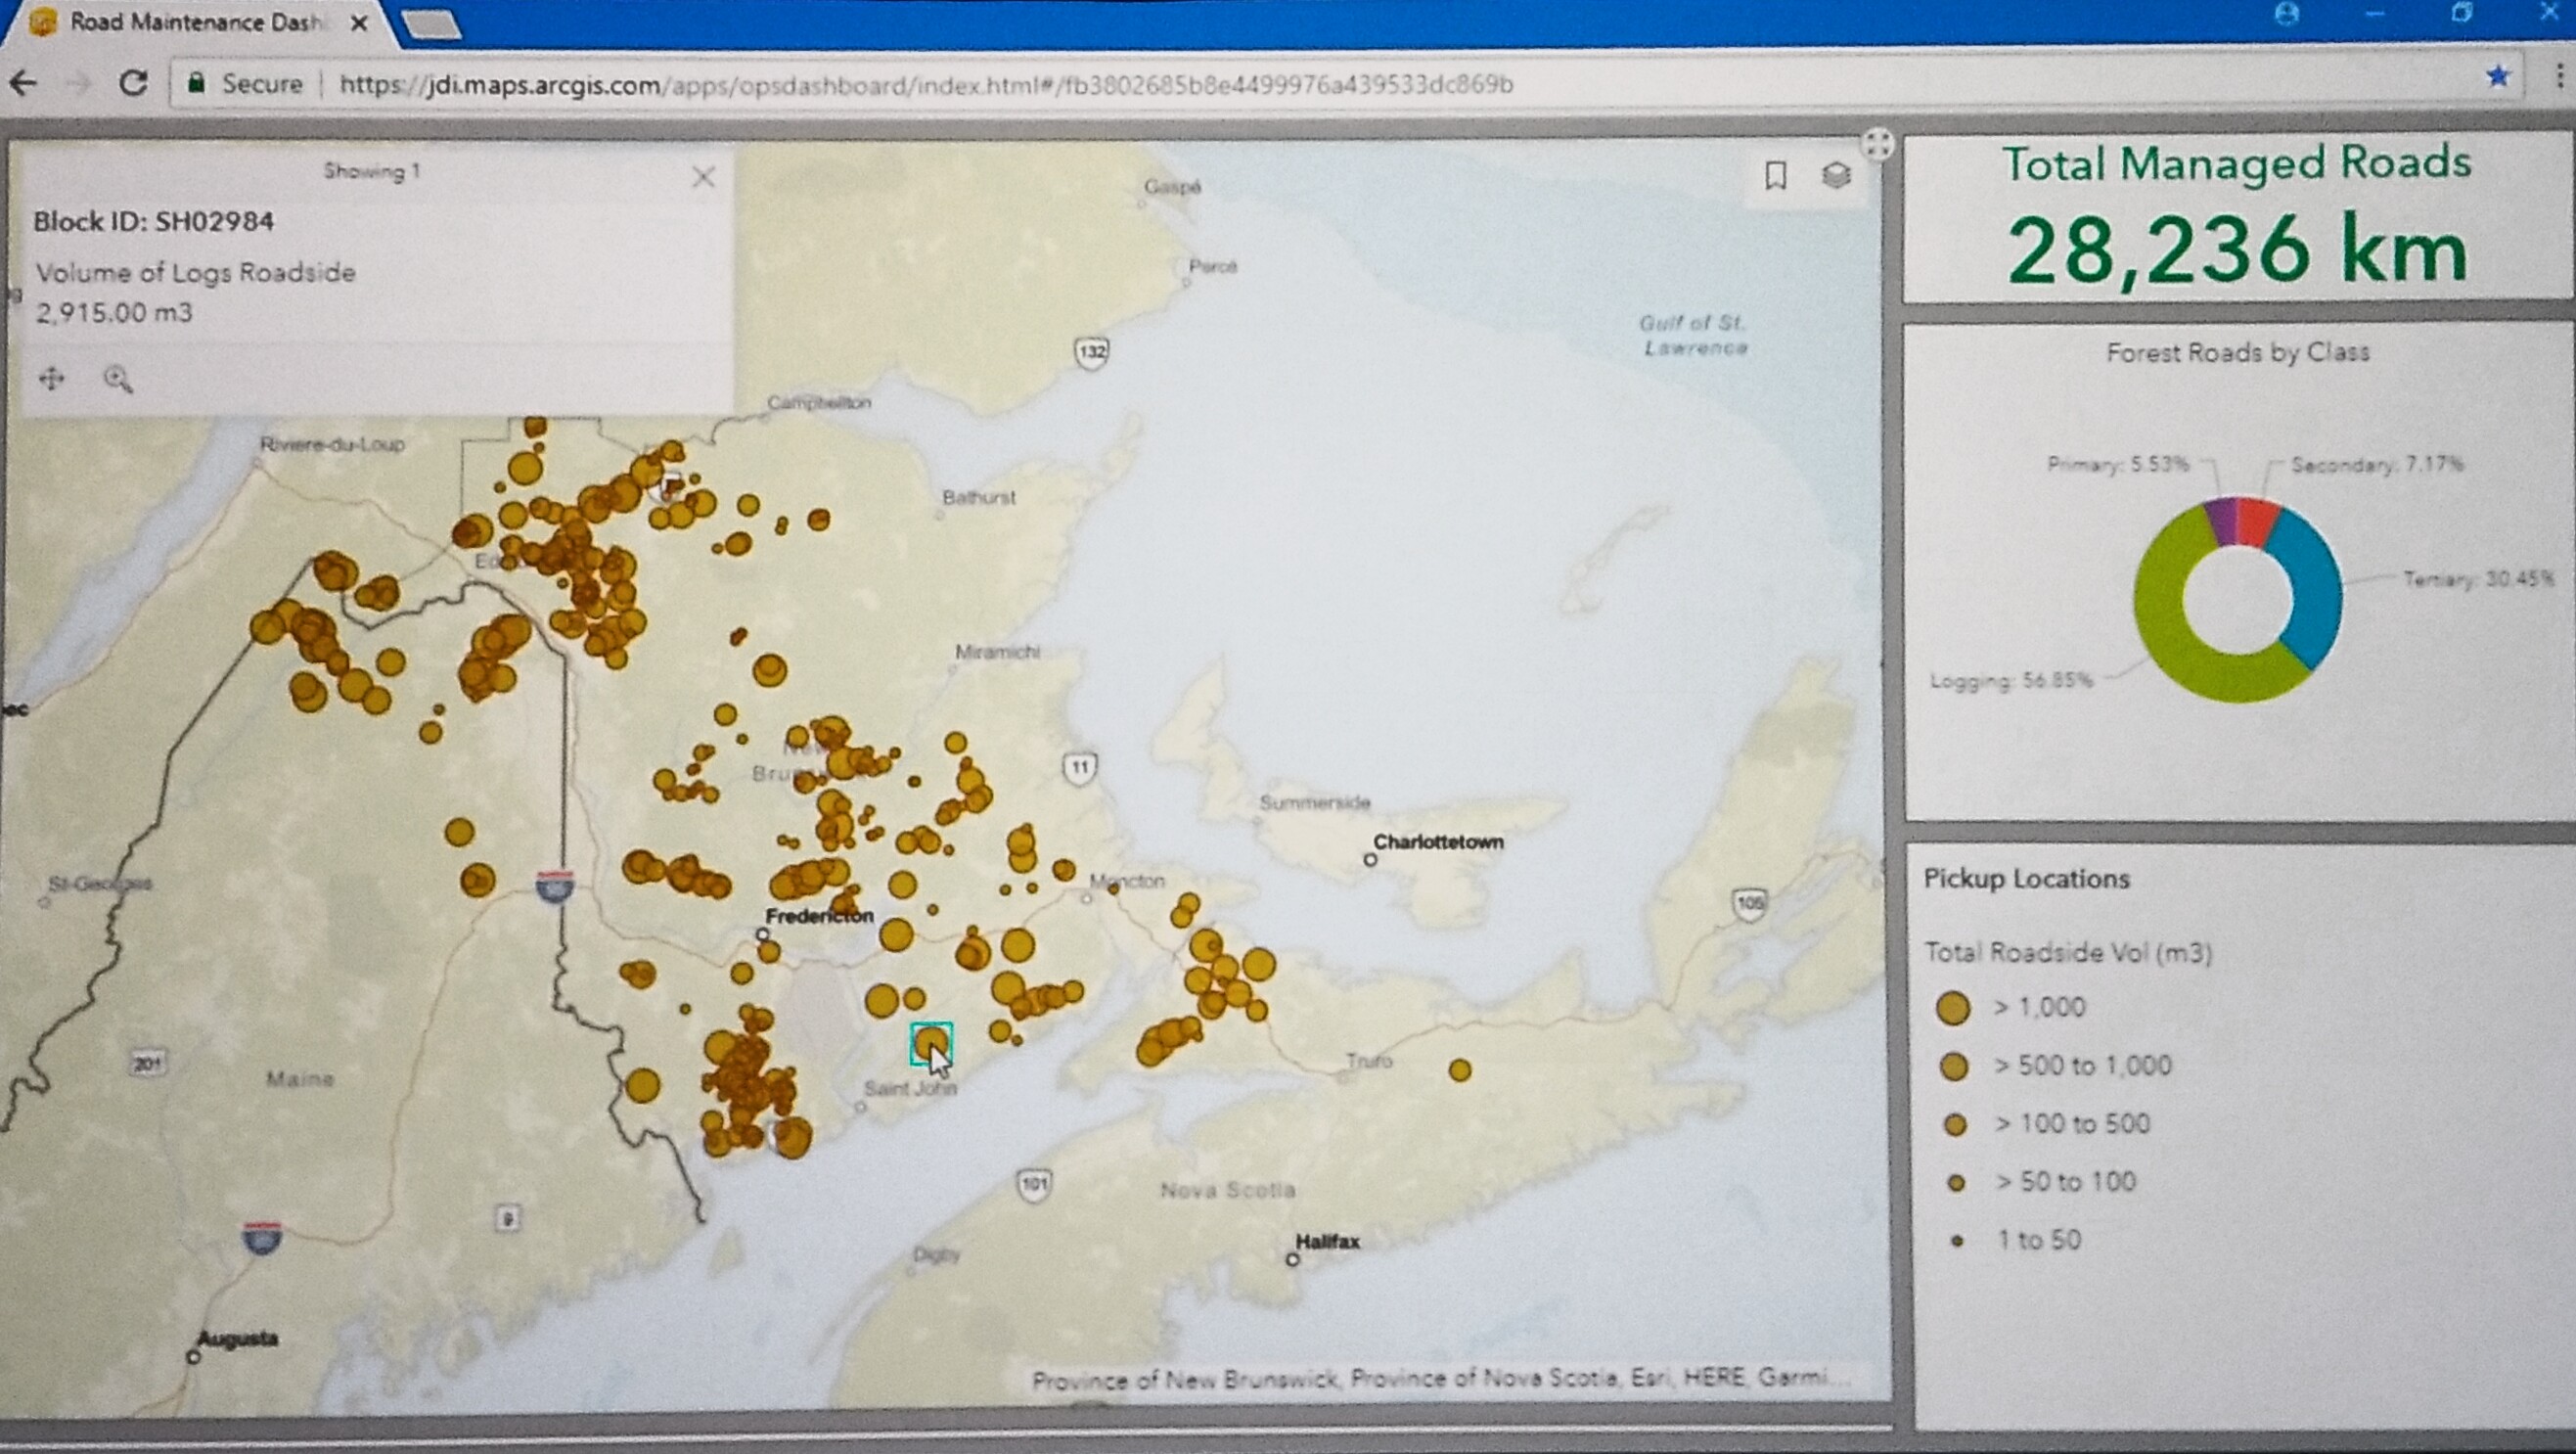
Road Maintenance Map

Jason presents a second demonstration with location intelligence to track where the fleet of harvesters are operating. They are tracking more than 180 machines 24 hours a day and tracking data to capture treated and depleted areas of forest inventory.

Heather continues with a workflow demonstration for how JDI can conduct planting audits using ArcGIS Collector’s new offline workflows pre-planned in the office to downloads onto devices for auditors.

Routing is also made simpler for JDI’s supply chain management of harvested logs delivering over 20 forest products to more than 30 mills. They also track the road conditions and speed of their trucks.

Using Survey123, they found a solution for asset inspection for forest products moved by rail. With the offline version, they can update existing assets and collect new inspection records.

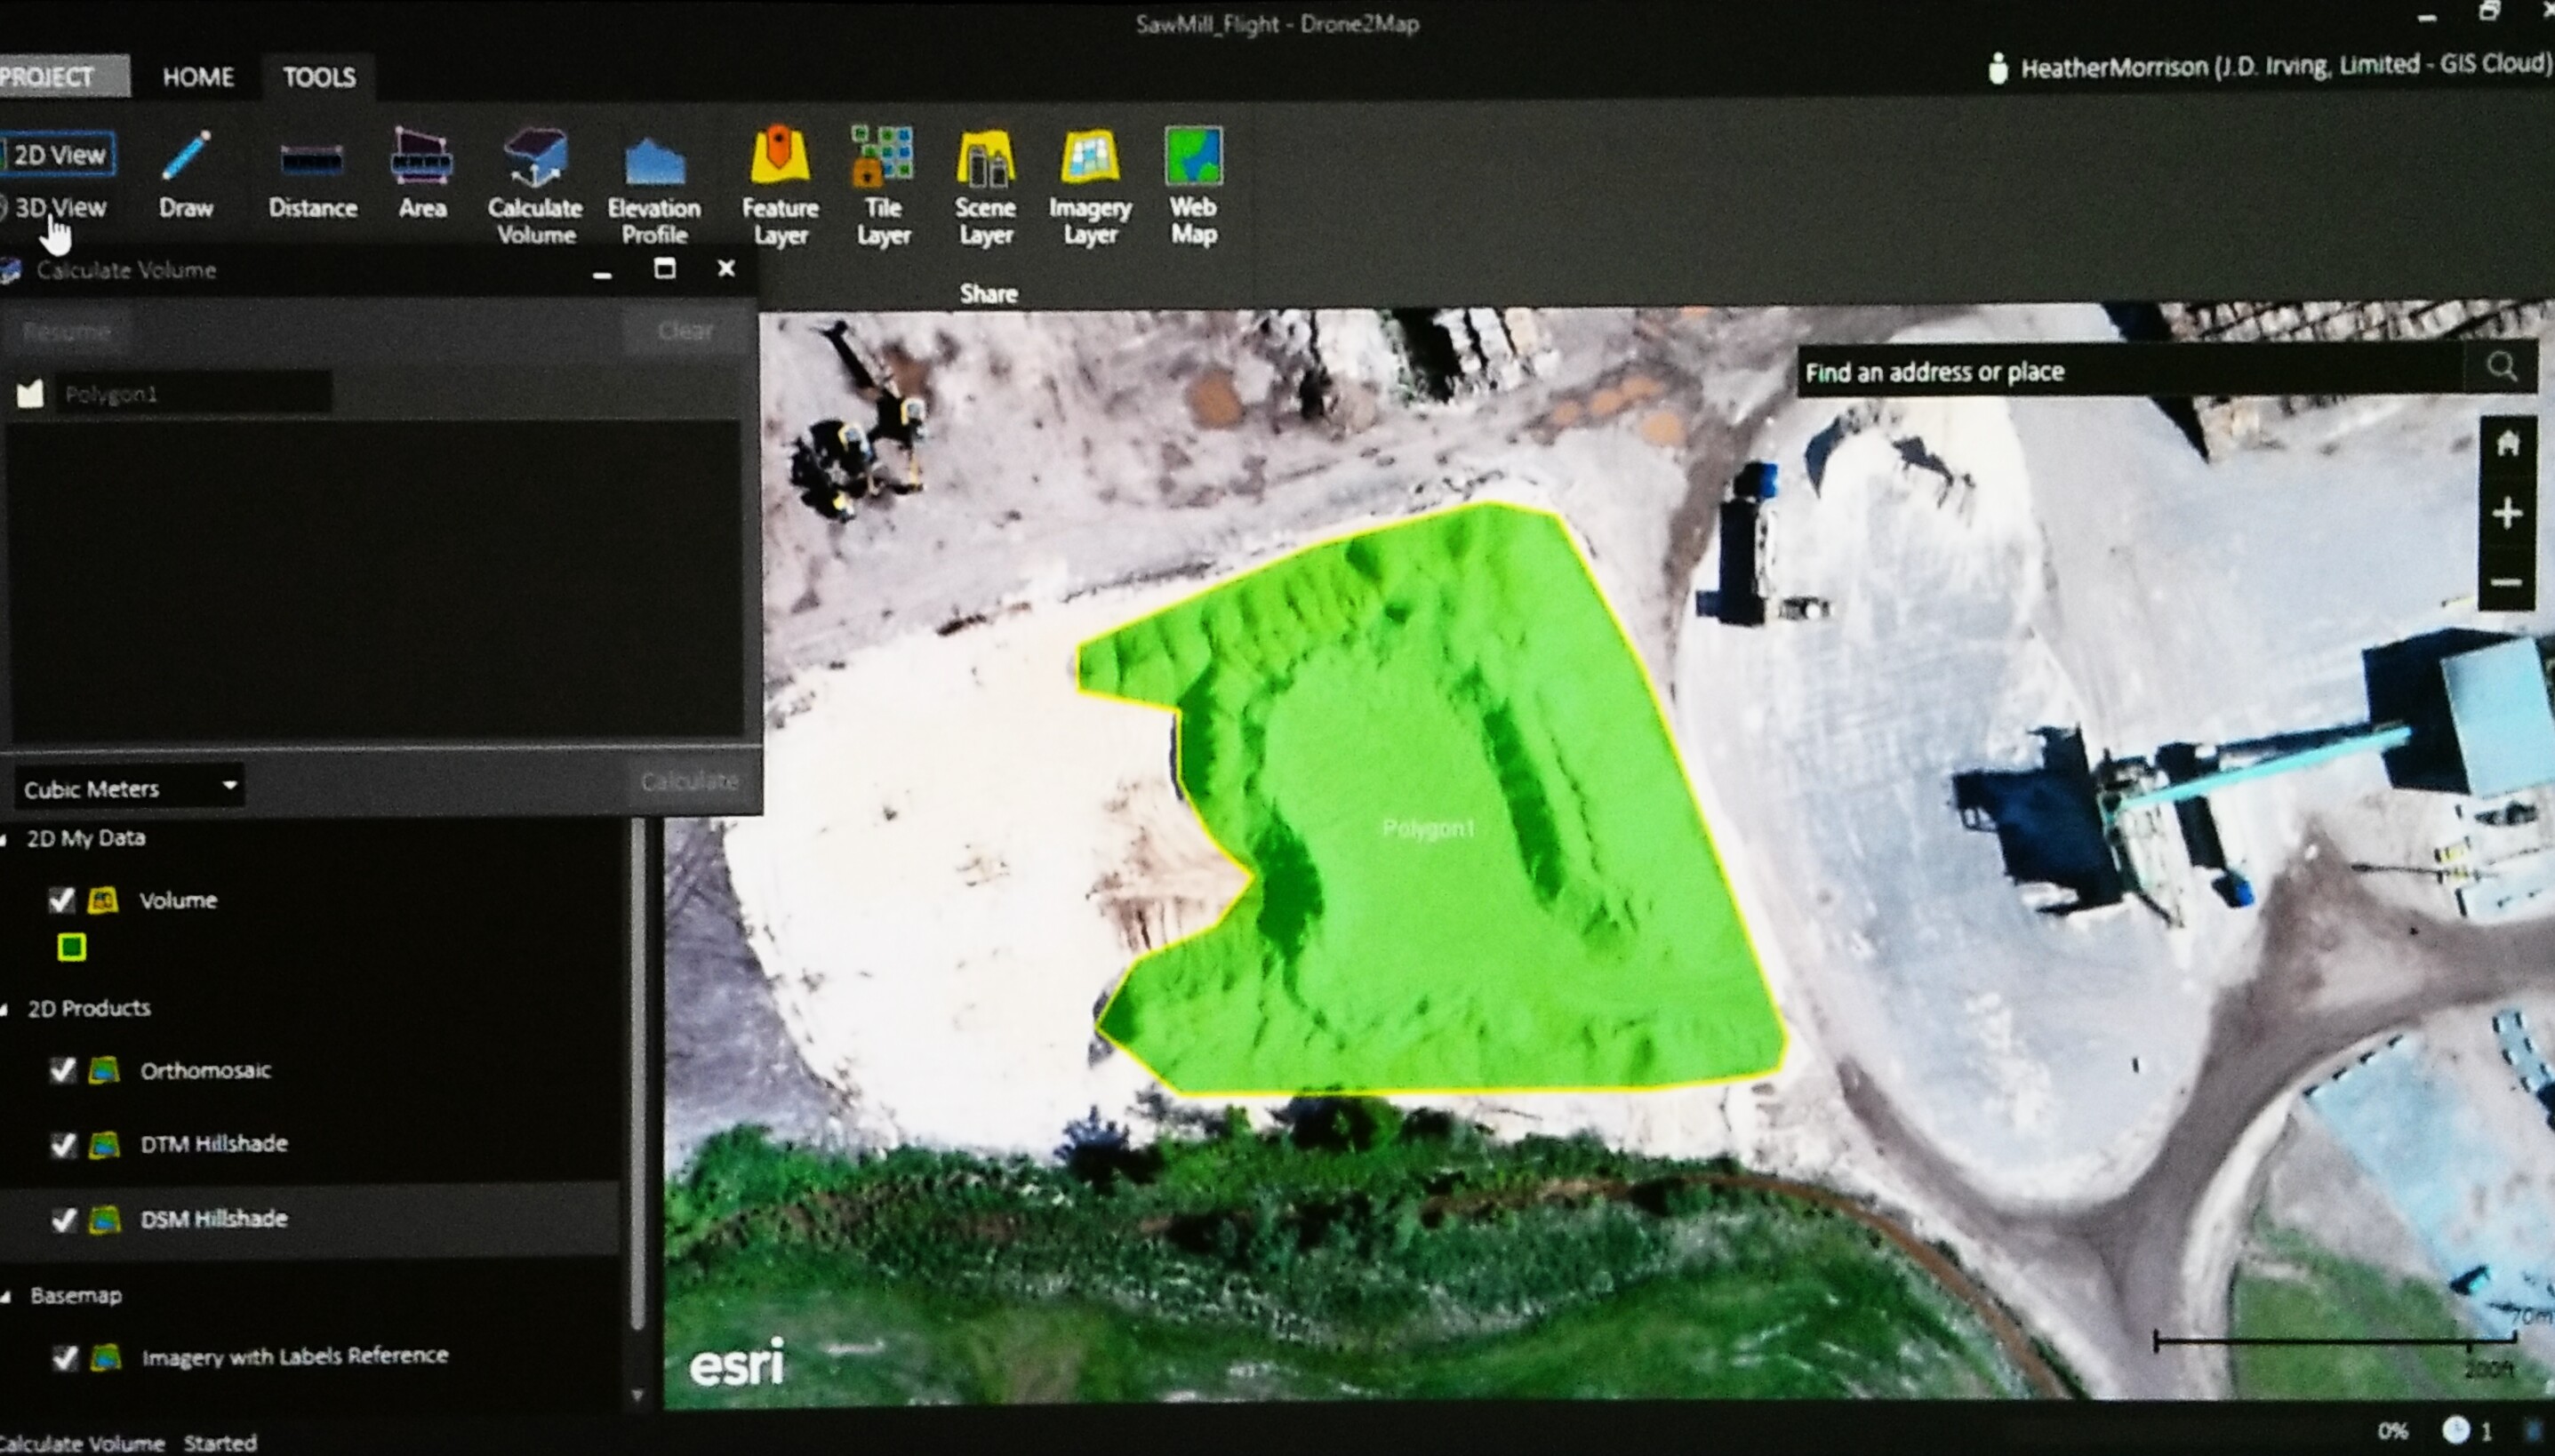
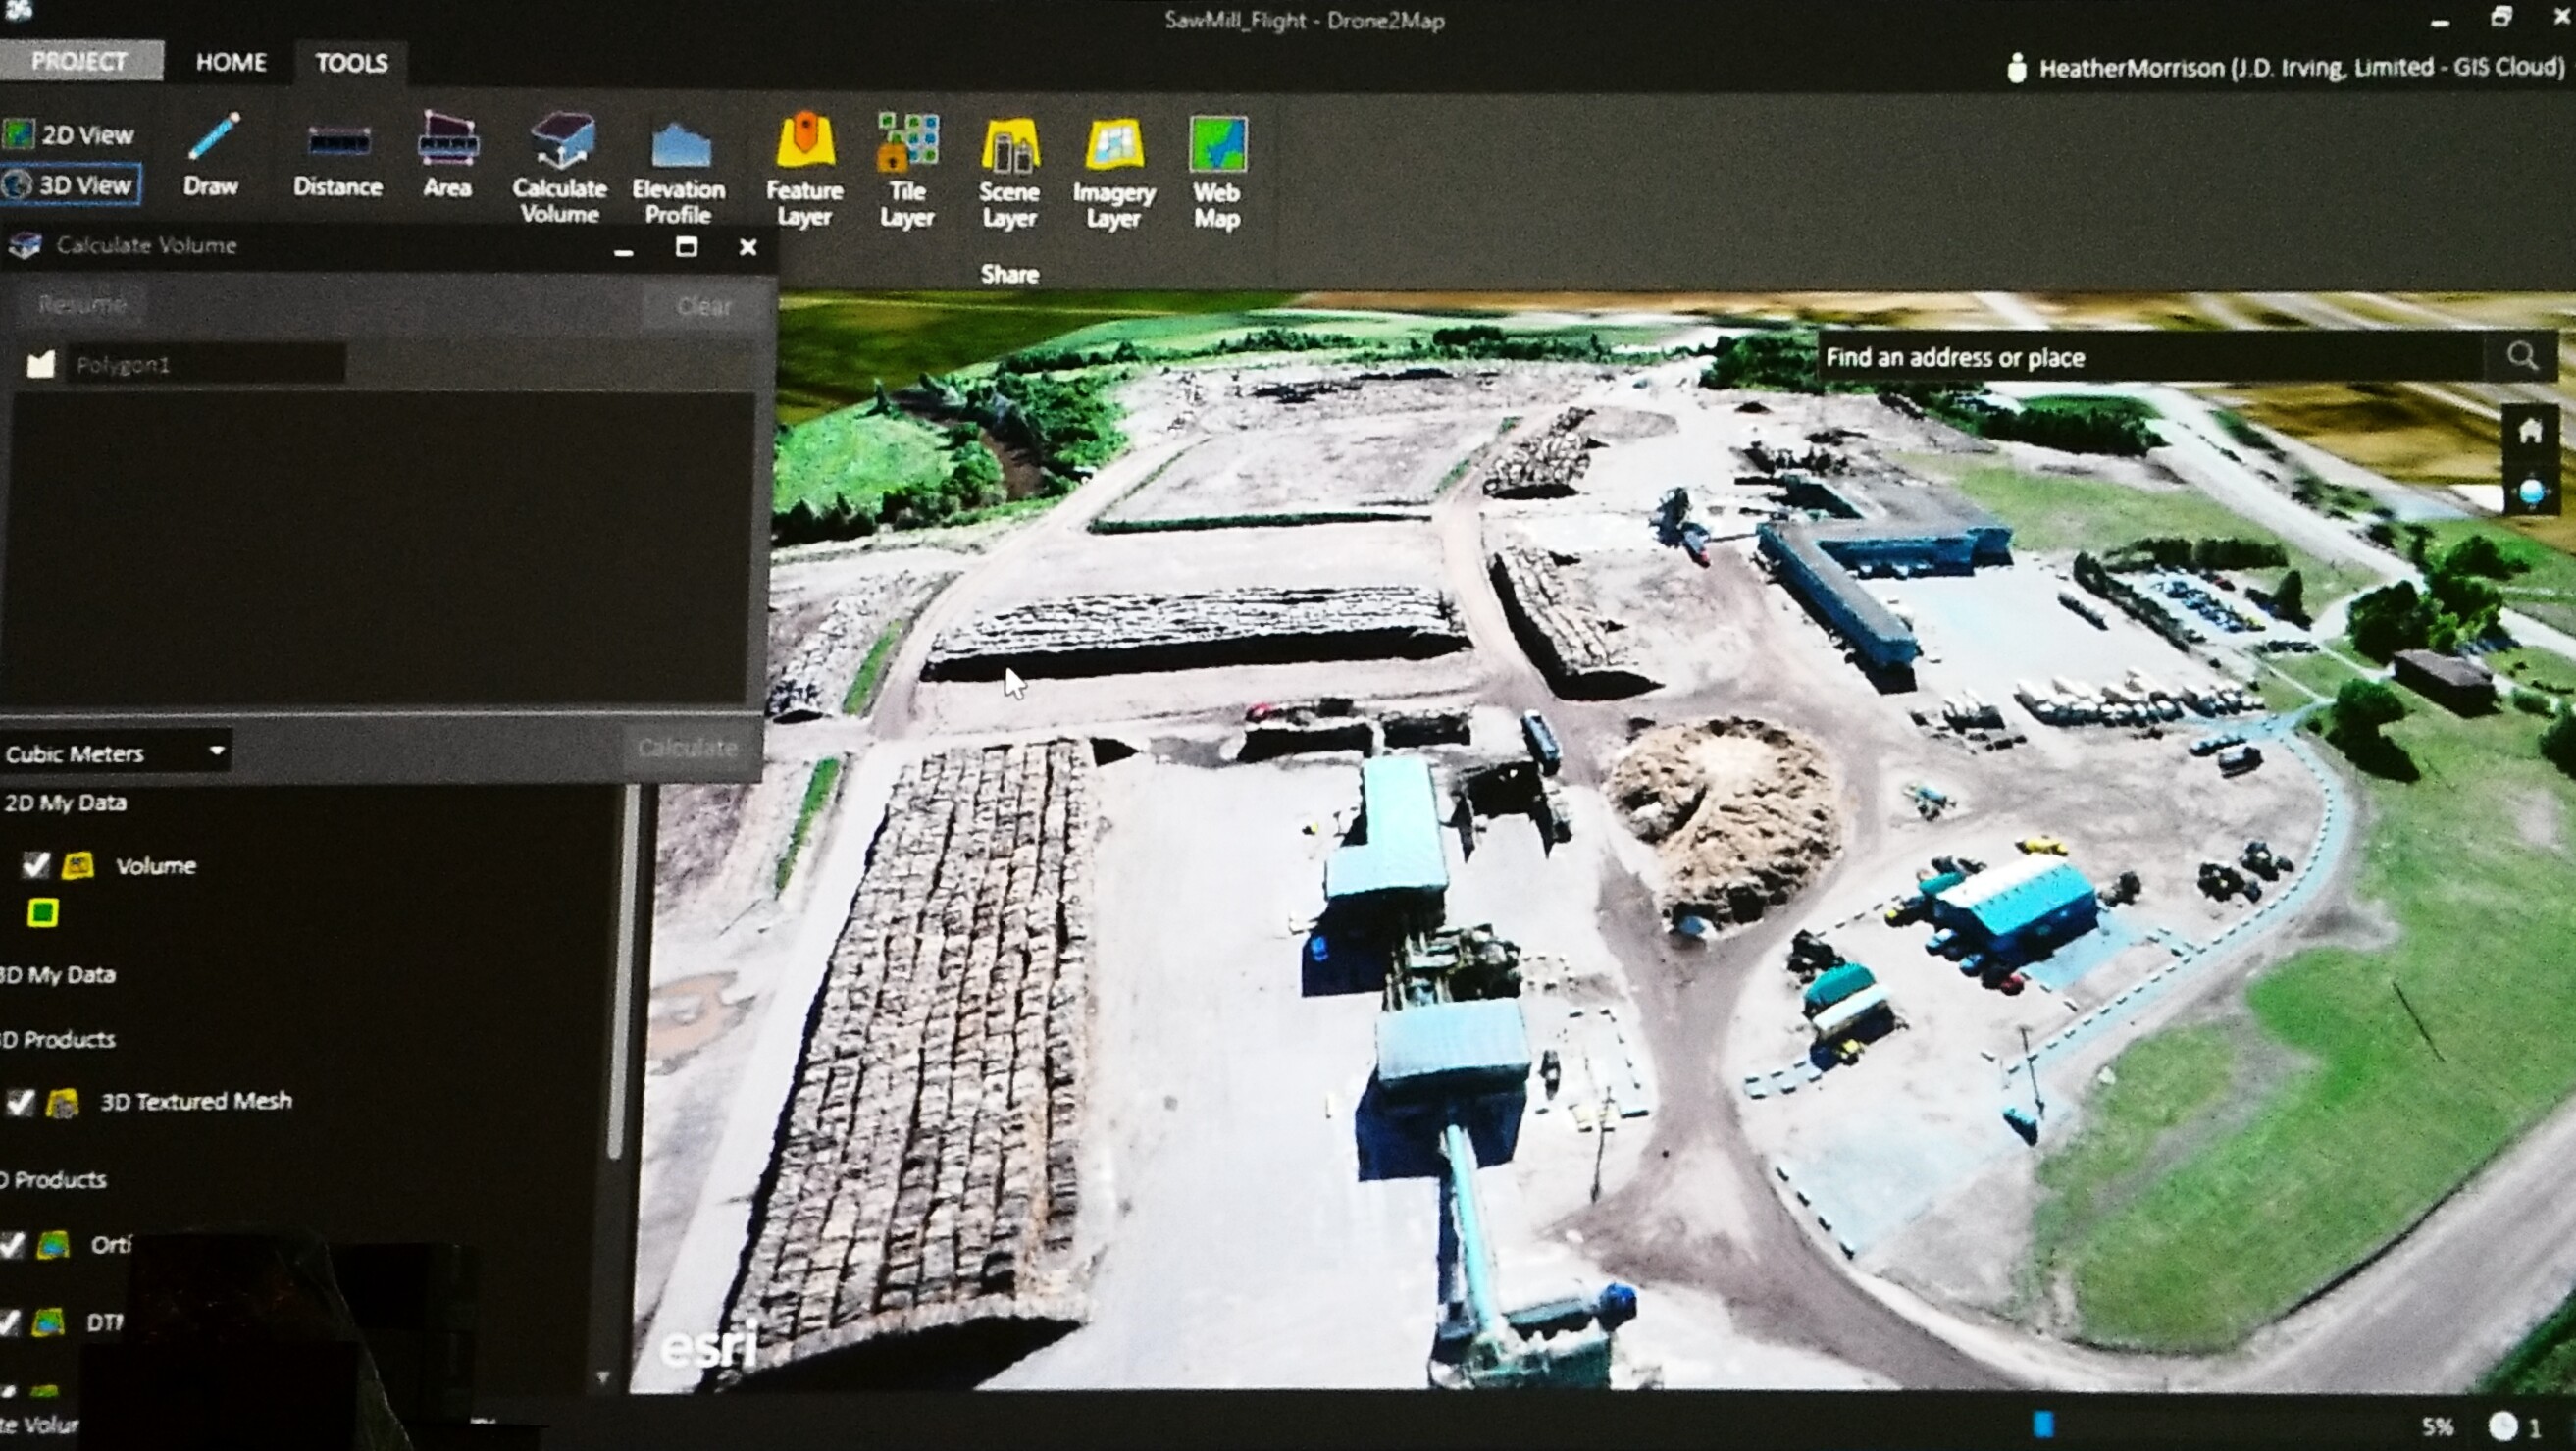
At the sawmill, JDI is using Drone2Map for ArcGIS to capture 2D and 3D products to calculate the volume of chip piles.

In our operations, nothing goes to waste. – Jason Killiam.

Logs turn to lumber. The residue (bark, chips, sawdust, and shavings) are used in other processes. The chips go to the paper mills producing paper and tissue.

Drone2Map

The real-time dashboard they display confirms their lean inventory is at the right level.

Looking at distribution maps, they can see opportunities for tissue sales in North America. They can identify and flag stores for growth opportunities.

JDI’s digital transformation doesn’t stop at the supply chains. Using location analytics, they are the primary funding partner behind the largest deer research projects in the Northeast, tracking over 100 deer with precise GPS collars over the last five years.

J.D. Irving, Limited Chip Supply

Jason shares the JDI inspiration. JDI’s story goes beyond the research they support and do, but also in sustainability. Their award-winning program protects over 1,450 special sites across more than 180,000 across of plants, wetlands, habitats, and biodiversity.

Jason continues, ”We planted our first tree over 60 years ago…and in less than 3-weeks, we will be planting our One Billionth Tree.” Before exiting the stage, he presents Jack with a sister seedling in celebration of their tree planting milestone.

9:28 a.m. Our Work

Speaker: Jack Dangermond


ArcGIS is advancing in many new and exciting ways with  Data Management and Industry Models.


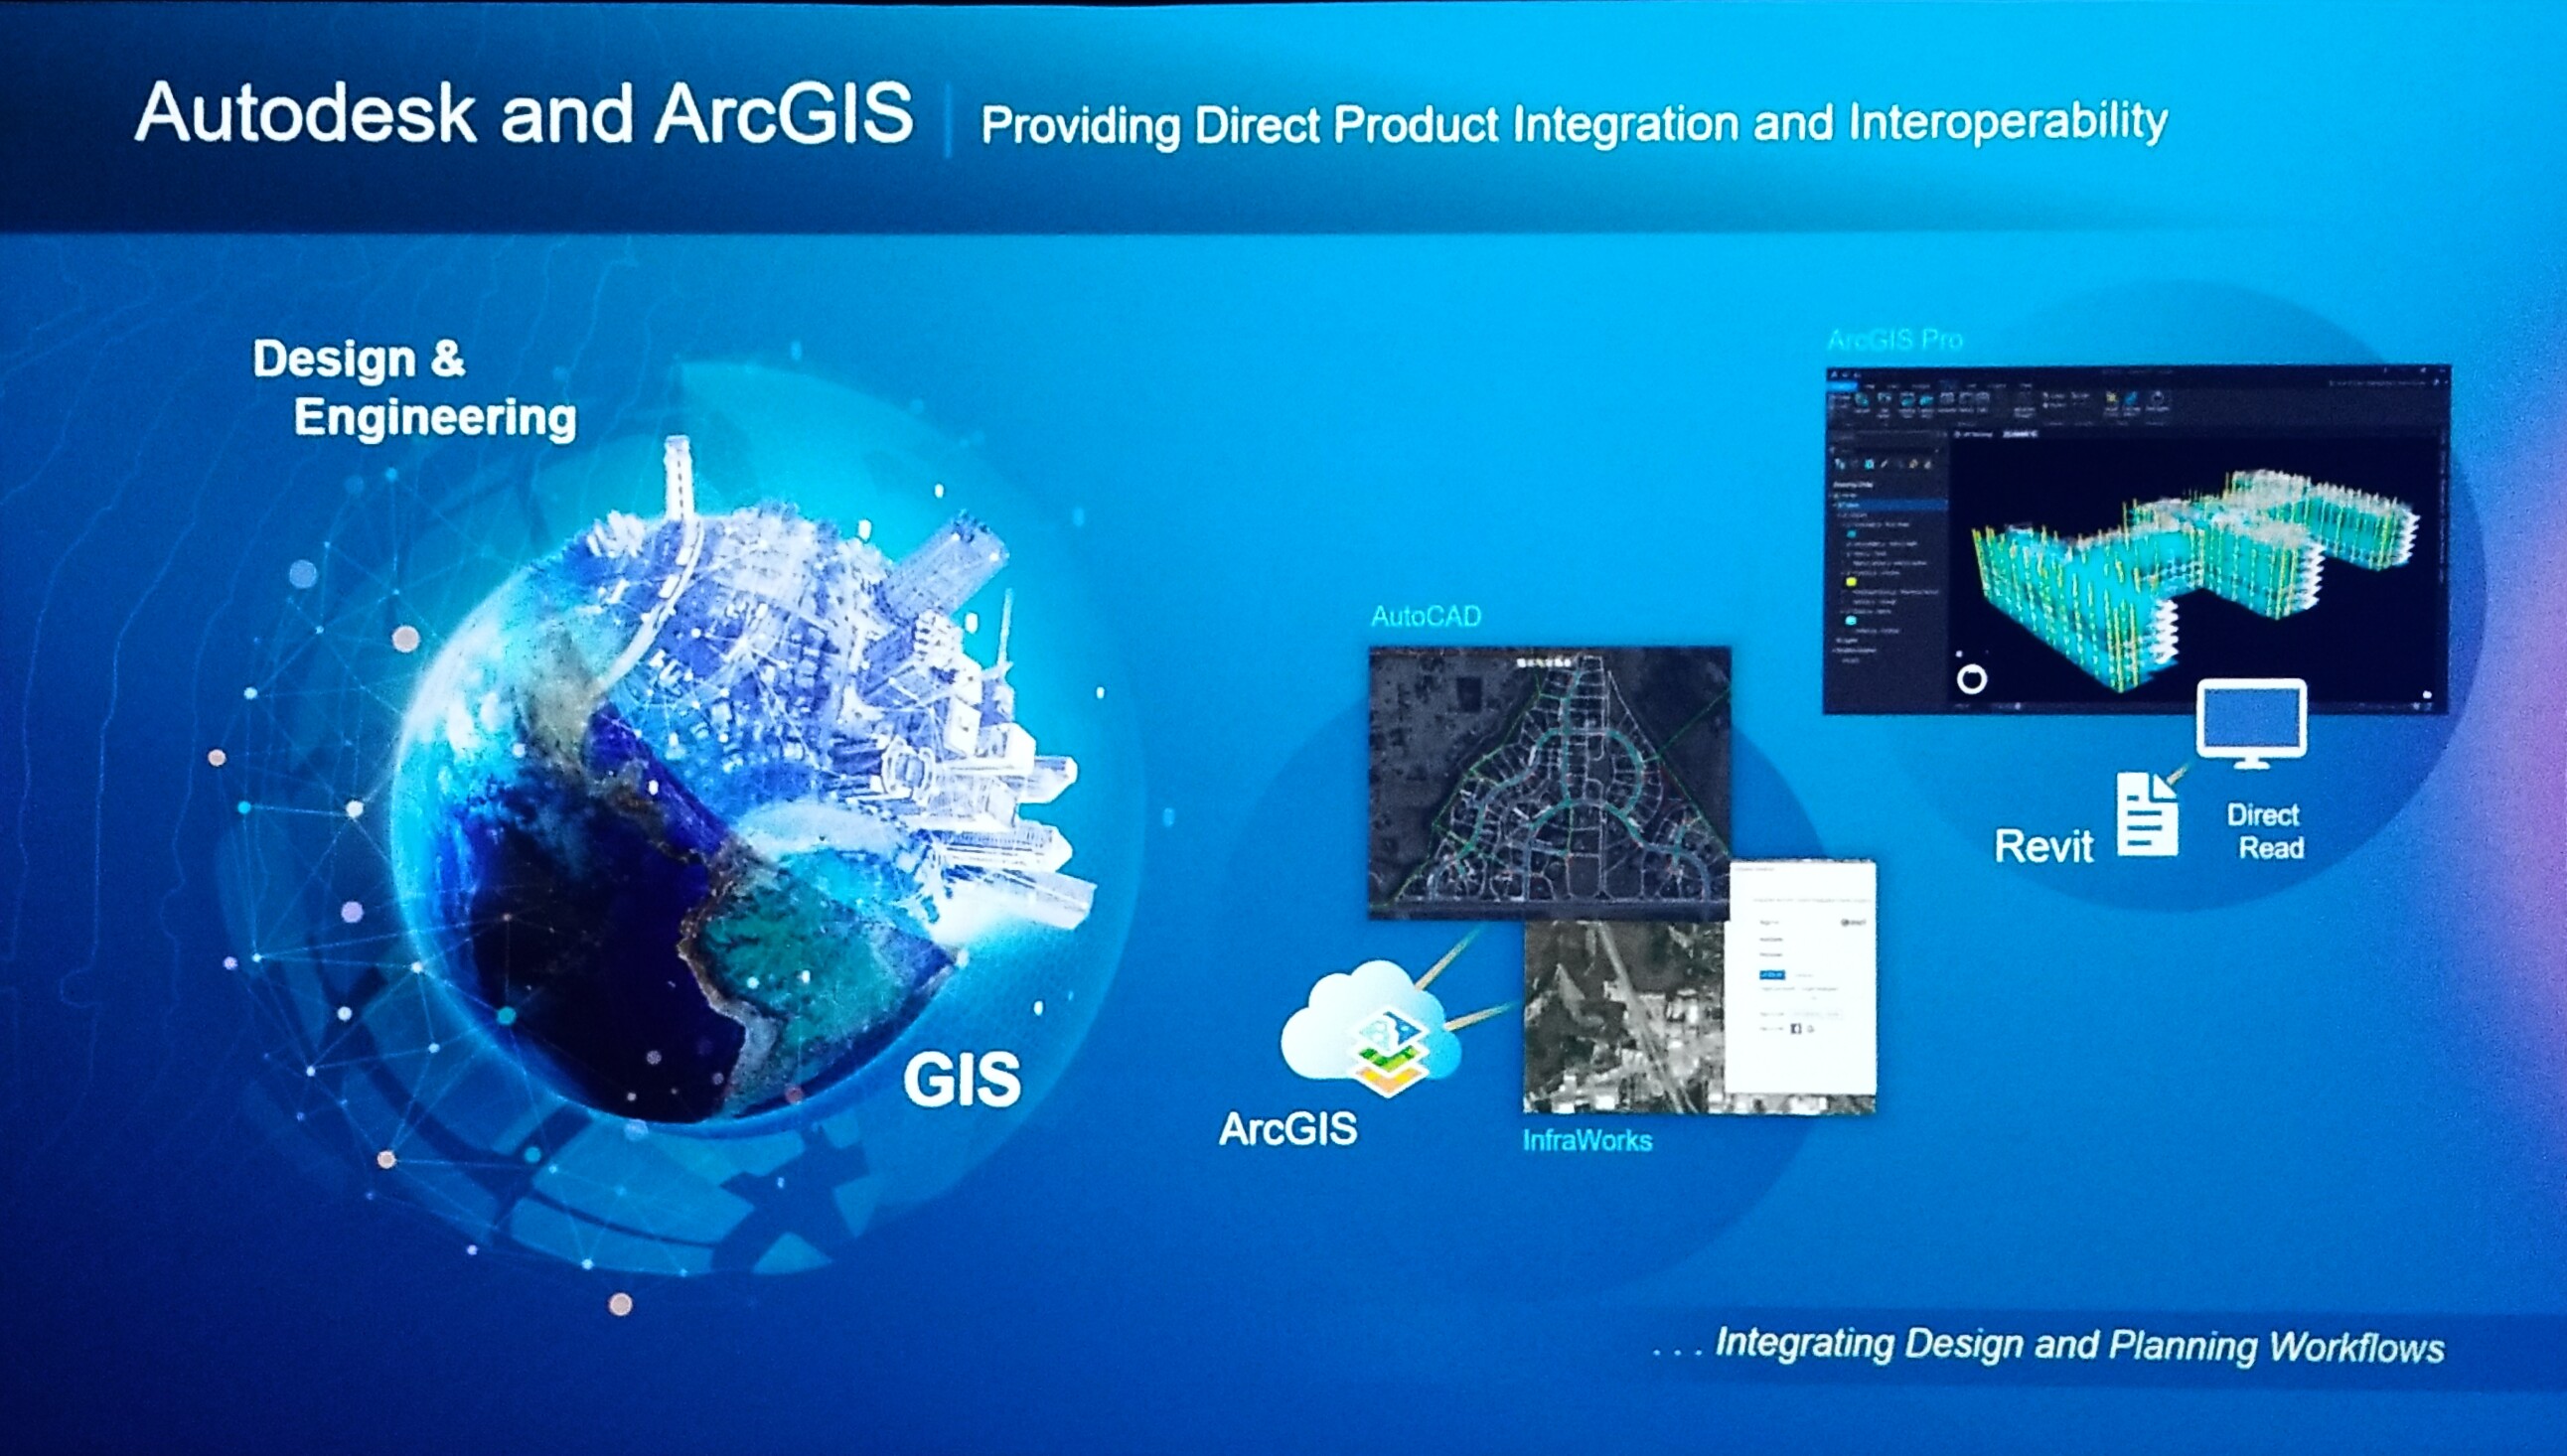
Autodesk and ArcGIS direct product integration and interoperability for AutoCAD to ArcGIS Pro.

GIS Design and engineering > ArcGIS > Revit

Autodesk

Field Solutions


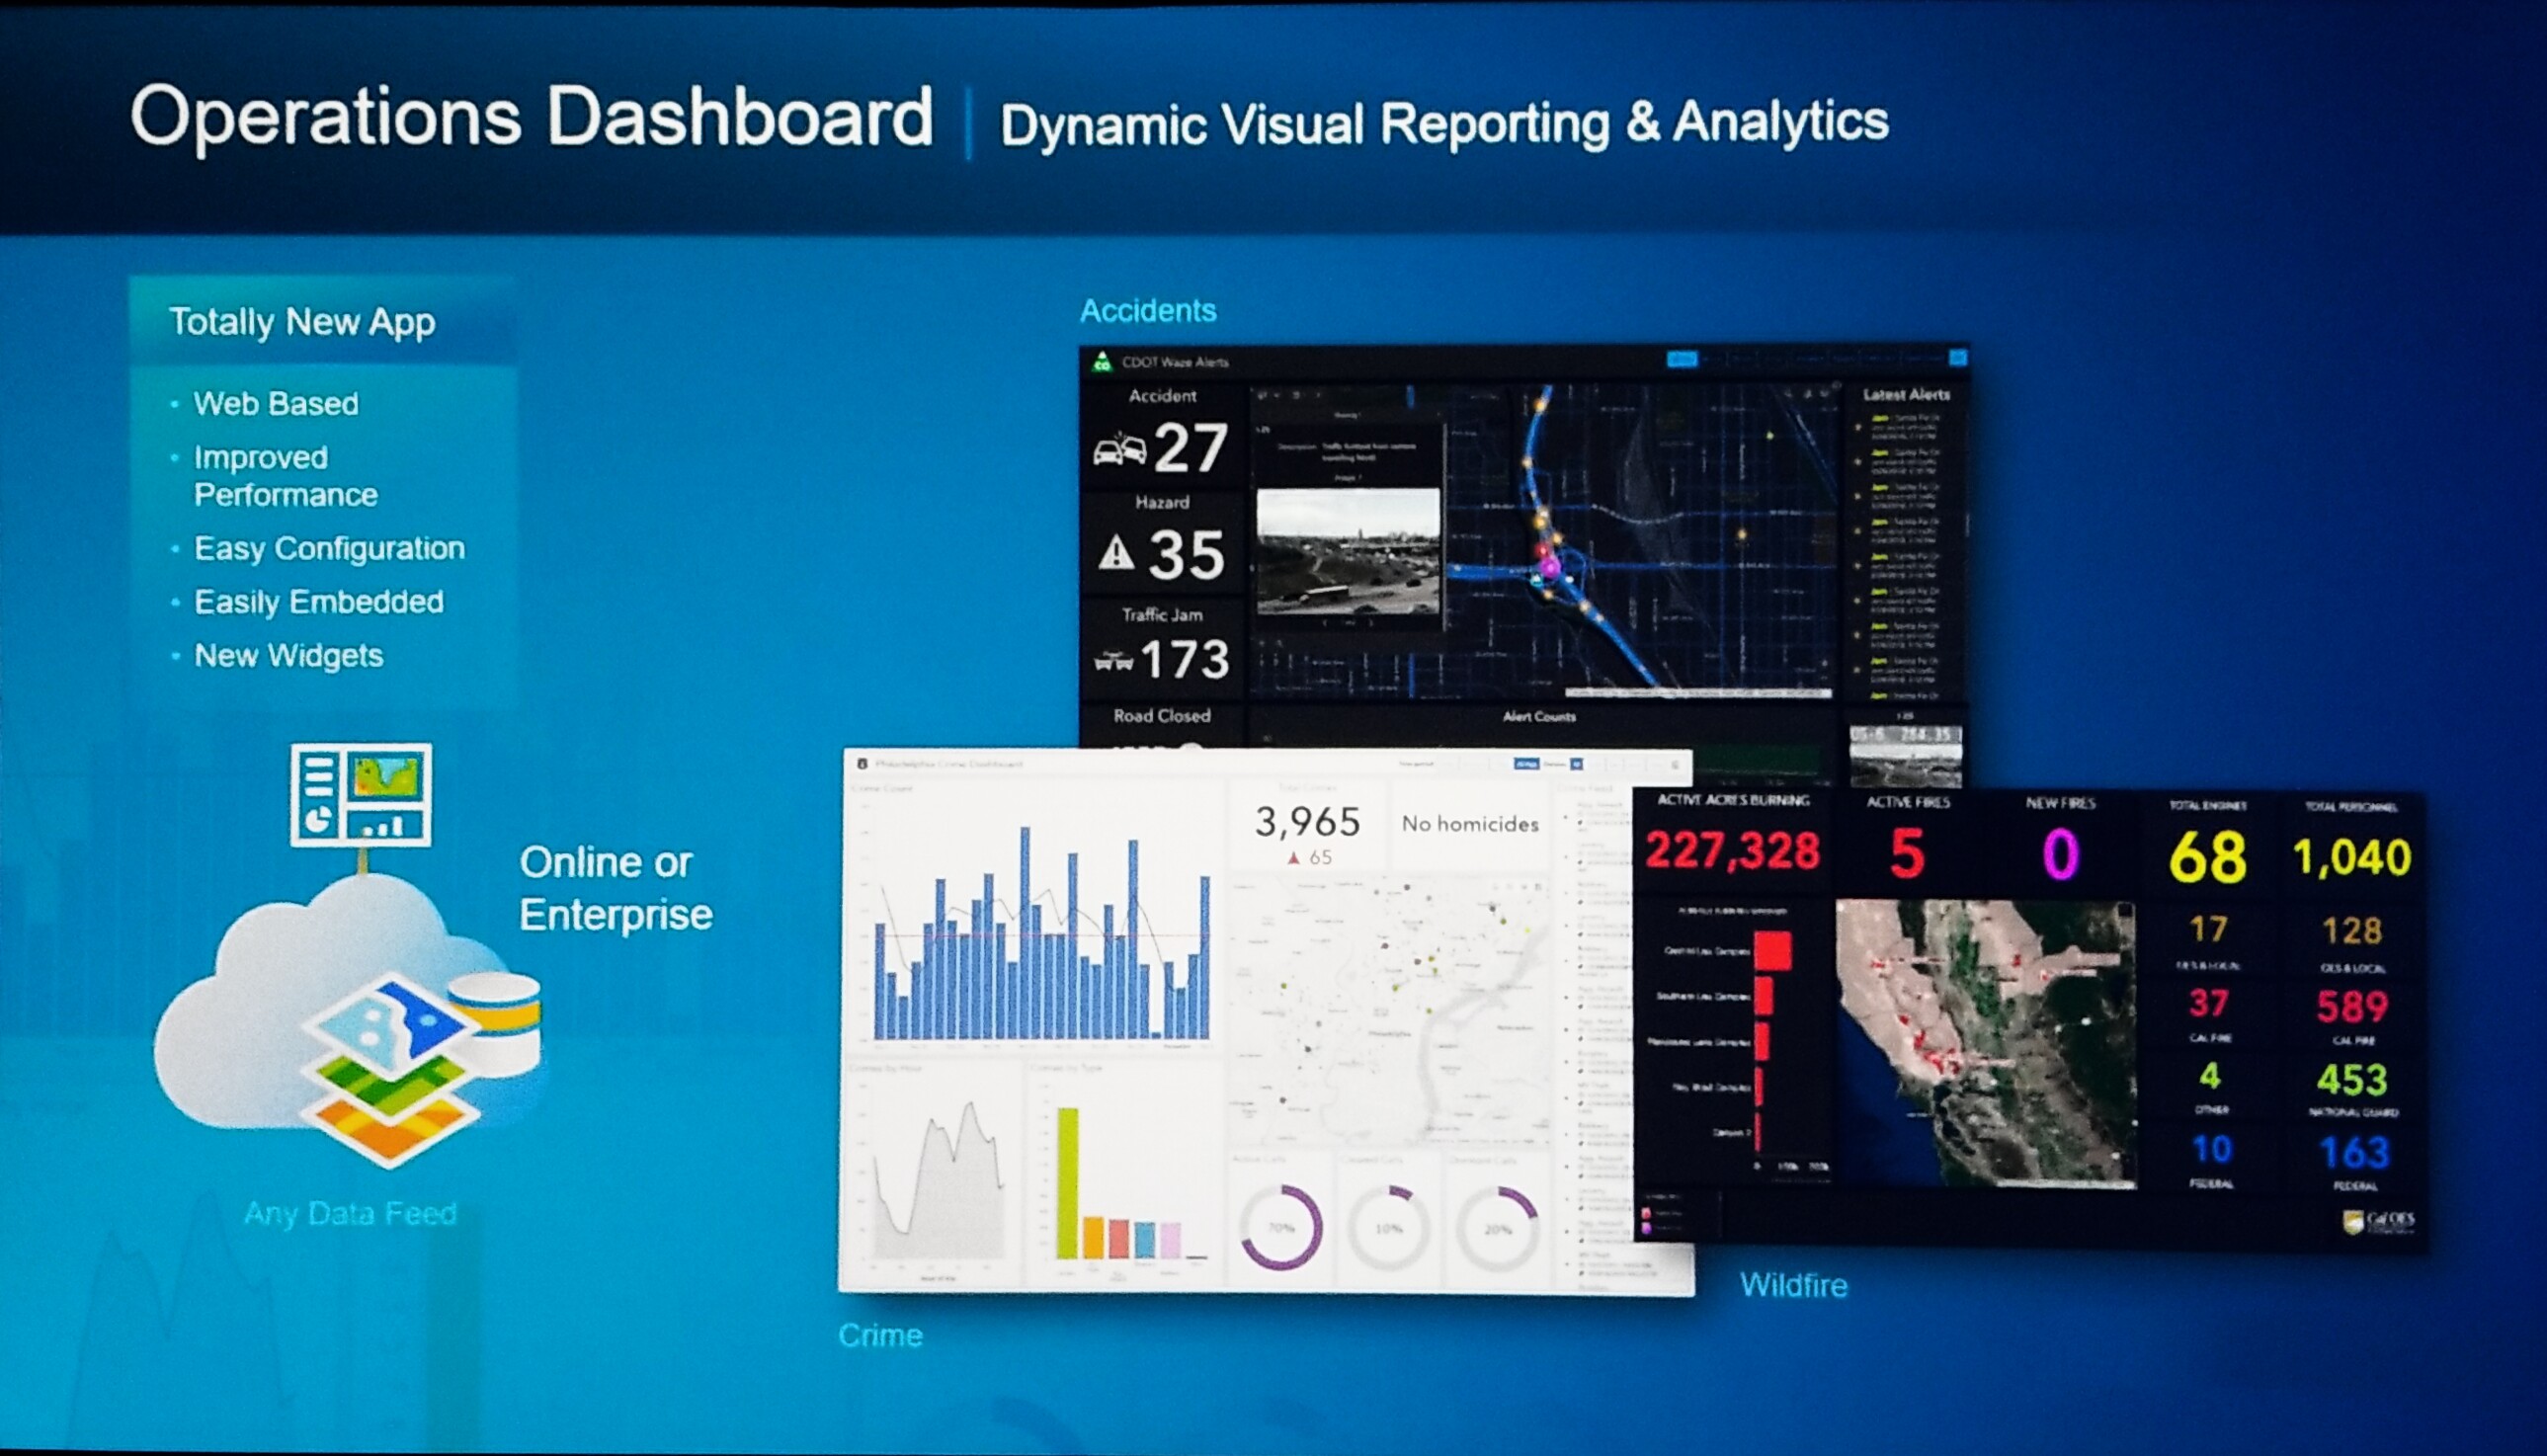
Operations Dashboard for ArcGIS

Operations Dashboard

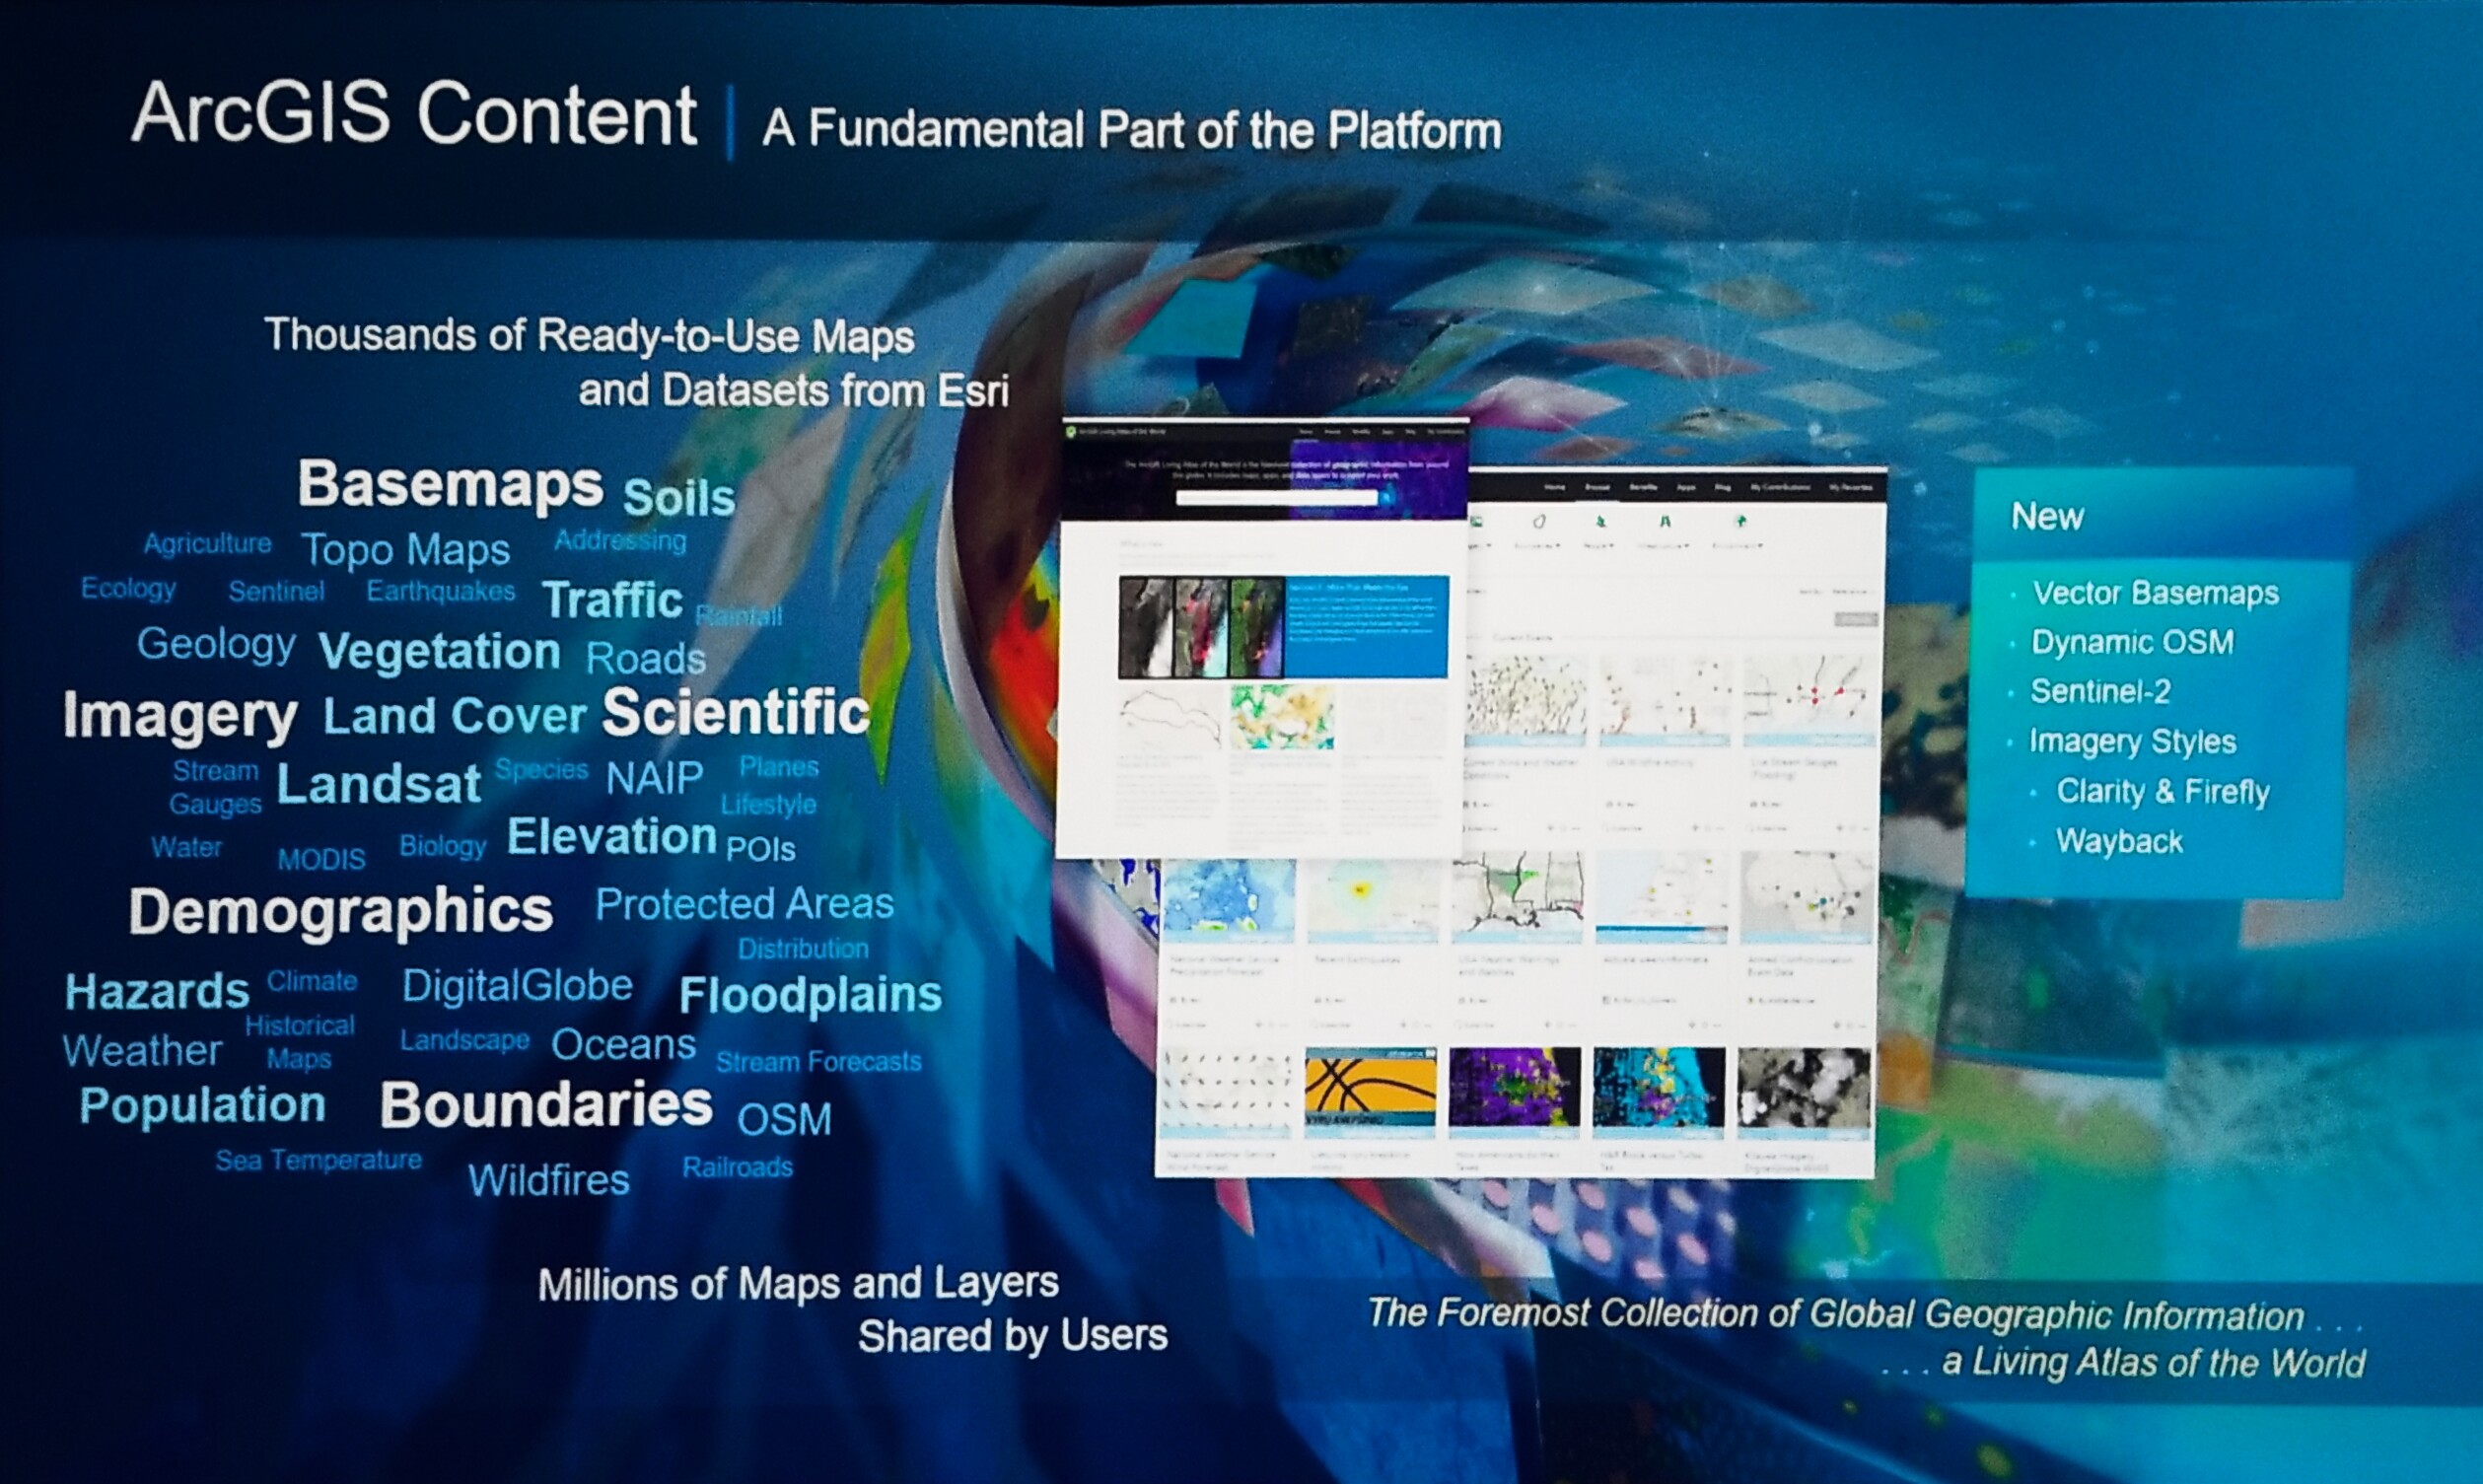
ArcGIS Content - basemaps, imagery, demographics, shared by everyone

ArcGIS Content

9:33 a.m. - Earth Information System

Speaker: Bernie Szukalski, Esri


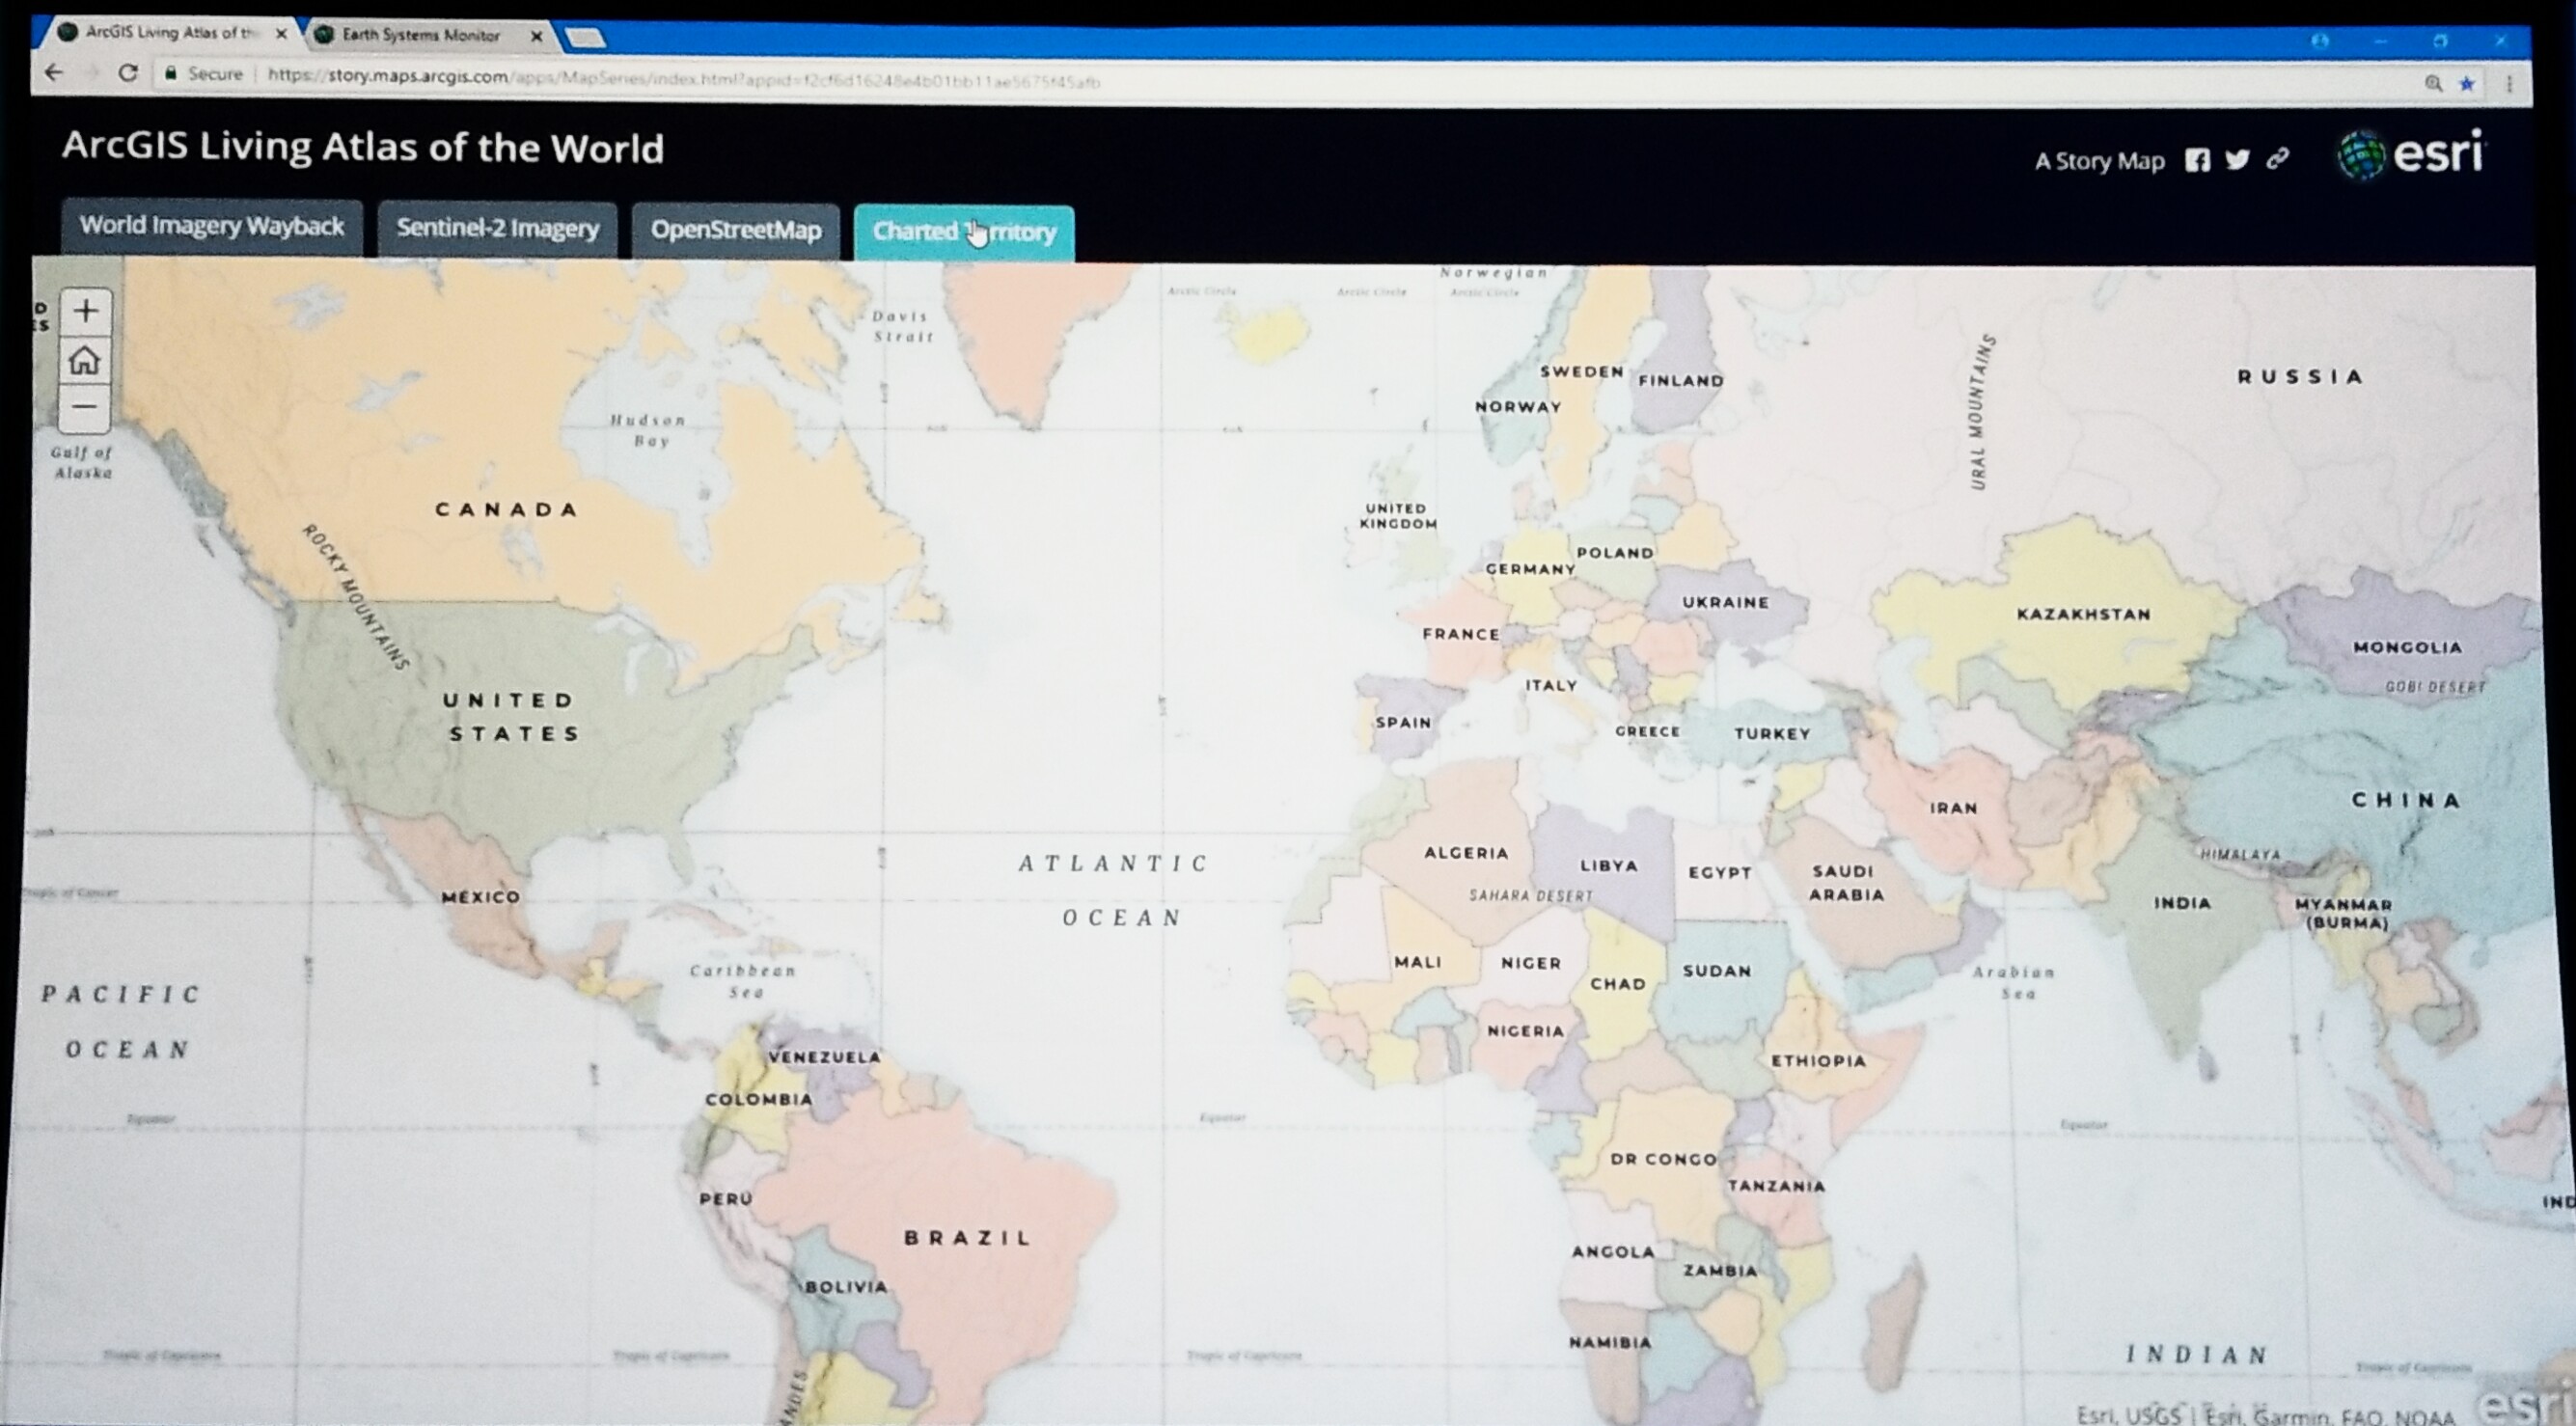
Jack introduces Bern Szukalski to talk about the ArcGIS Living Atlas of the World. The Living Atlas is always evolving. Bern’s demonstration shows the World Imagery Way-back application to create layers of imagery that show a progression of a map.

Living Atlas

He also demonstrates a map using the Sentinel-2 Imagery, OpenStreetMap and Chart Territory. 

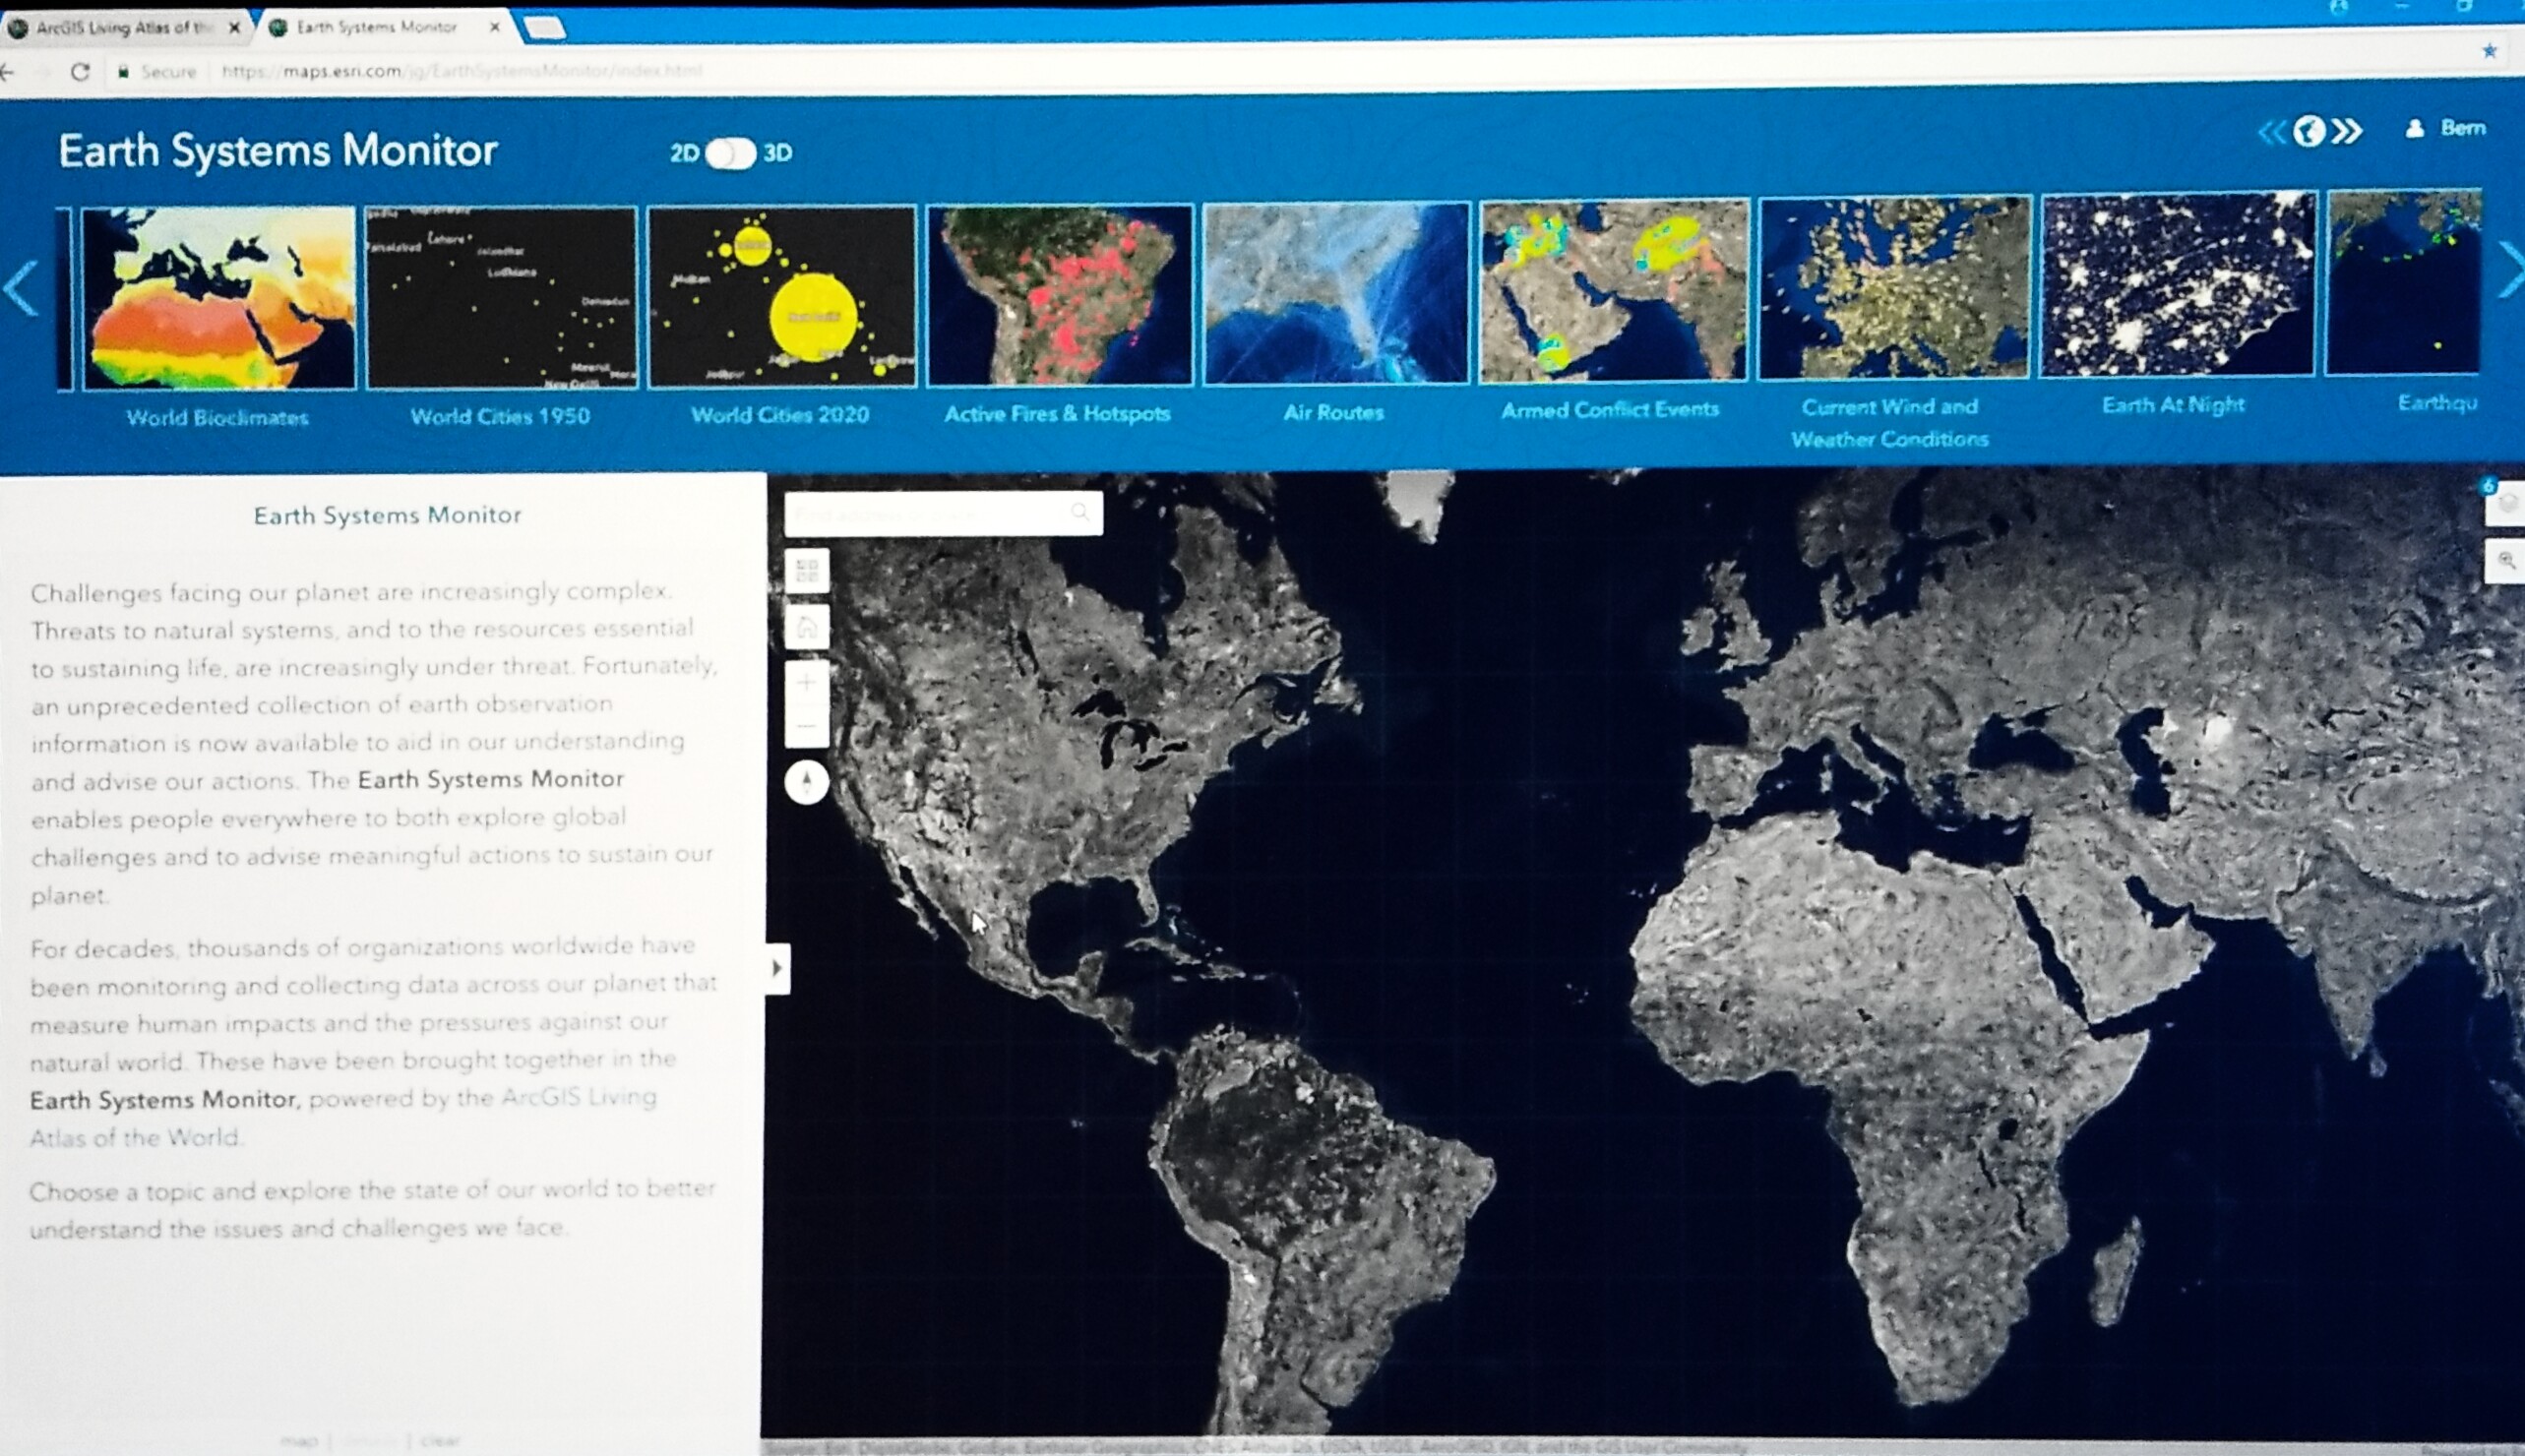
He wraps it up with the Earth Systems Monitor. We can see history, forecasting, real-time data for land, ocean, and even the human footprint, taking the 2D map and turning it into a 3D map of the globe.

Living Atlas 3D

Written by Matt Ball

Wayback imagery is a digital archive of the World Imagery basemap, enabling users to access more than 80 different versions of World Imagery captured over the past five years. Each record in the archive represents a version of World Imagery as it existed on the date it was published. We can move forward and back in time and choose the imagery you want to use. Learn more about the Wayback App in this ArcGIS Blog post.

Sentinel 2 Sentinel-2 is now part of the ArcGIS Living Atlas of the World. Sentinel-2 image service, powered by ArcGIS Image Server, includes daily updates, all Sentinel-2 imagery going back 14-months, and includes 13 bands of information. Image analysis can be applied to create image indices that show properties such as vegetation health or soil moisture as well as quantifying changes over time. Read more about Sentinel-2 imagery in this ArcGIS Blog post.

The ArcGIS Vector Tile Style Editor gives you a fast and easy way to create a custom basemap style that matches your brand and the type of app that you are building. Read this ArcGIS Blog post to learn more about the ArcGIS Vector Tile Style Editor.

9:35 a.m. Our Work

Speaker: Jack Dangermond


Jack shares more with a focus on Smart Mapping enabling everyone to make maps. The audience claps.


Mapping and Cartography with improvements in tools and technology with symbology and annotation.

Mapping and Charting


3D Mapping and Visualization

Mobile device and Web 

3D Analysis more than visualization - Analytics, Volumetrics, Apps 


Real-time analytics – improvements

Real-Time & Big Data GIS


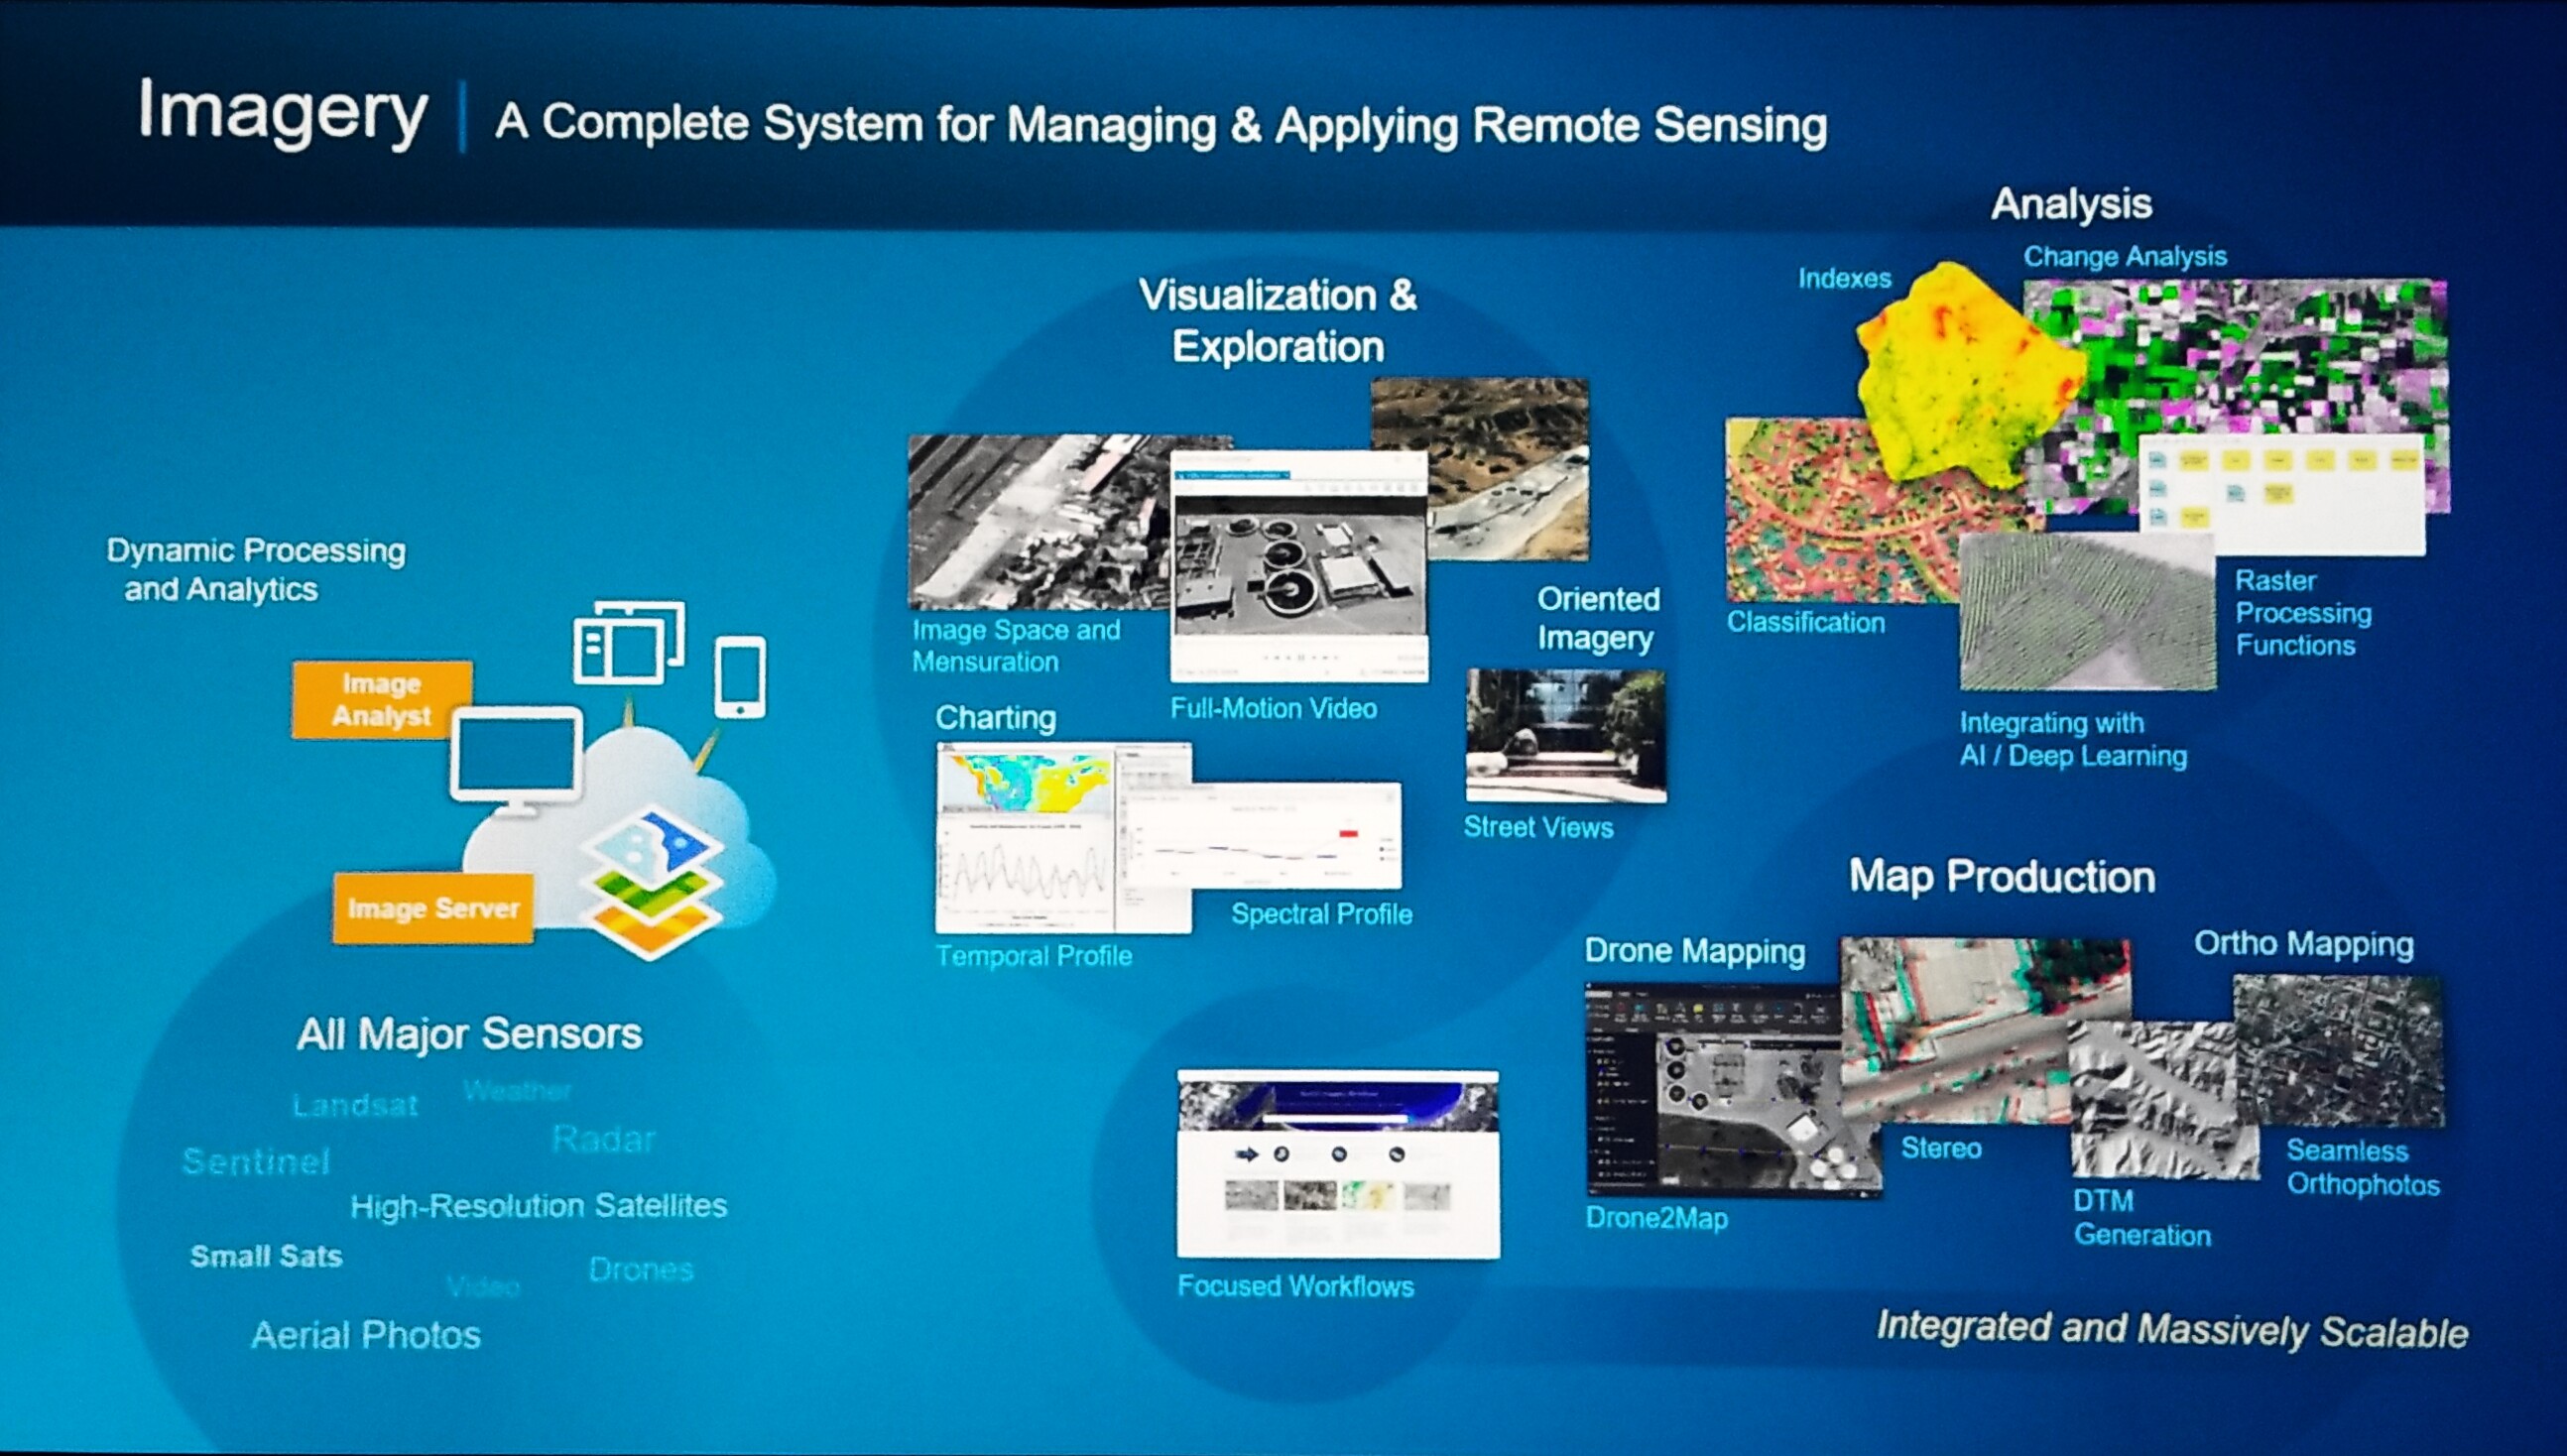
Imagery - A complete system

Imagery and Remote Sensing

ArcGIS Imagery

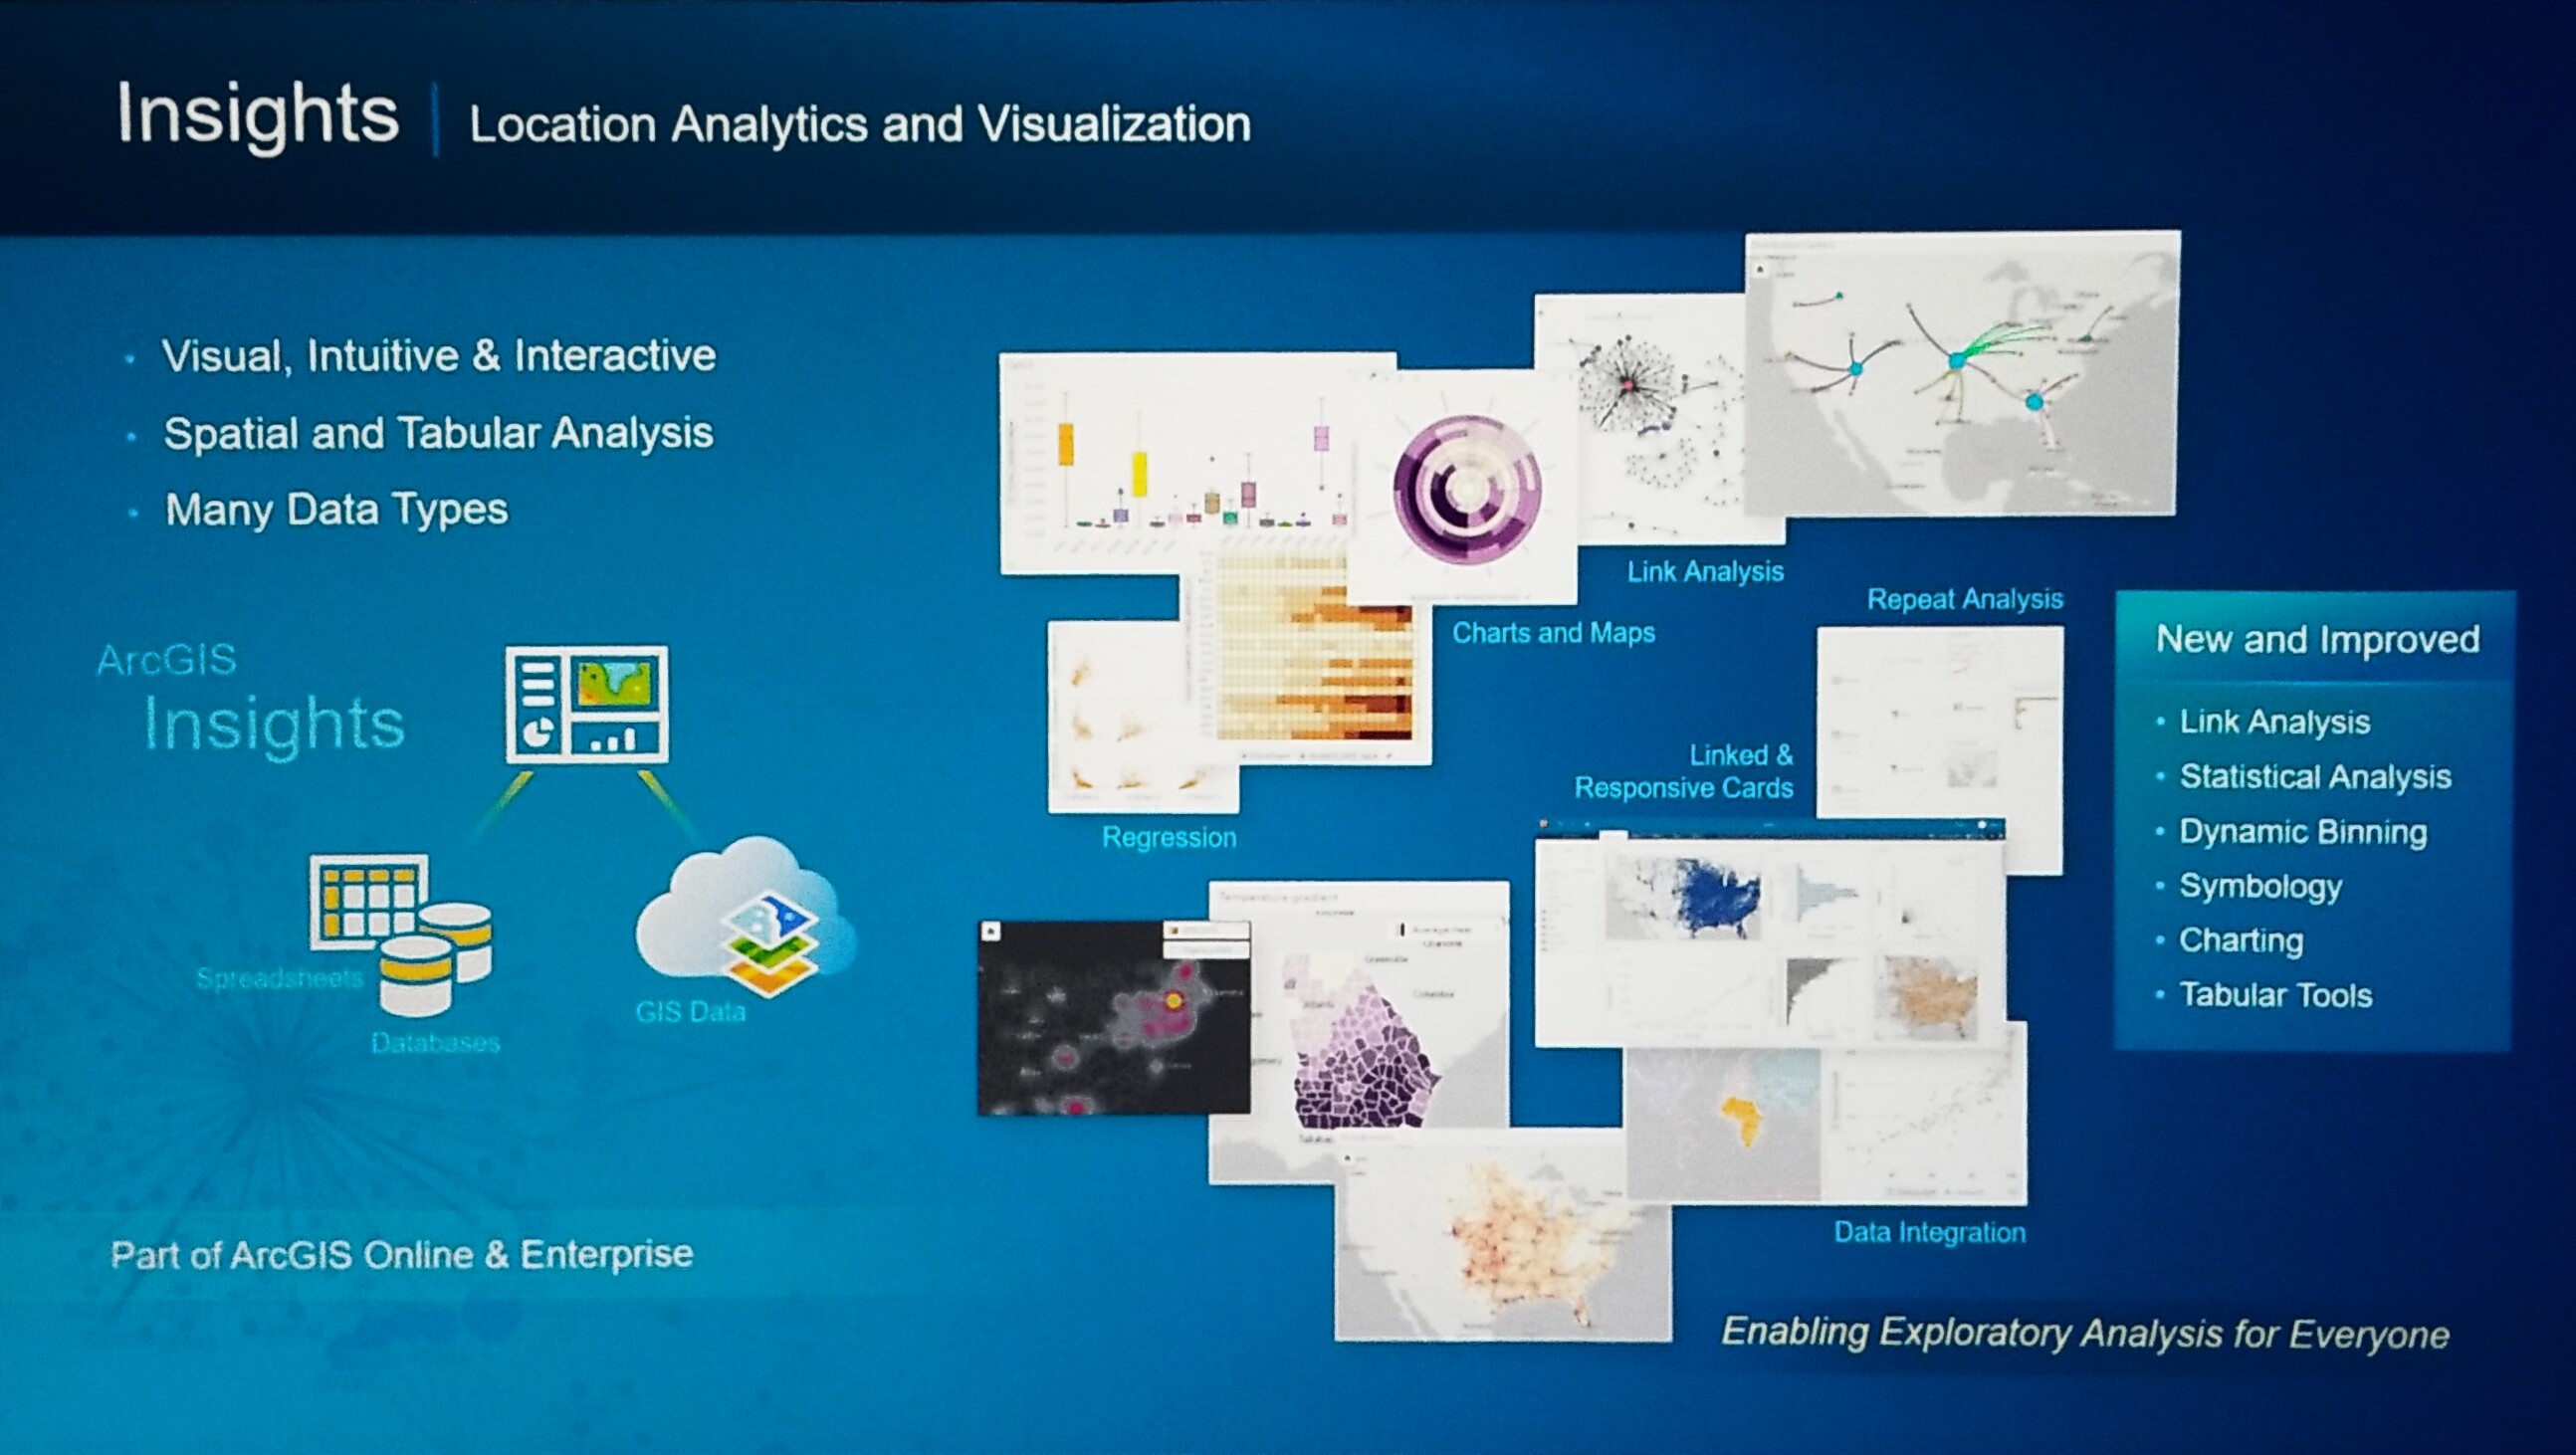
Insights for ArcGIS takes us further.

ArcGIS Insights

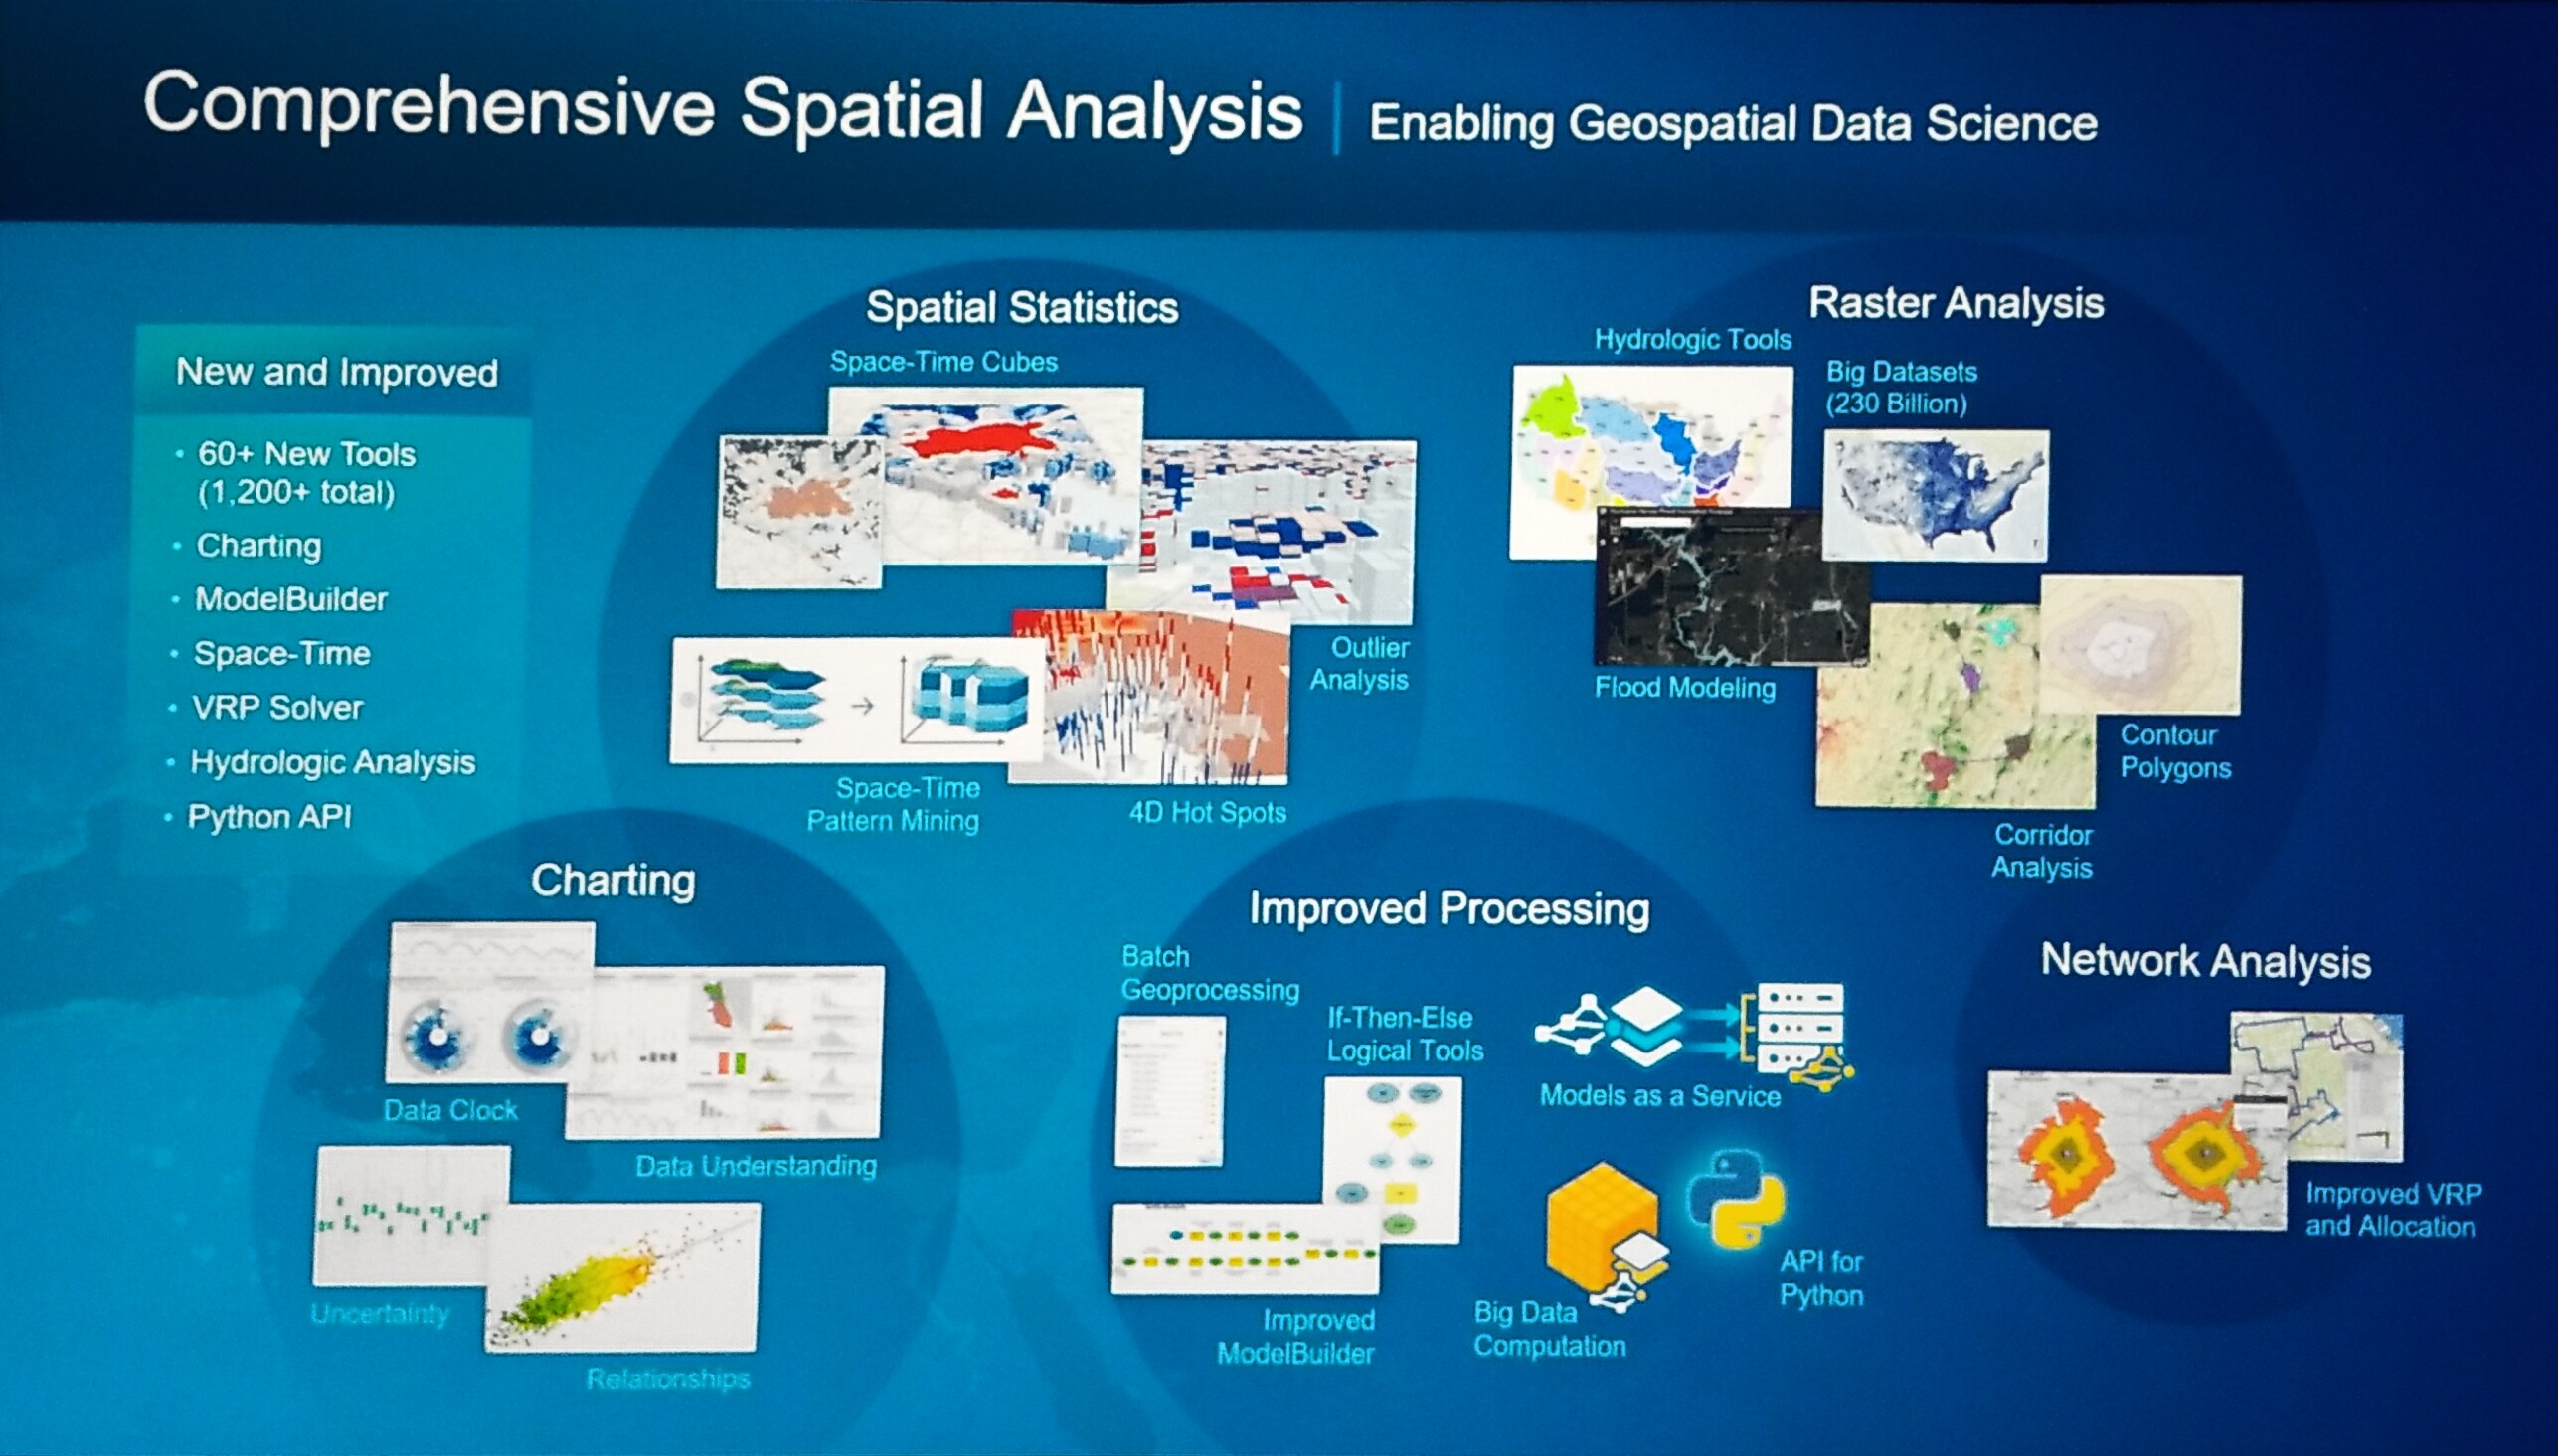
Comprehensive Spatial Analysis - enabling geospatial data science

Spatial statistics, Raster Analysis, Charting, Improved Processing, Network Analysis

comprehensive analytics

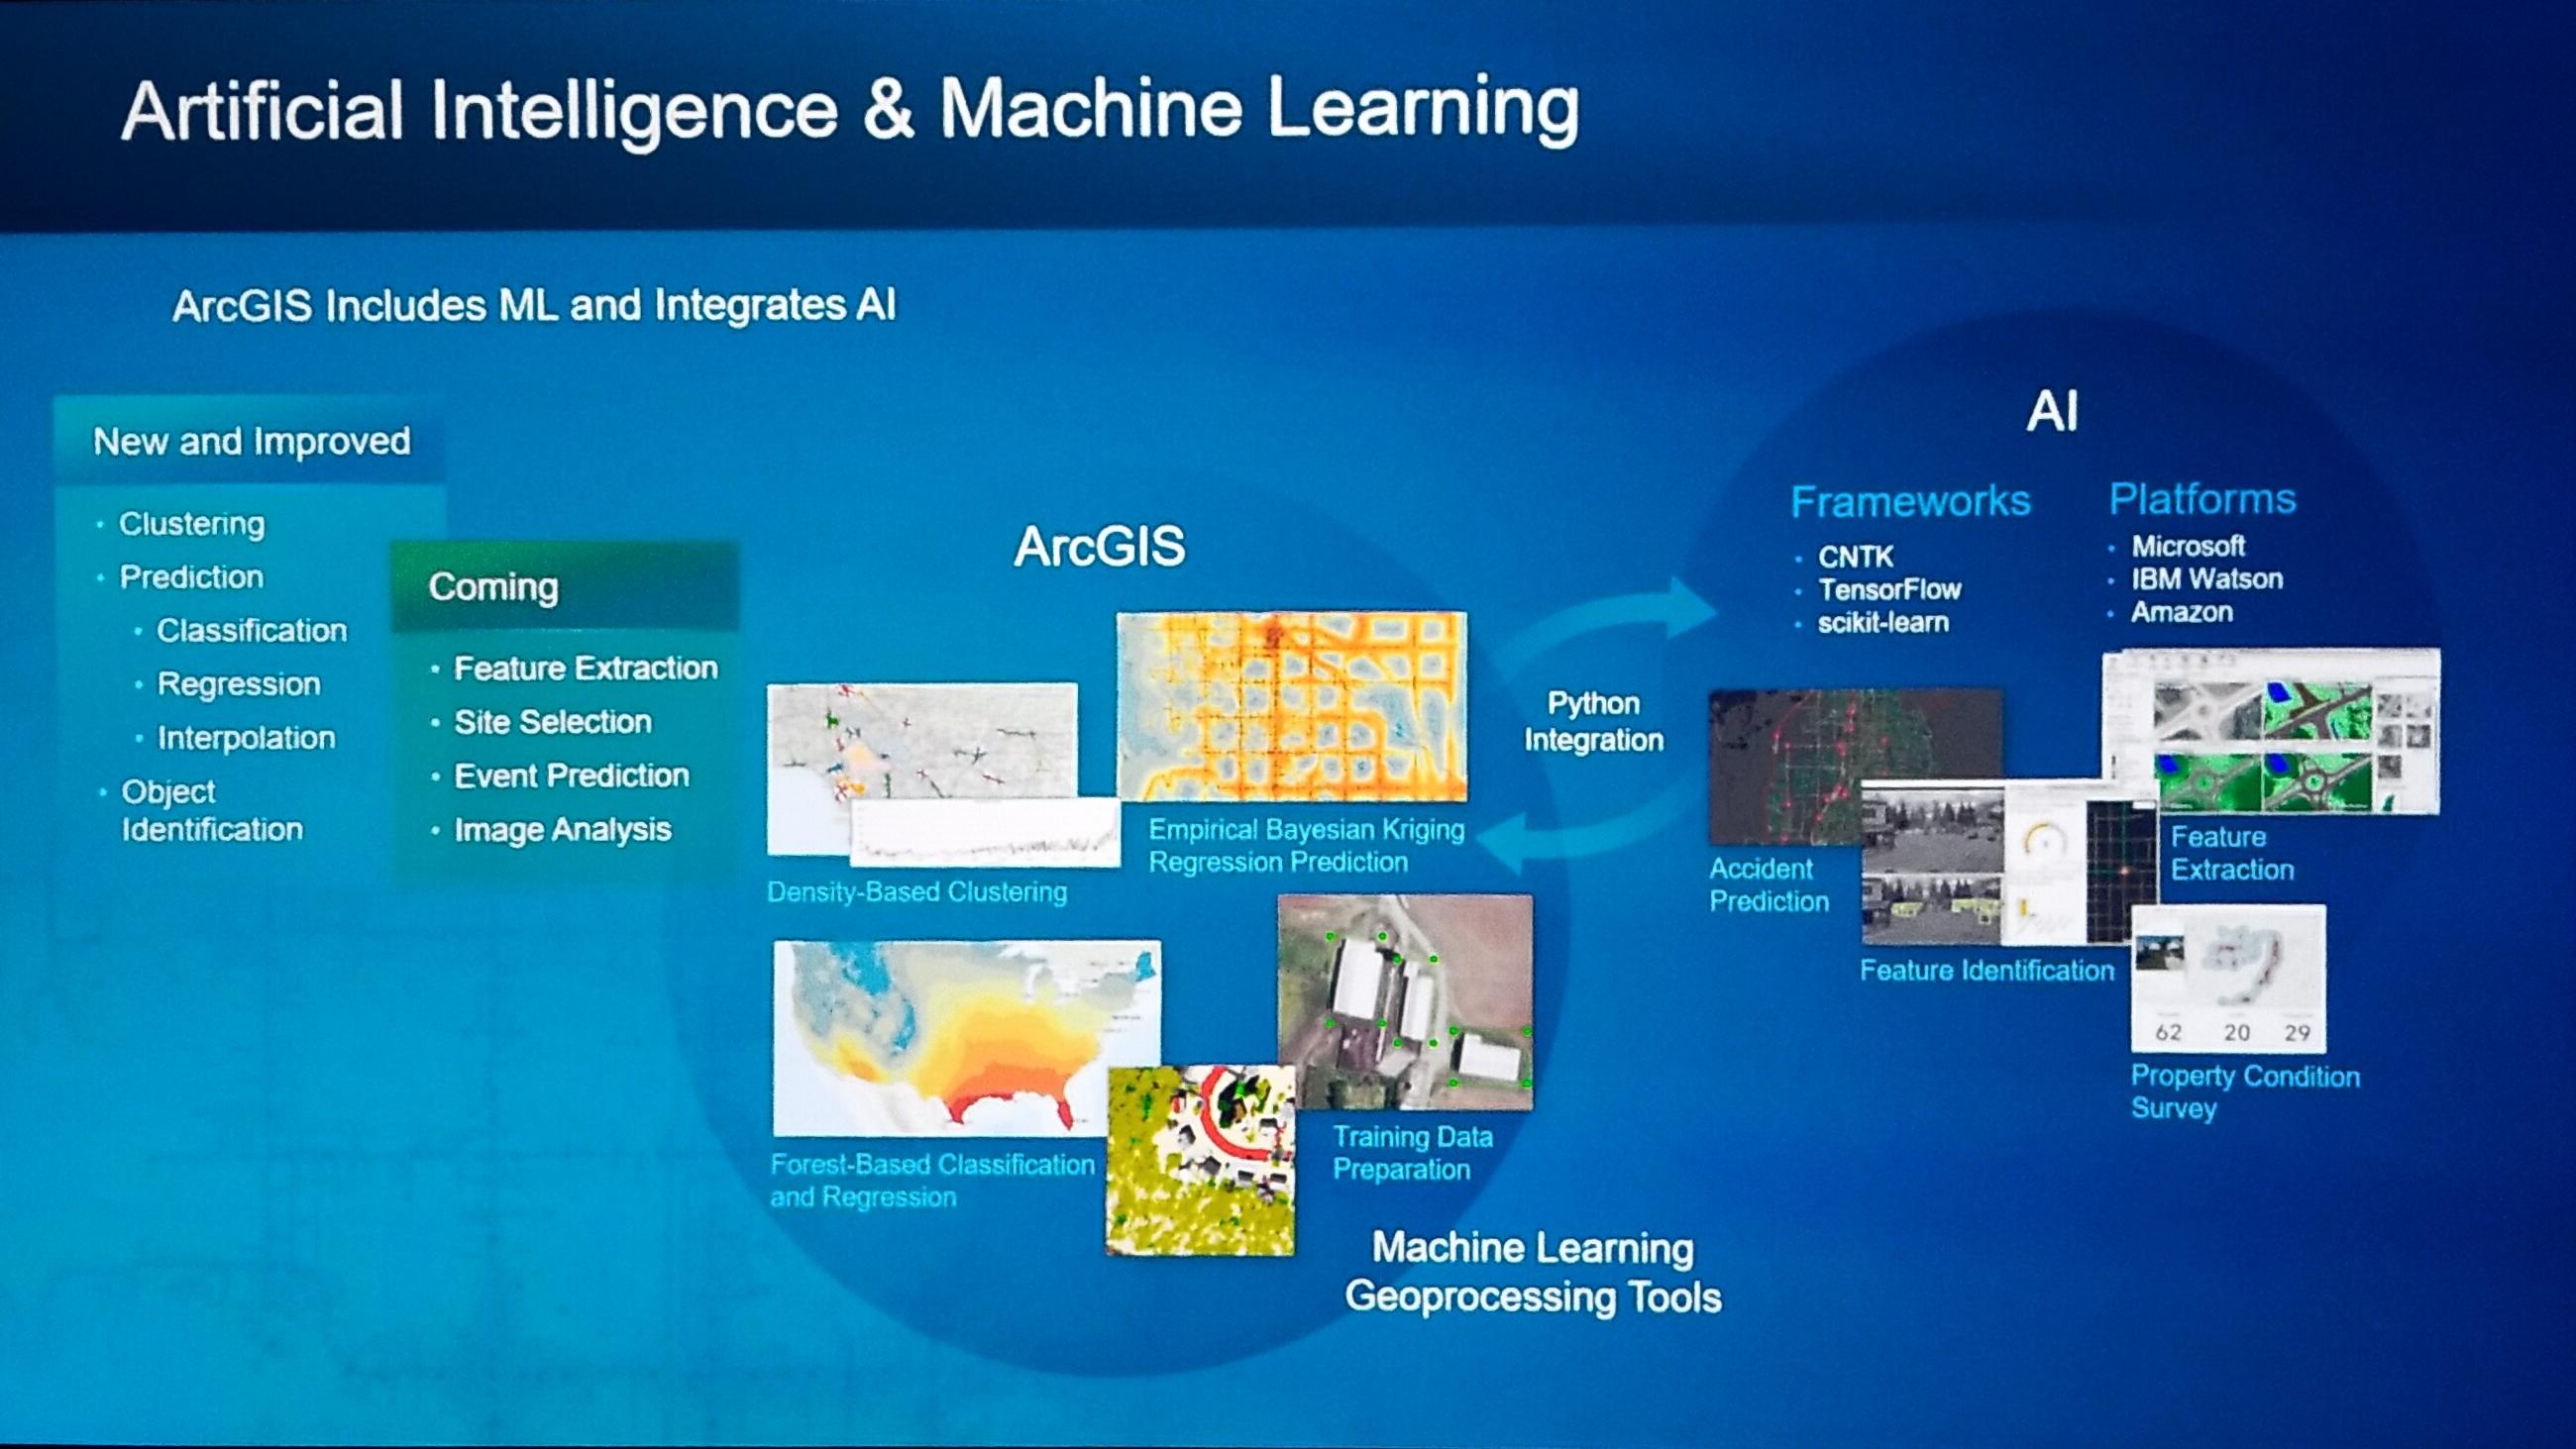
Artificial Intelligence and Machine Learning

Geoprocessing tools, integration

AI & Machine Learning

9:43 a.m. - ArcGIS Pro Machine Learning & Analysis

Lauren Bennett, Esri


We're infusing machine learning and AI in many aspects of GIS.

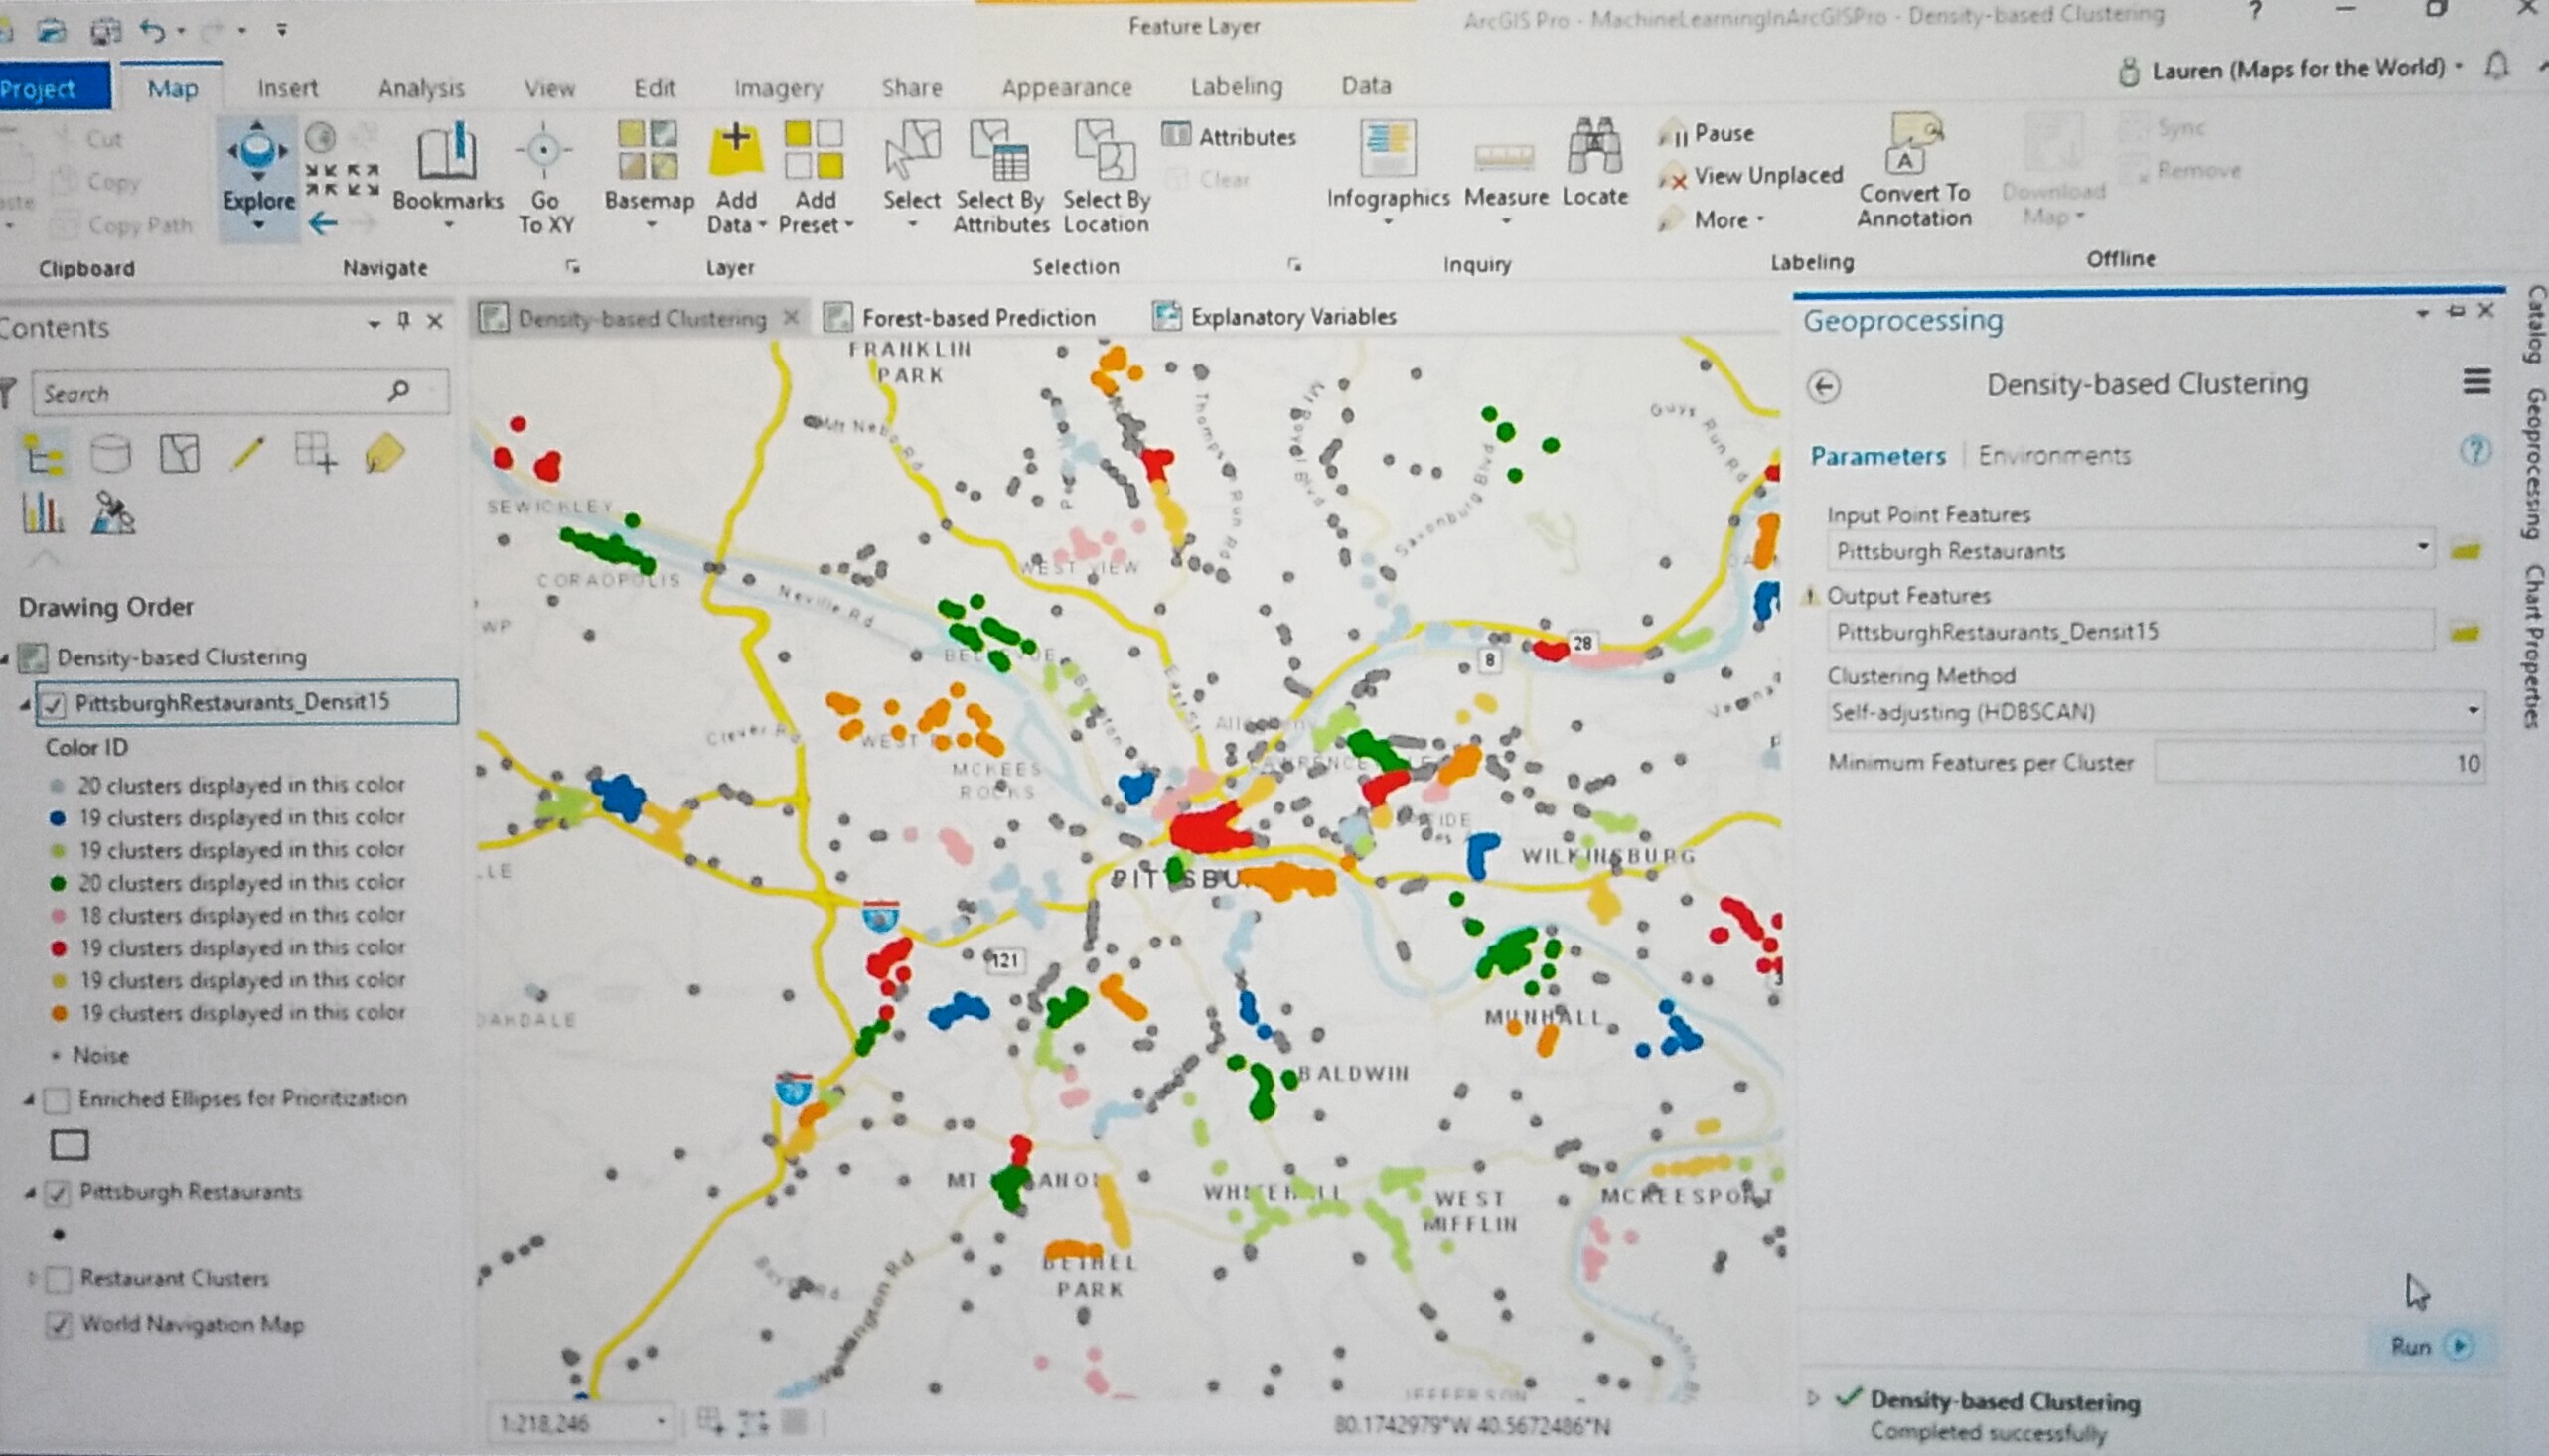
 Lauren - cluster maps

We've made it simple... giving a demonstration of density clustering to show machine learning. All we have to do is tell it what we think is a cluster.Lauren clustering map

Ones in color are clusters, the ones in gray are noise.


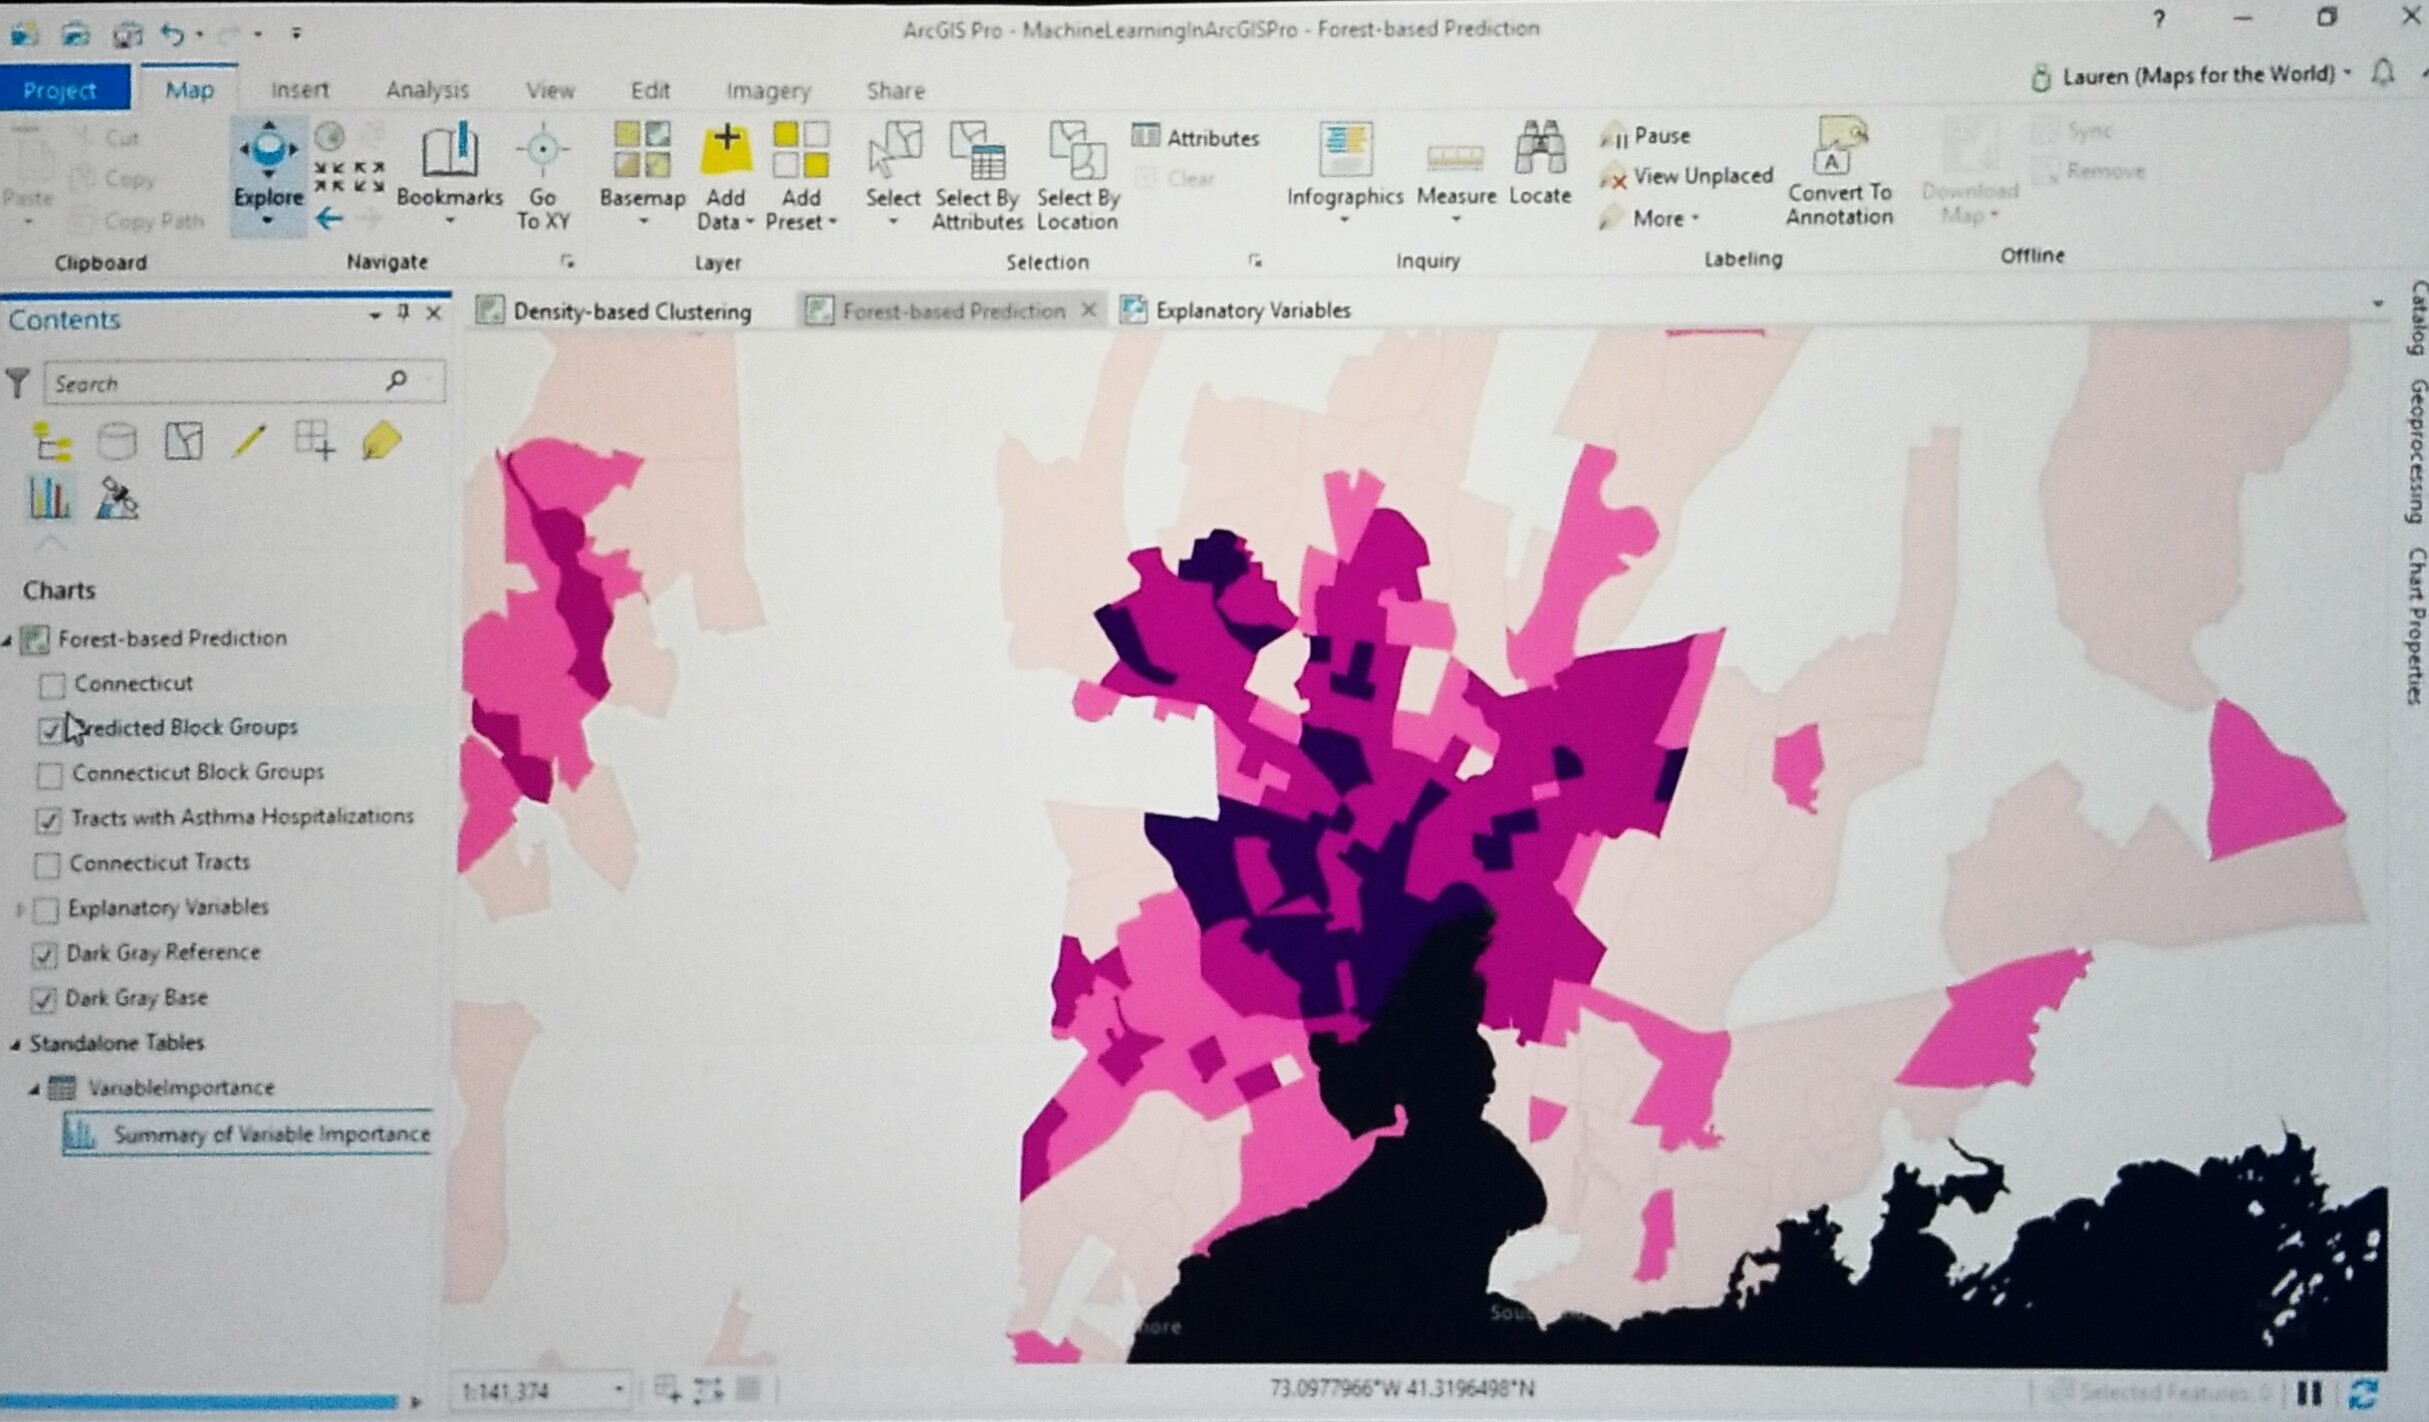
Using the forest-based prediction tool to measure Childhood asthma we can use it to predict the asthma hospitalization rate in block groups.

Childhood Asthma

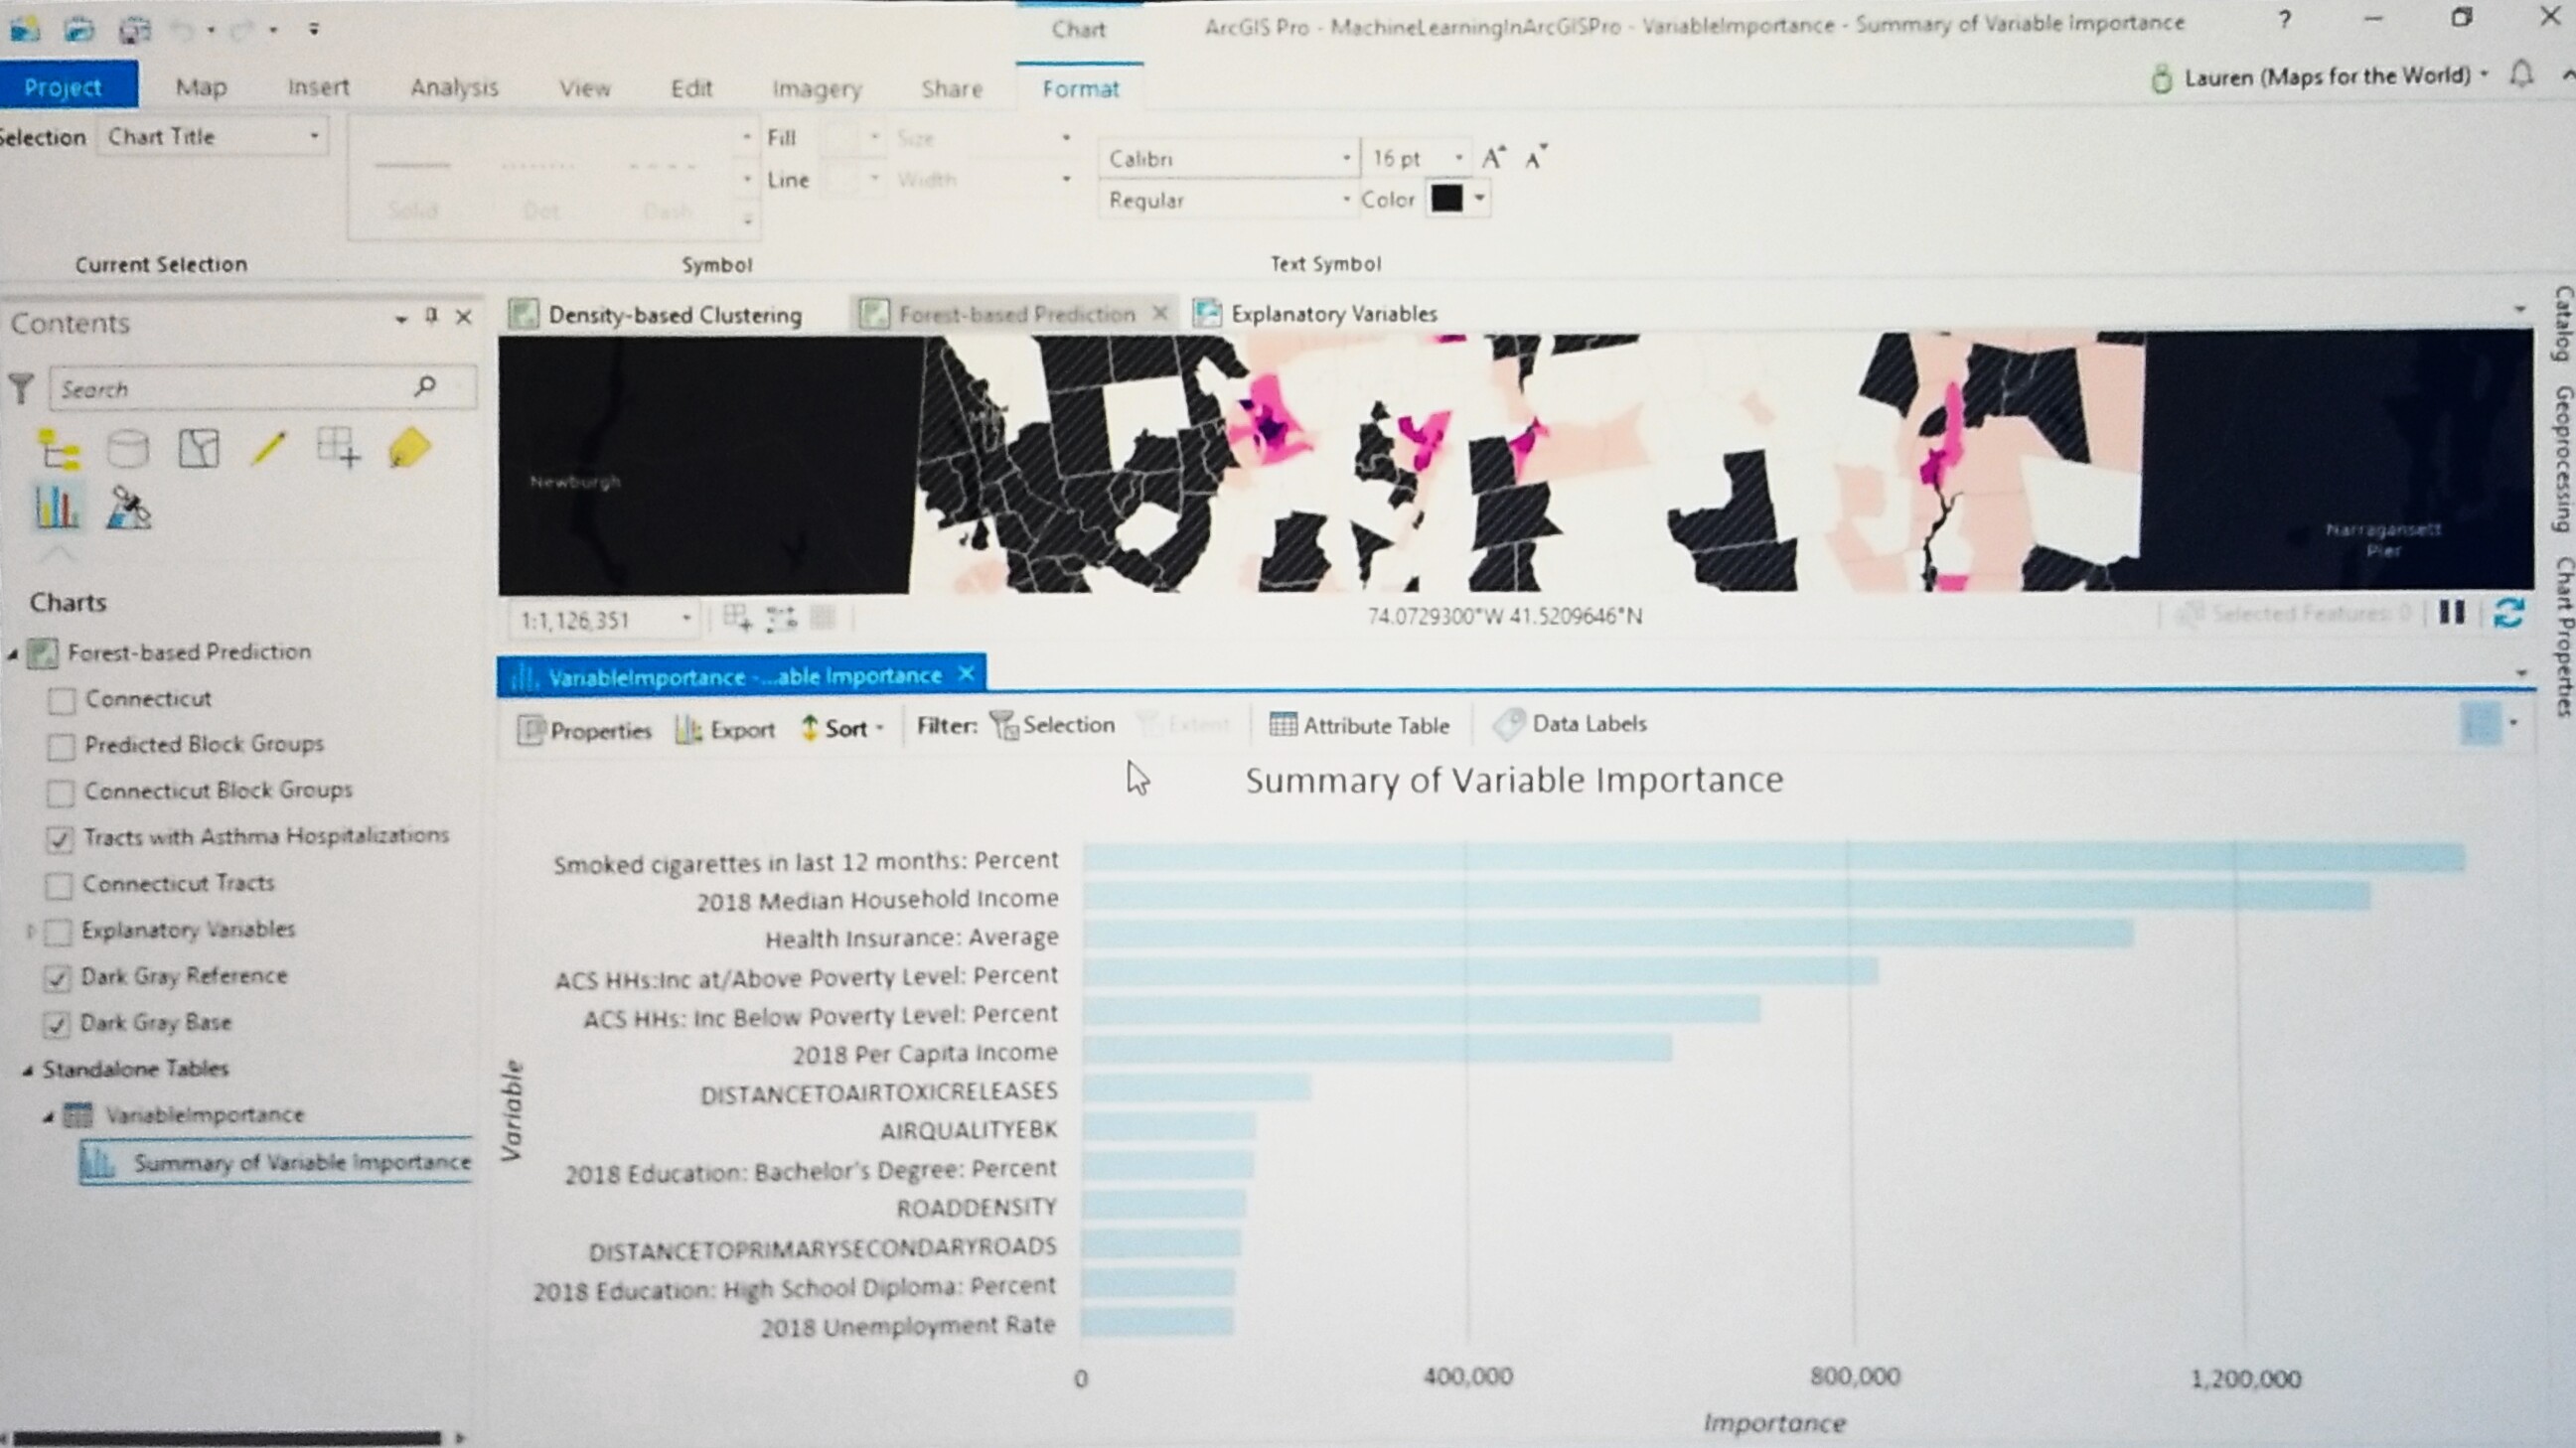
To train our Forest model – all we do is point it at an algorithm of clusters. Using R-squared, we are predicting with 80% accuracy.

Asthma variables

9:47 a.m. - Our Work – ArcGIS Hub, Indoors, Urban

ArcGIS Products

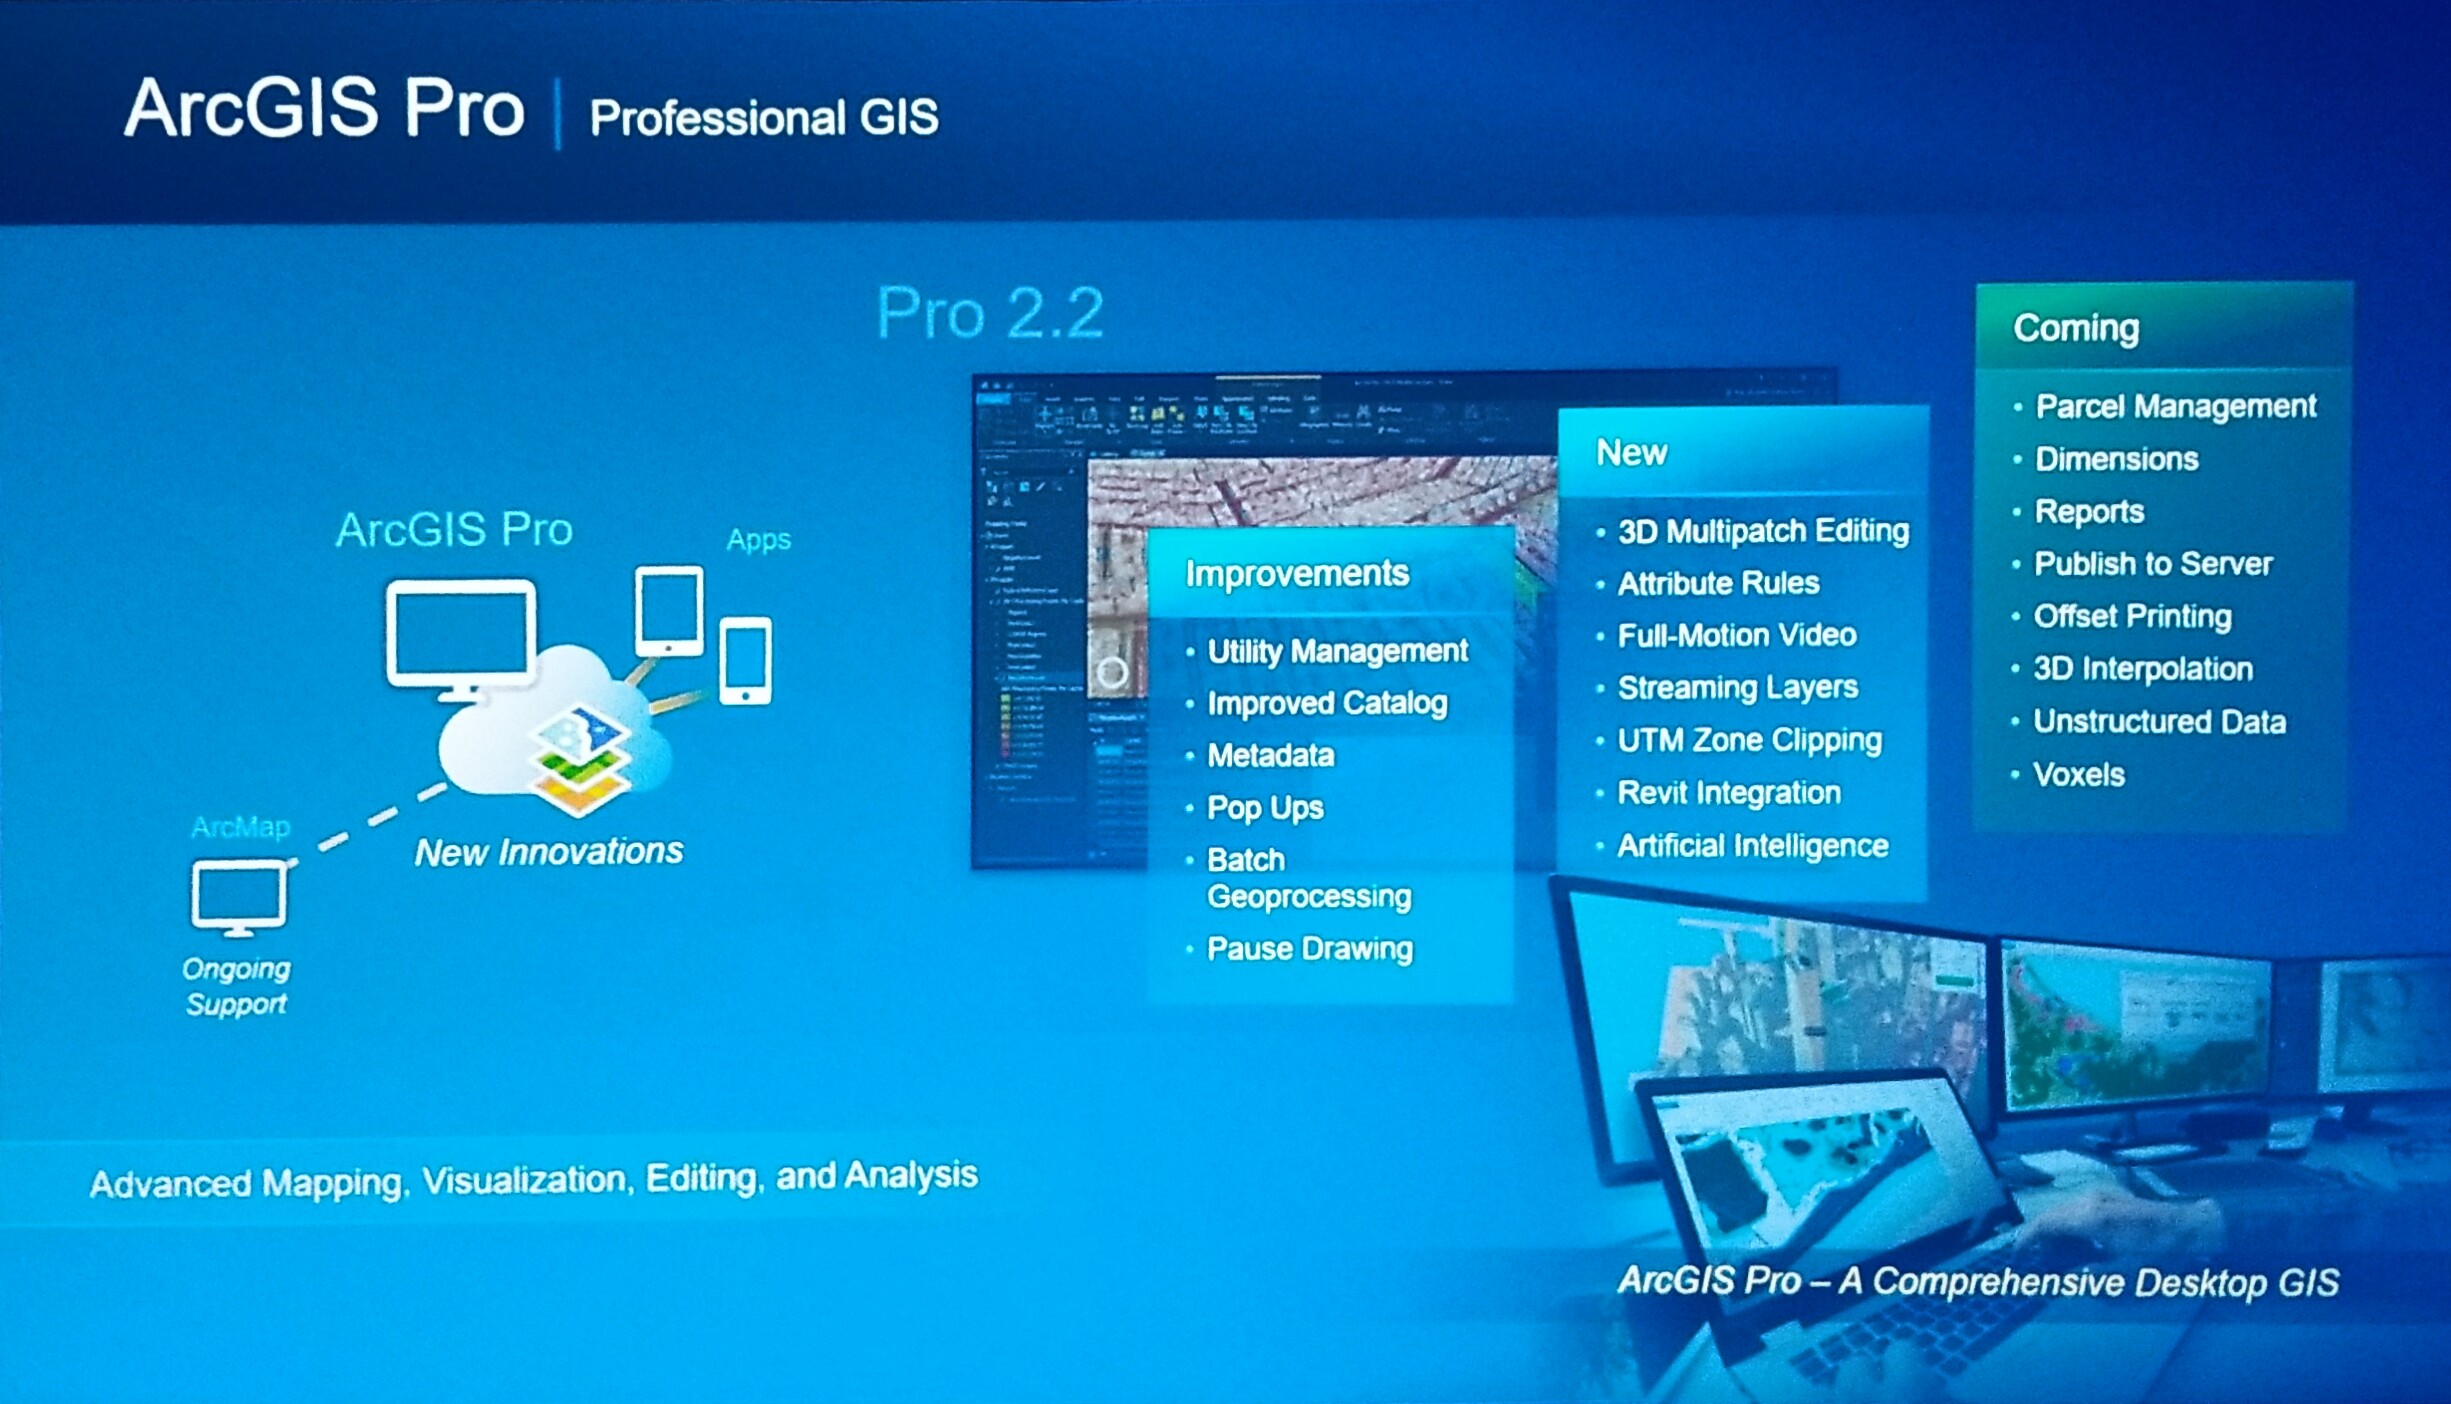
ArcGIS Pro - improvements, professional GIS, Pro 2.2

ArcGIS Pro 2.2


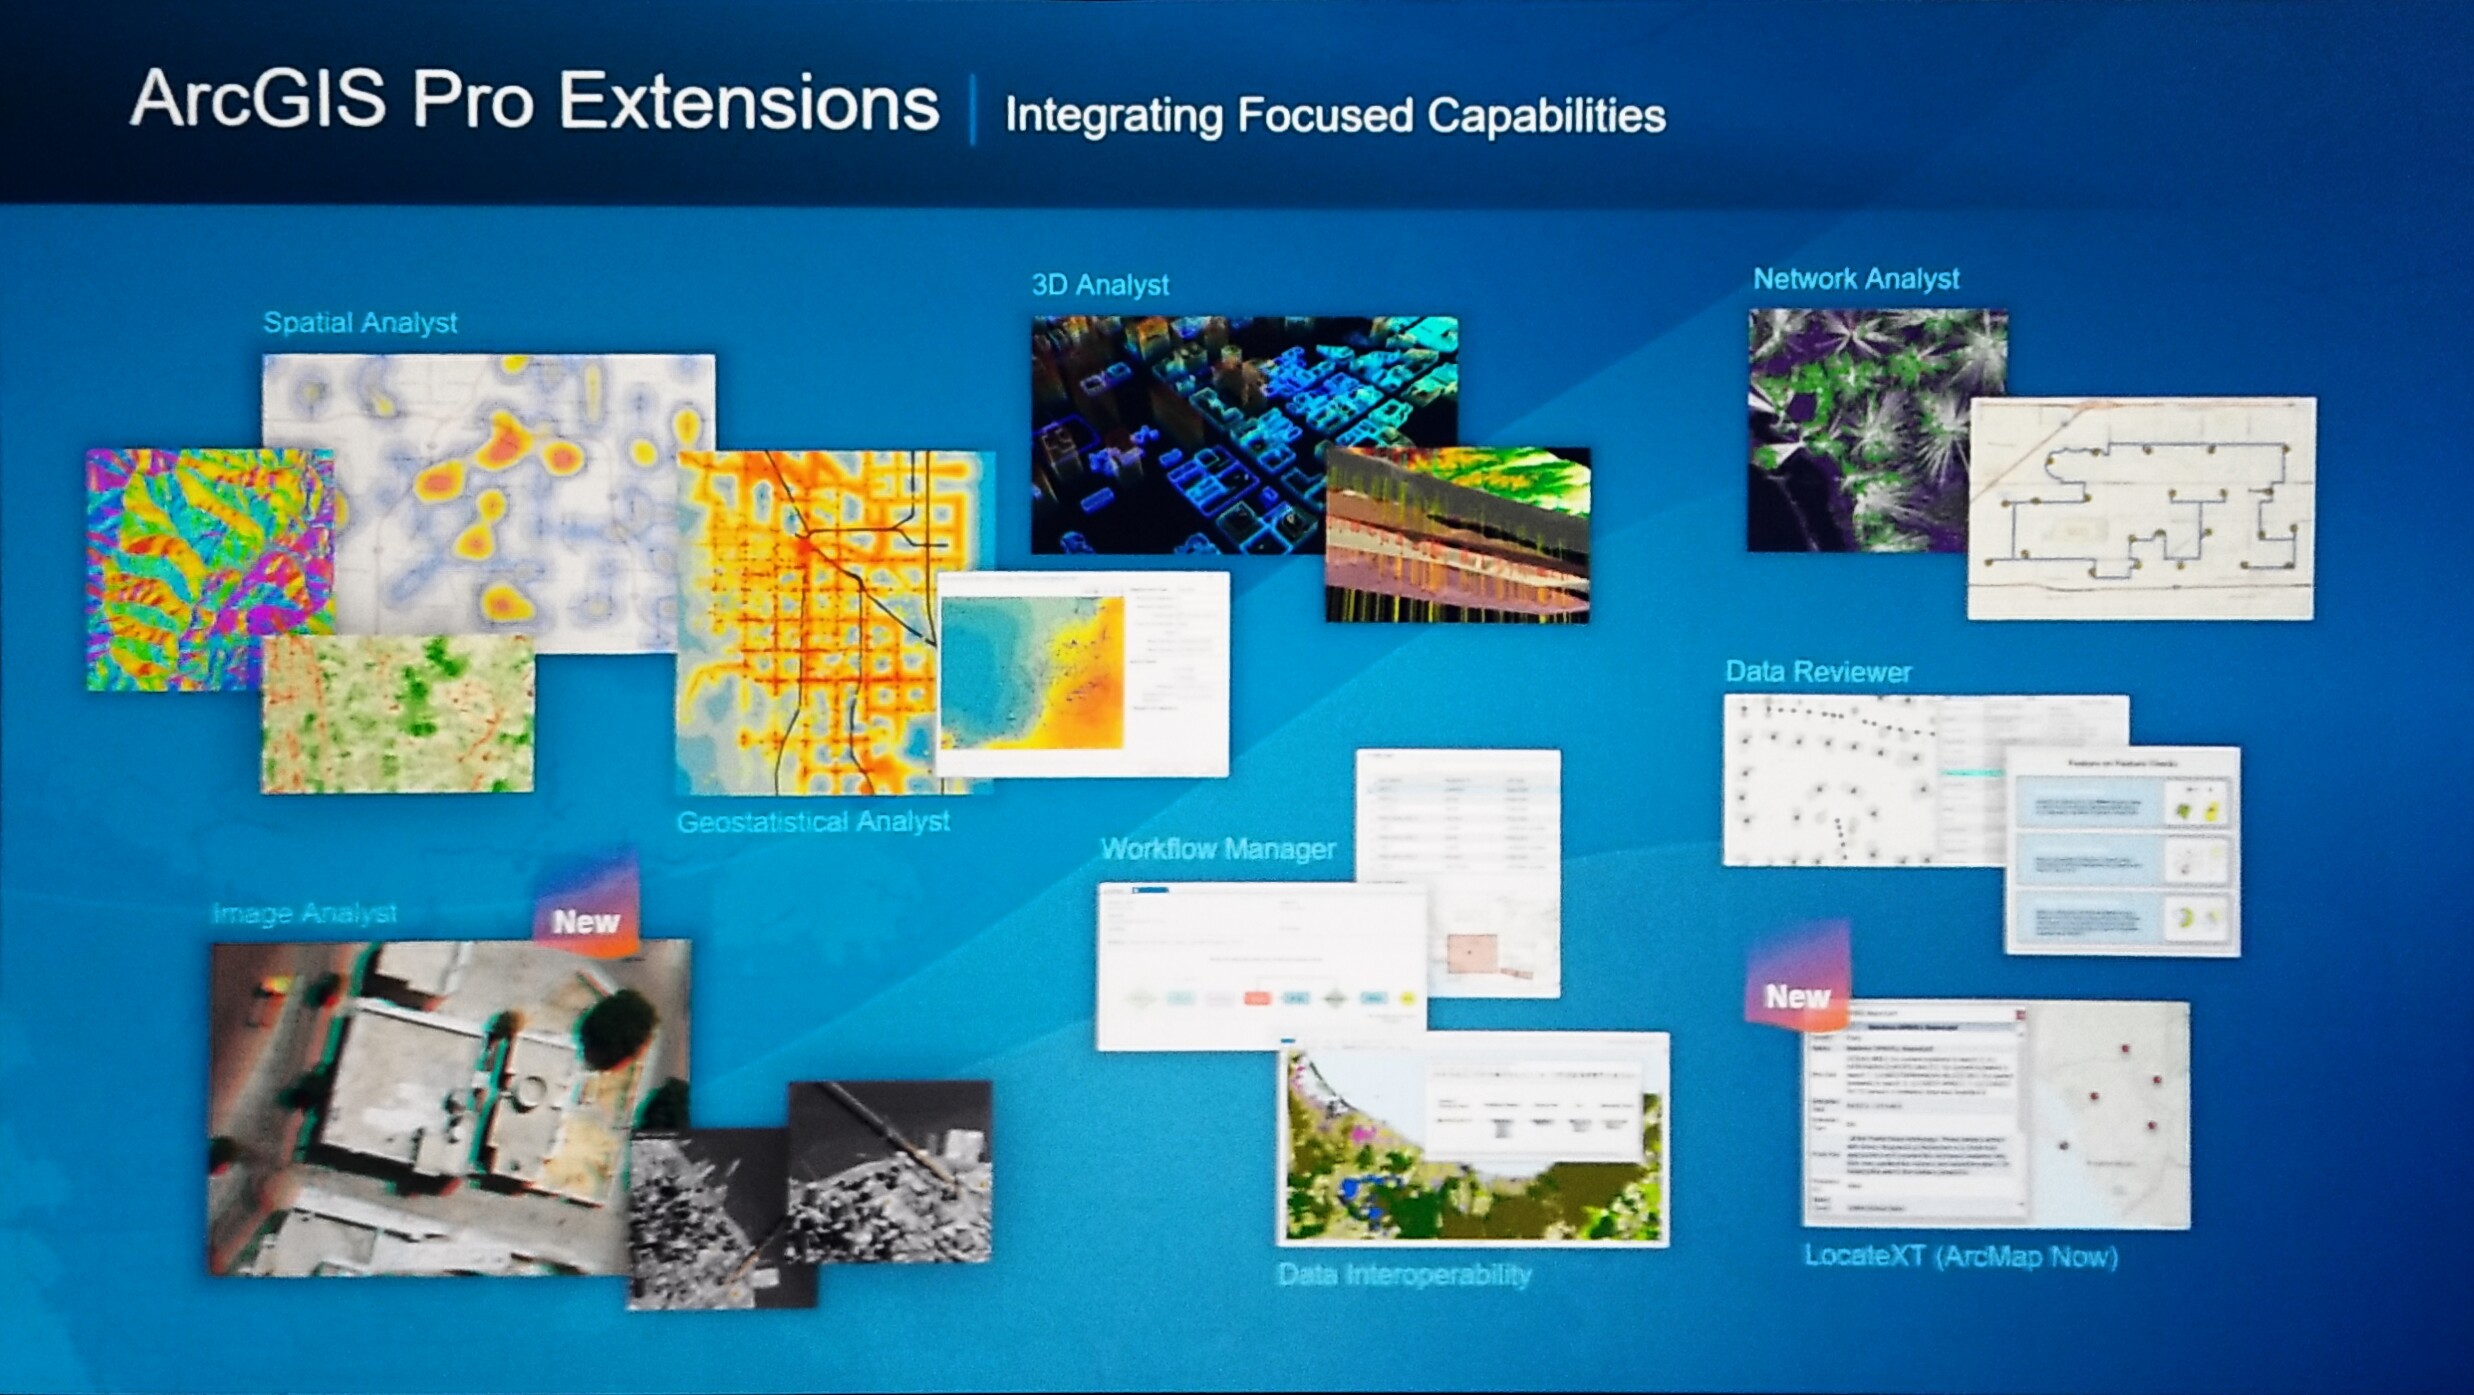
ArcGIS Pro Extensions – Integrating Focused Capabilities

New to ArcGIS Pro Extensions: Image Analyst and LocateXT (ArcMap Now) Pro later

ArcGIS Extensions


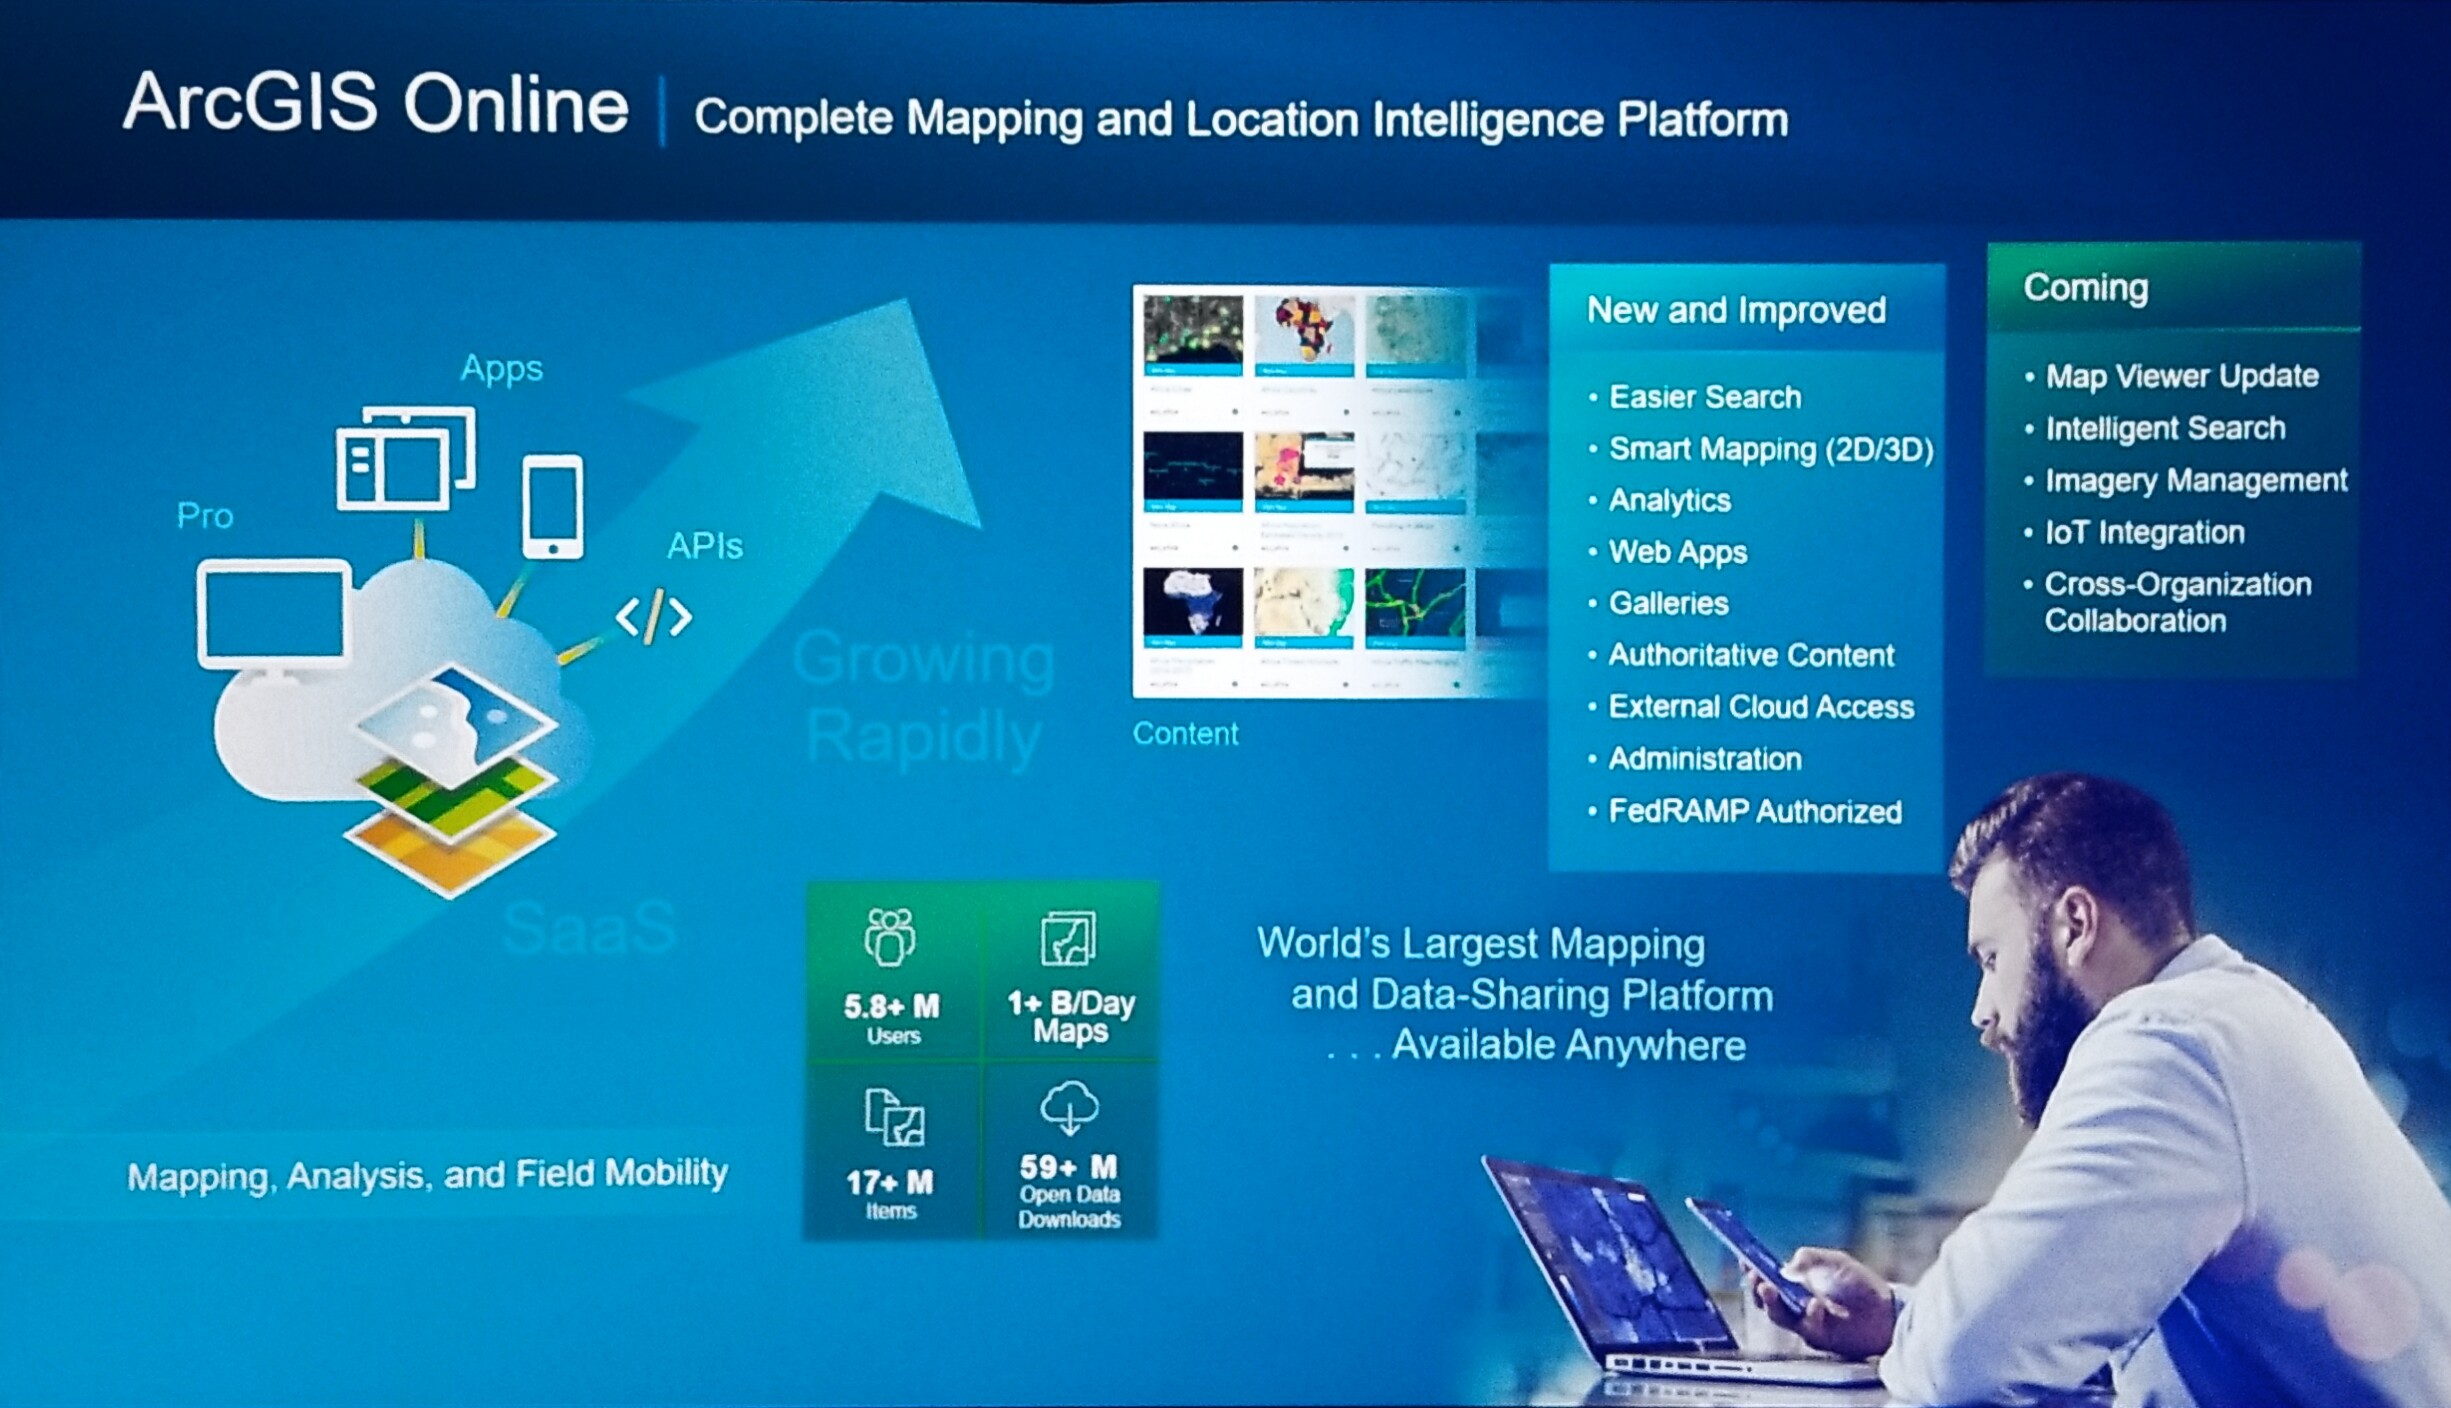
ArcGIS Online and amazing growth - world's largest data sharing platform available everywhere in the world.

 ArcGIS Online new to come

New & Improved features to Enterprise:

  • Sites (Microsite Builder)
  • Enterprise Builder
  • Announcing all level-one users are Now FREE in Enterprise only. (The audience cheers in excitement.)
  • User Experience
  • Performance
  • Resilience
  • Big Data Analytics
  • Distributed Collaboration
  • ArcGIS Monitor


Coming soon in ArcGIS Enterprise

  • Containerization
  • Intelligent Search 
  • Machine Learning & Predictive Analytics
  • Hosted Python Notebooks


ArcGIS Enterprise ArchitectureEnterprise Archictecture

Easy to set up and is modular and massively scalable with specialized servers, the ability to be independently scalable and flexible.

Monitor >

·       Portal > GIS Server - Data Store

o   Image Server > GeoEvent Server > GeoAnalytics Server > Supports distributed collaboration

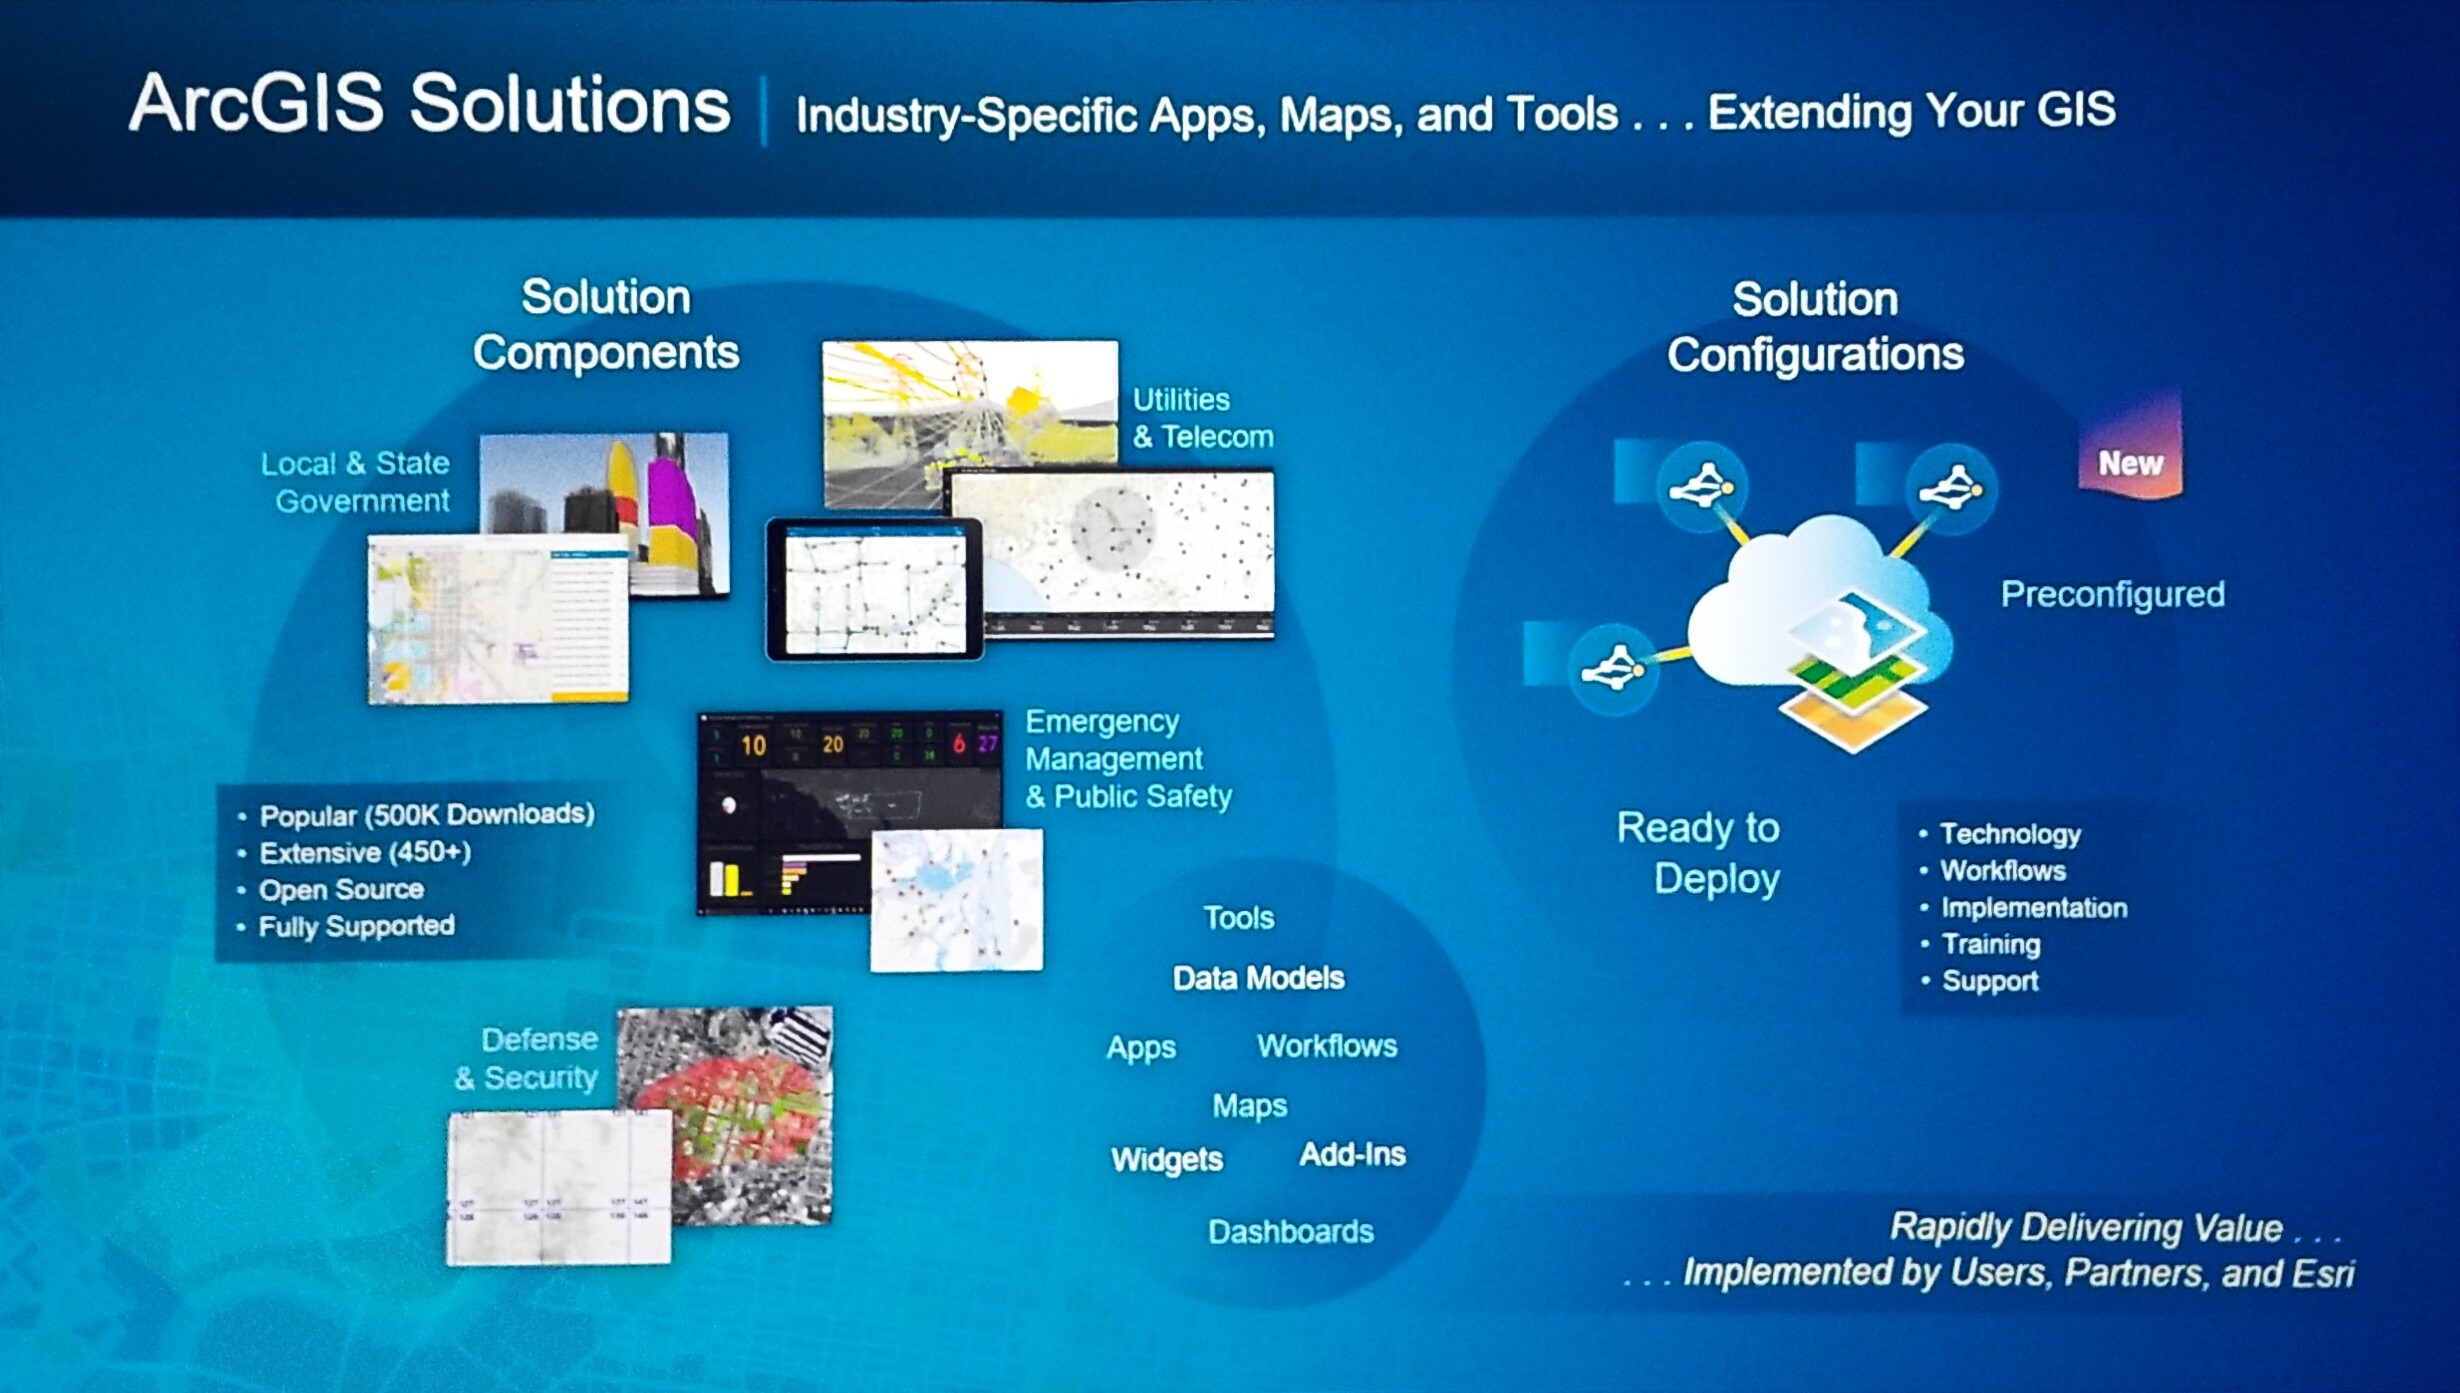
ArcGIS Solutions

Industry-specific apps, maps, tools, and configurations - pre-configured with workflows, training, and support as configured packages. Had half a million downloads in the last year. The best part is that they are FREE.

 Solution Componments


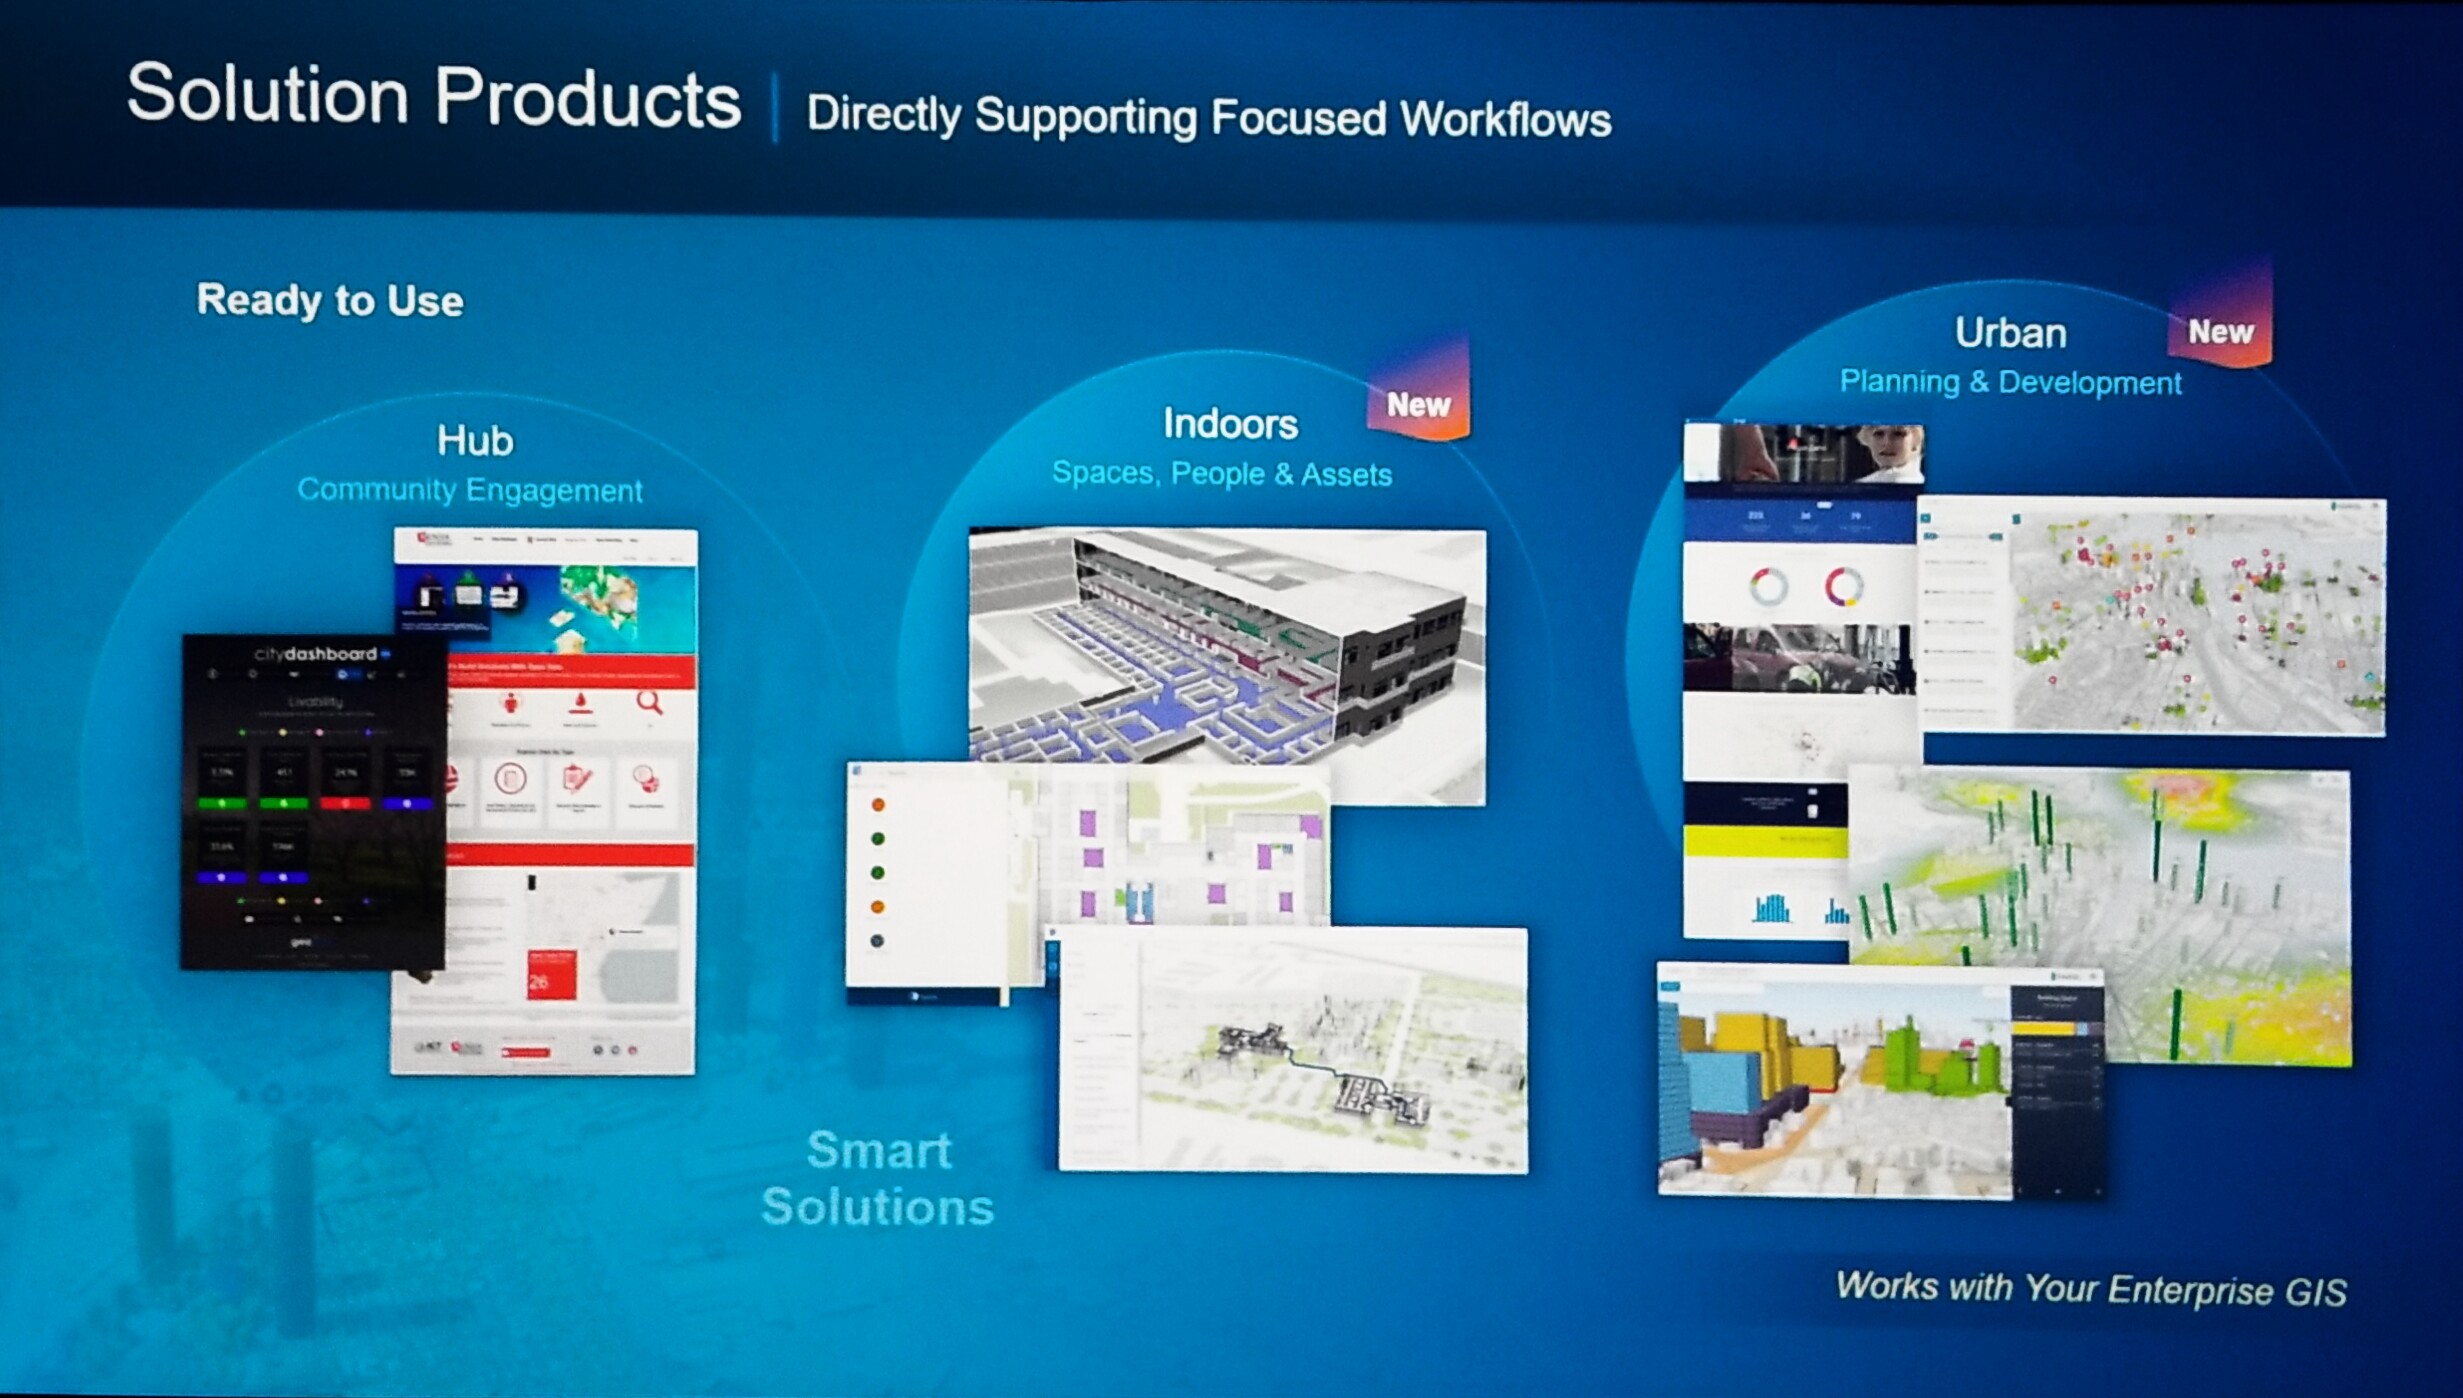
Solution products - ready to use
  • ArcGIS Hub - consolidated to Open Data
  • Indoors (new), Portfolio Management, Operations
    • Watch for a new GeoNet space for Indoors coming soon
  • Urban (new) - most impactful as a landscape architect and will revolutionize how we do urban planning around the world.

Smart Solutions

Solution Products


9:59 a.m. - A New Revolution in Urban Planning

Company: Boston Planning and Development Agency (BPDA)

Speakers: Carolyn Bennett, BPDA and Brooks Patrick, Esri


Carolyn thanks Jack for his introduction.


Written by Matt Ball, Esri Staff Writer

We are also introducing a whole new class of software products that support focused workflows.

The first we actual introduced last Summer, ArcGIS Hub is about engaging communities through initiatives. Dozens of communities are leveraging their connections with open data, performance dashboards, and apps that engage citizens.


ArcGIS Indoors is about smart buildings, and looking at the use and management, including safety, security, energy use and wayfinding.


ArcGIS Urban addresses this challenge through software that holistically shares what’s being planned and what’s being built


The Boston Planning and Development Agency (BPDA) have partnered with Esri on a solution product centered on the workflows of urban development and planning called ArcGIS Urban.


Our cities are going through profound transformations, with greater density created to accommodate growing populations. Developers are spending $1.3 Trillion a year on construction. The key stakeholders—government, citizens, real estate, architecture, engineering, and construction—lack a common platform to address these challenges. Often this leads to unintended growth.


ArcGIS Urban addresses this challenge through software that holistically shares what’s being planned and what’s being built. No longer will government plans be locked into text-heavy PDF documents; planners will not be limited to outreach that centers on children’s building blocks; real estate professionals will get out from underneath the weight of large plan sets; and AEC designers will get away from designing in white space, instead designing in the context of the project’s geography.


City planners are engaged in work that must take into account a host of considerations in weighing different development scenarios for the physical and economic growth of their communities. They assess population metrics, zoning constraints (density, height constraints, etc.), transportation flows, and other factors throughout a thoughtful planning process, presenting this detail to leaders, citizens and other stakeholders in the march toward often difficult decisions.


ArcGIS Urban allows planners to visually present complex zoning codes calibrated to local parameters, allowing for the presentation of current code, the testing of changes, and the presentation of what the city would look like if the full extent of zoning restrictions have been reached. It presents a suitability score for different scenarios of planned development based on economic feasibility. It displays the mix of land use across the city, including residential, commercial, retail, industrial, and other development types. The tool provides quick visual feedback of zoning changes, allowing viewers unlimited vantage points, and an overall understanding of growth capacity.


ArcGIS Urban focuses on standard practices. The first iteration will provide the means to  evaluate and share zoning and land use plans at the city and county scale. It will include digital submission workflows to streamline this process while adhering to a city’s submission guidelines. It will also provide planners with multiple tools to measure the impacts of development.


Learn more about Boston Planning & Development Authority’s use of 3D GIS in the Esri_Blog https://www.esri.com/about/newsroom/blog/3d-gis-boston-digital-twin/


Partnering with Esri, the BPDA can develop a solution using ArcGIS Urban to illustrate patterns for “orchestrating urban development and planning workflows,” explains Brooks before turning the stage over to Carolyn.

BPDA Carolyn Bennett 

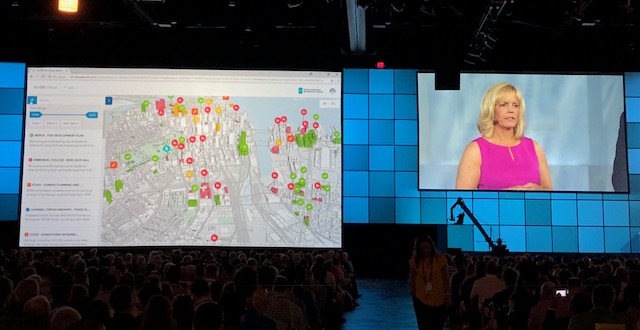
“ArcGIS Urban is streamlining our work,” begins Carolyn. Carolyn explains that population growth (seen in red on the slide), is resulting in an average of 80 large development projects per year. The BPDA is responsible for the planning, building, and indicators that impact decisions for these projects.

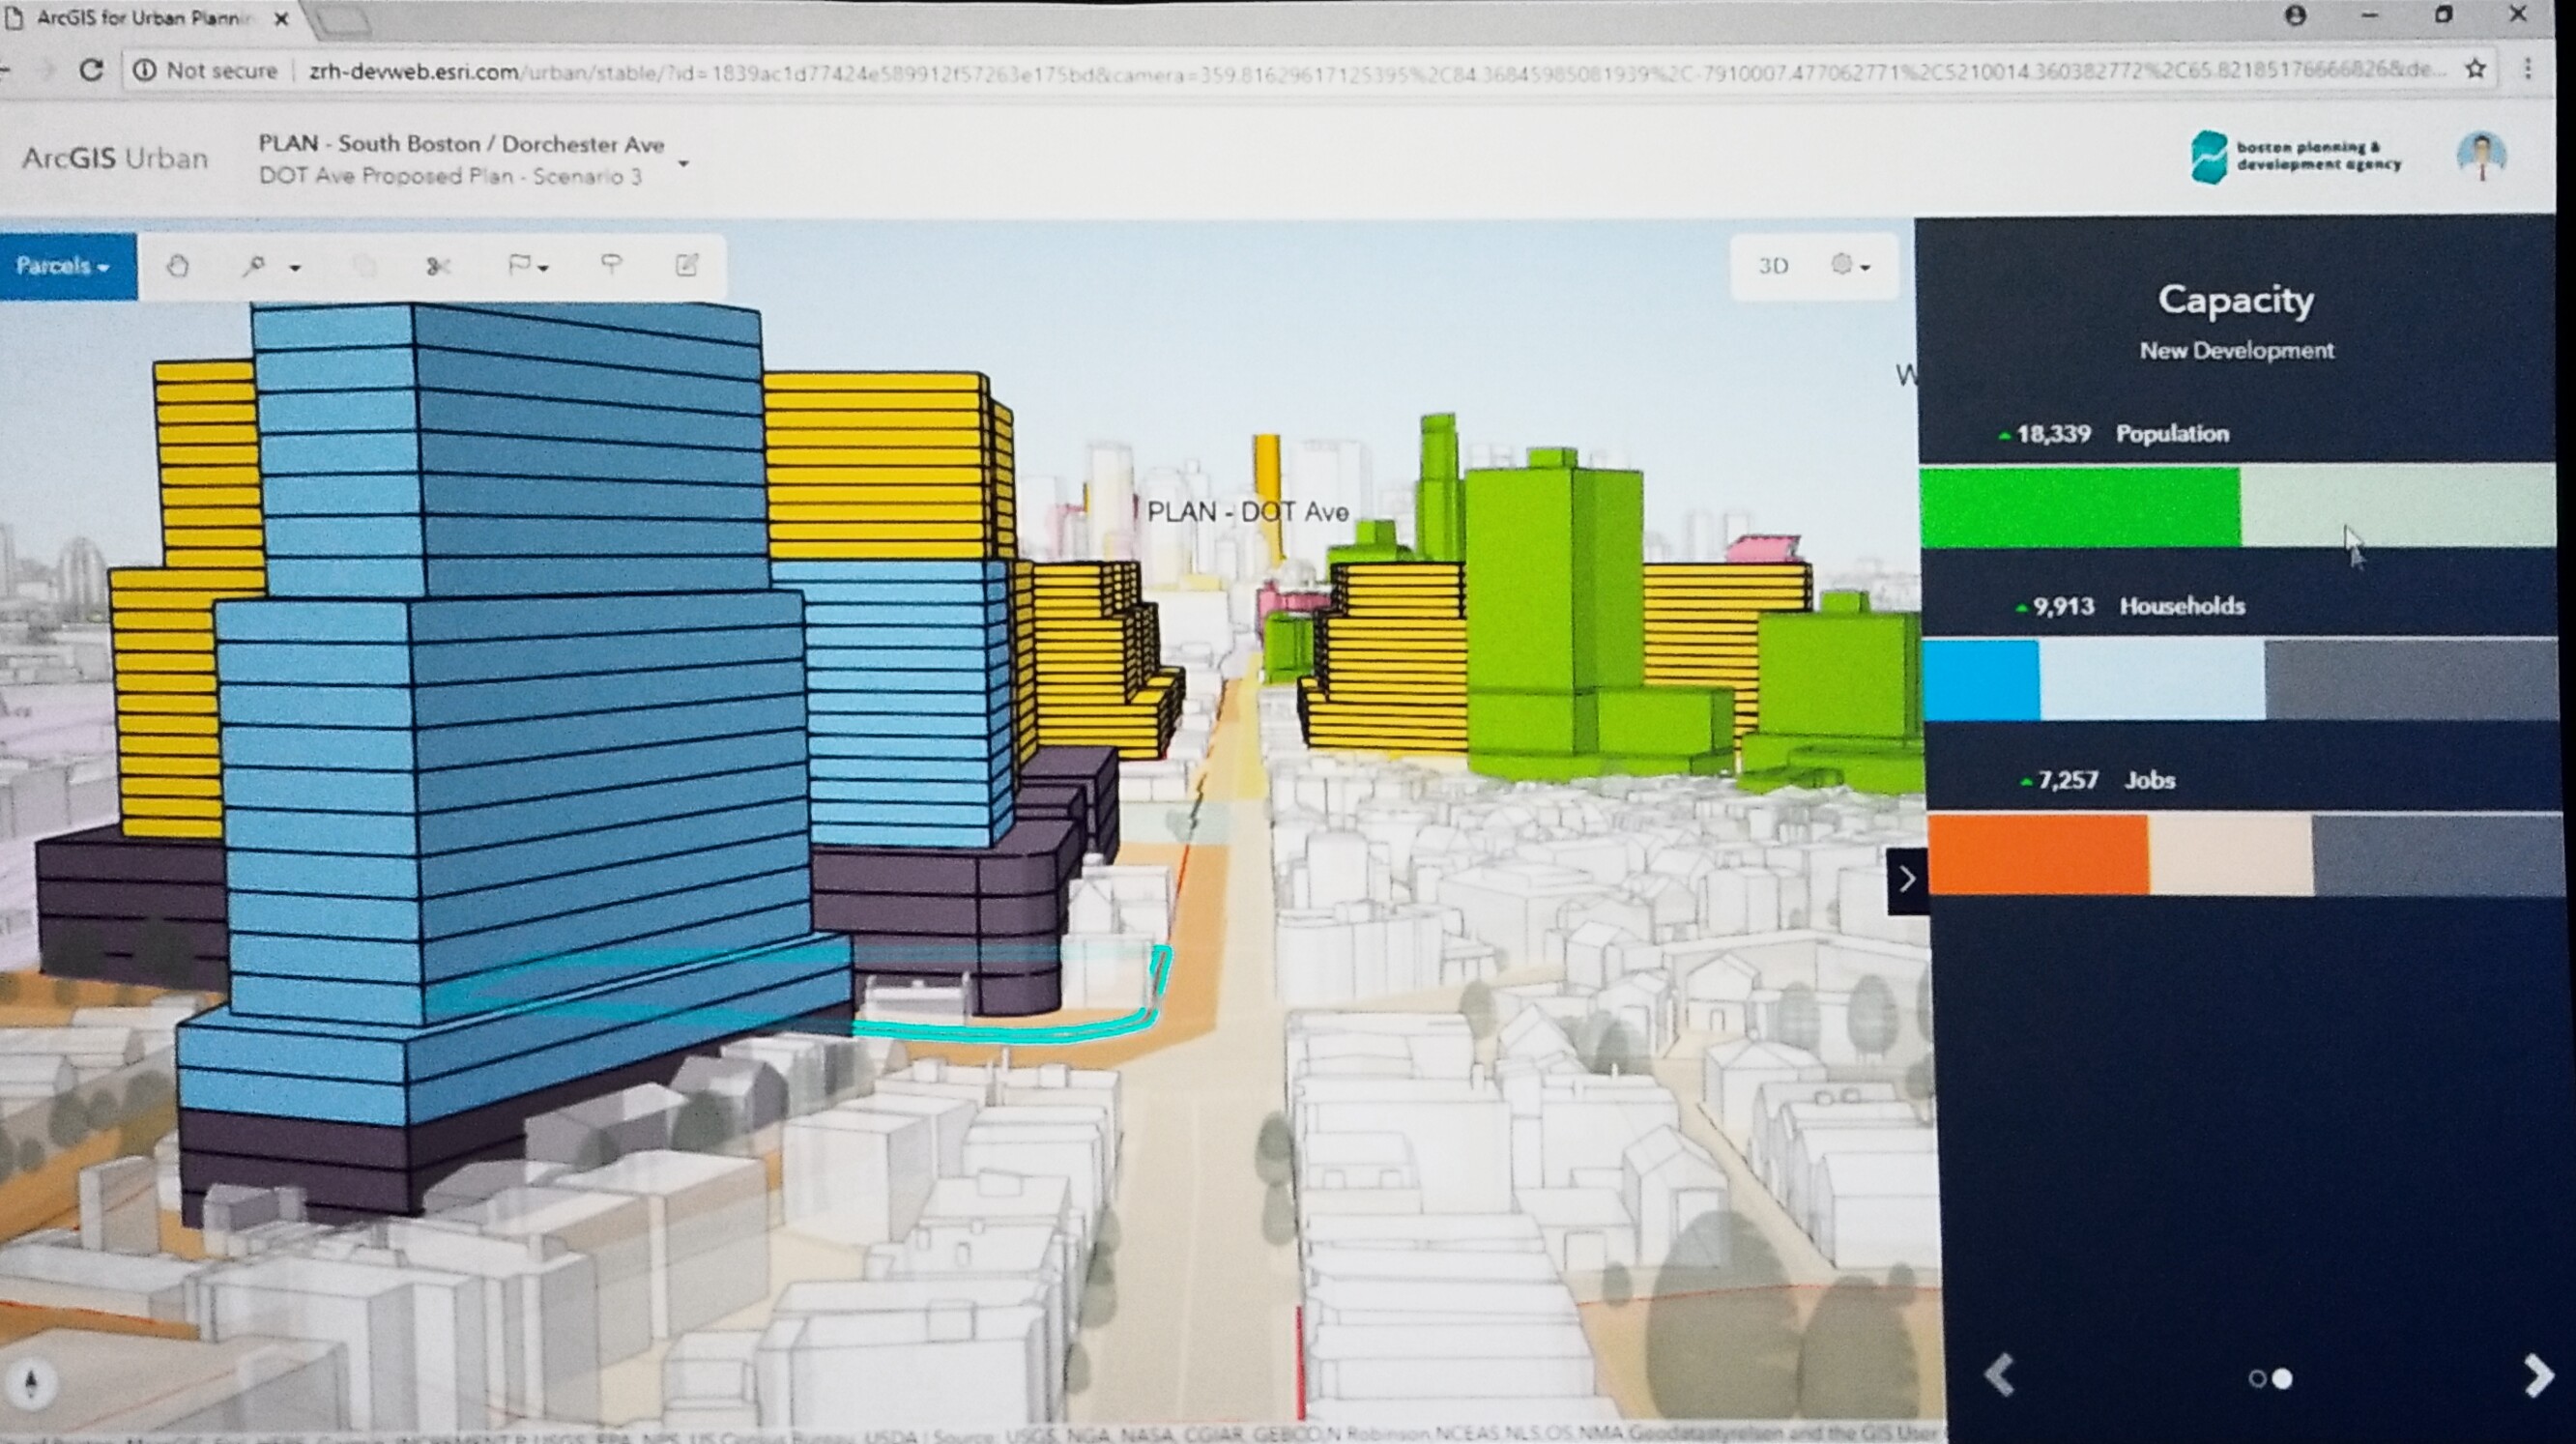
Carolyn gives a demonstration of the Dorchester Avenue Planning Initiative project to proactively accommodate for future changes in population growth and industry demands. Uploading zoning codes to ArcGIS Urban allows BPDA to begin zoning code scenario planning for current and future changes. Introducing Brooks to demonstrate how they are using ArcGIS Urban for the DOT Ave zoning project.

Brooks continues the demonstration with a look at the forecasted scenarios in 3D. You can see the changes in land development, height limits and new building uses by transforming from residential towers to commercial

office towers.

BPDA - Brooks

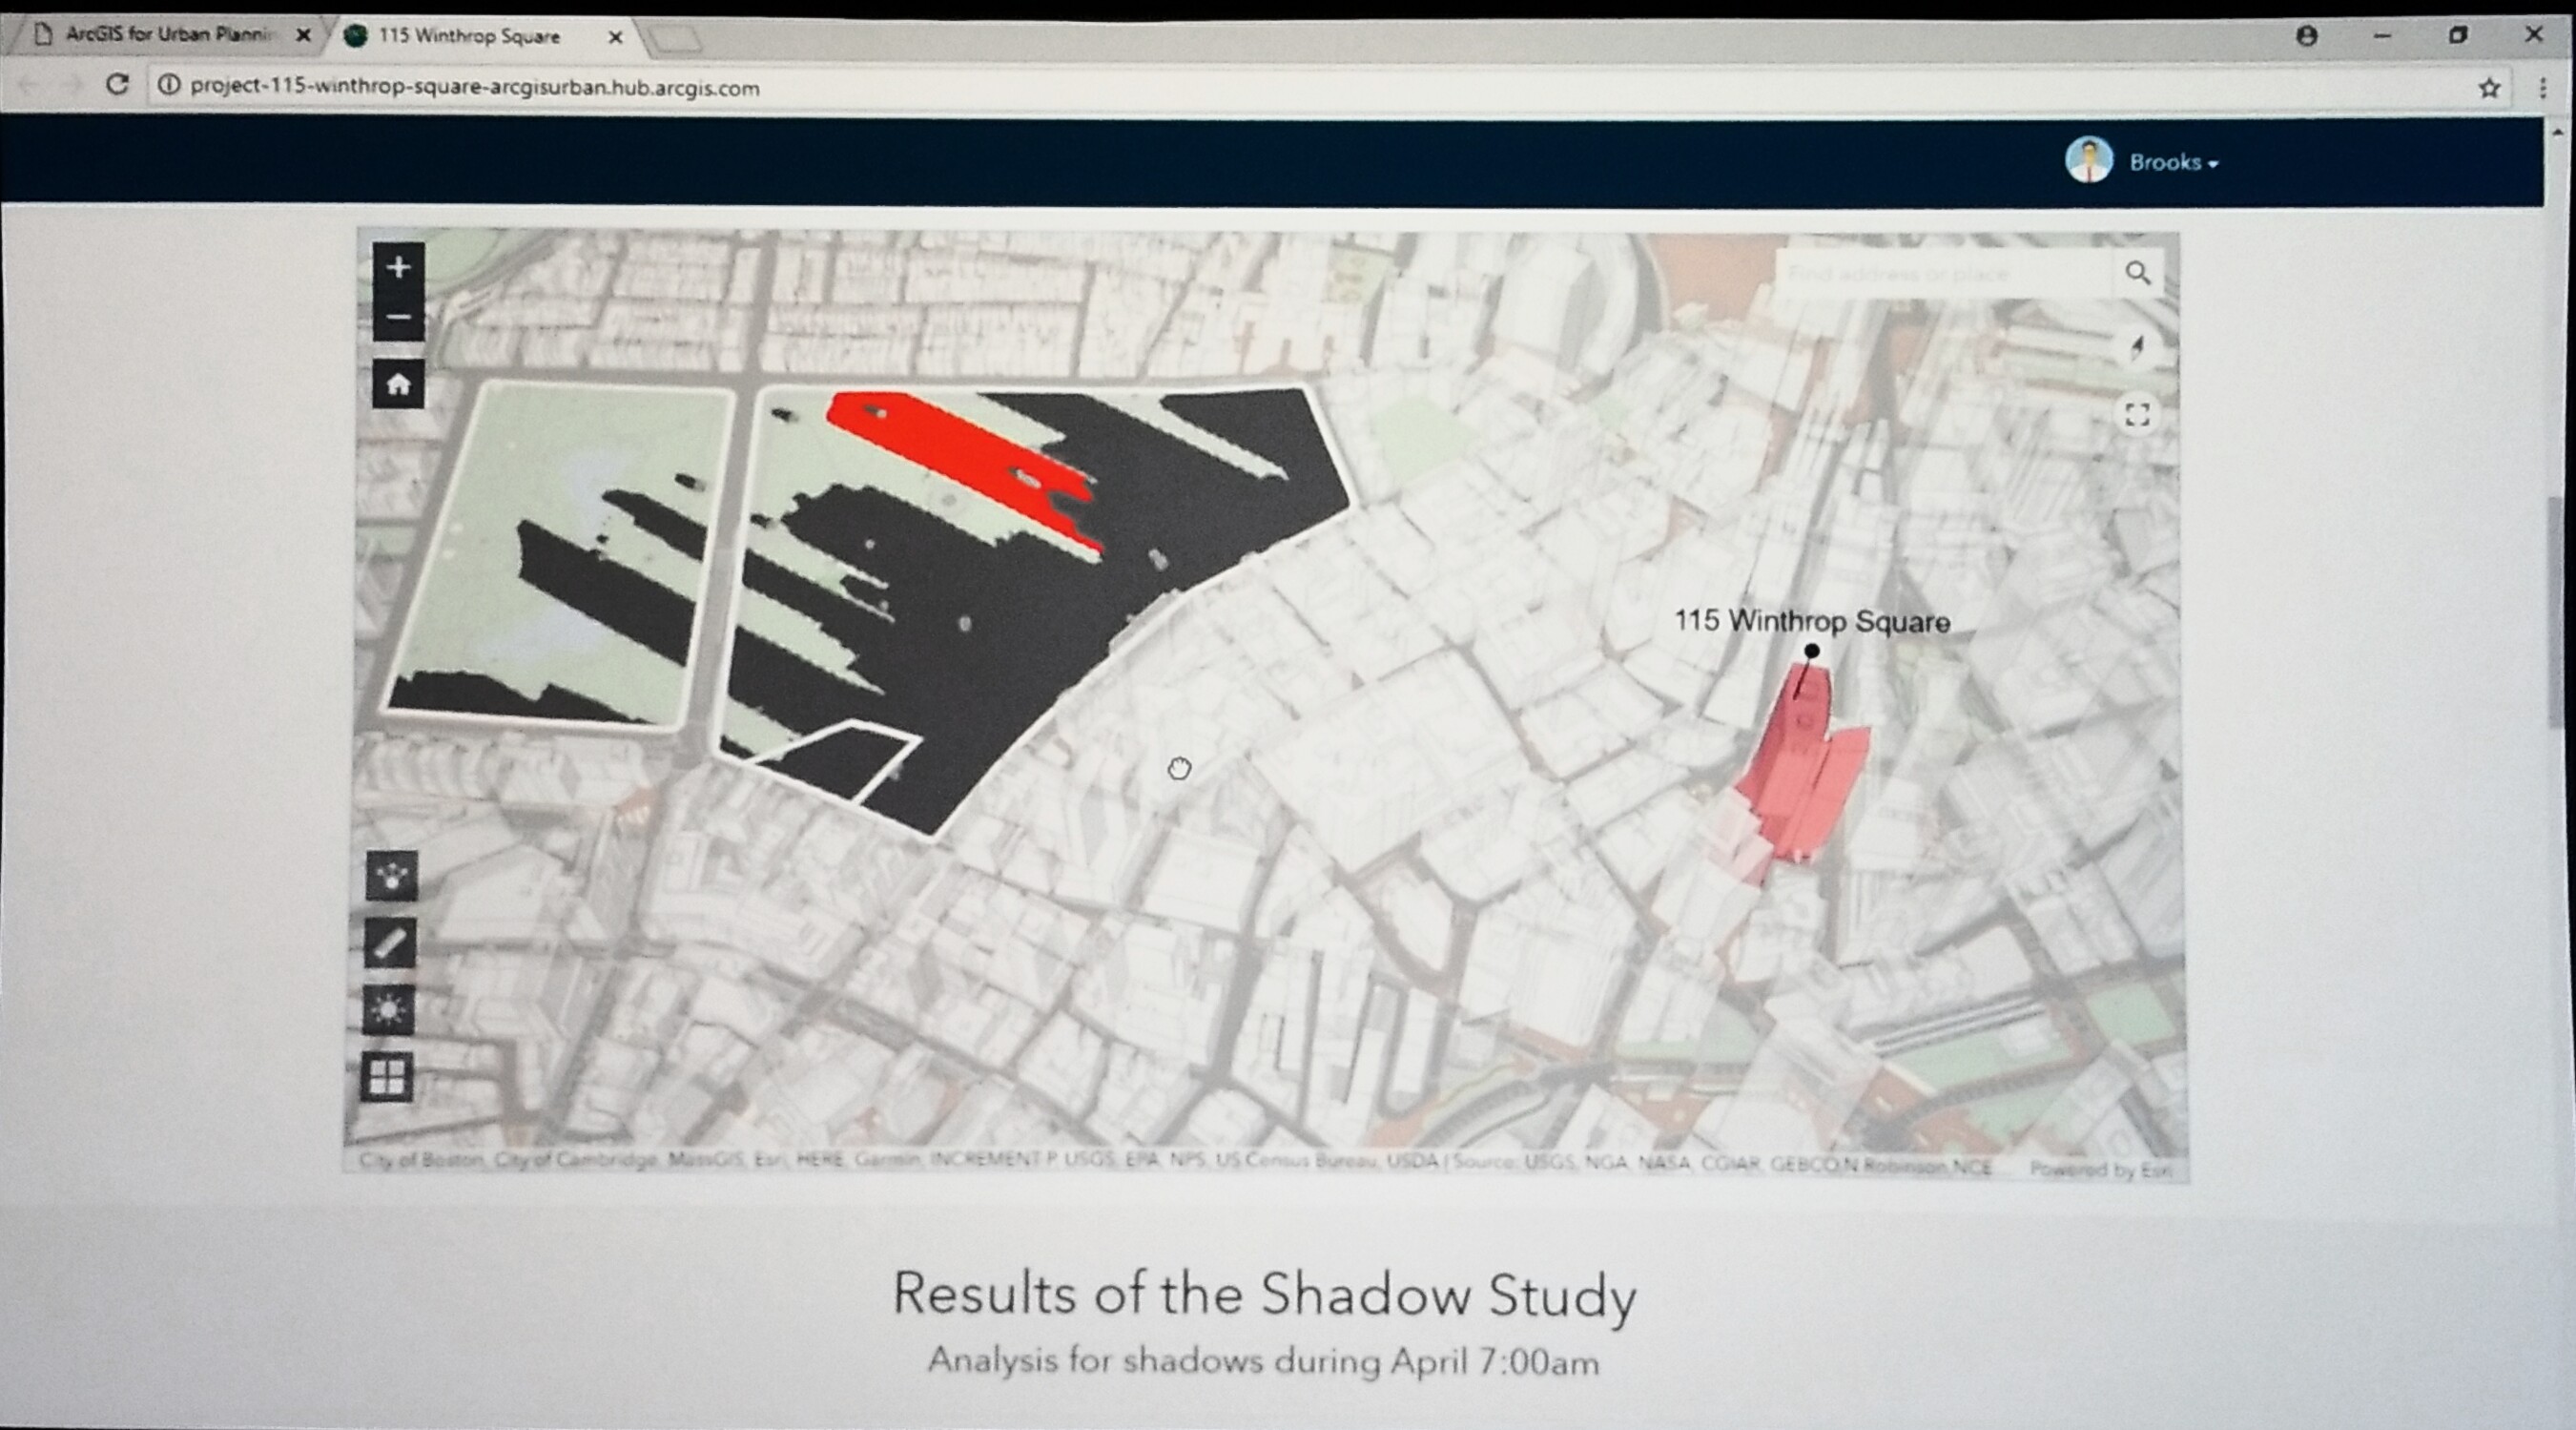
Carolyn wraps up with a look at how using the digital models can assist with running each project through a standard impact evaluation; such as measuring shadows on the historic Boston Common to determine building heights.

Shadows in evaluating maps heights - BPDA

“This collaborative platform will ensure a more economically prosperous, resilient, and vibrant city for generations.”


What's Next -The Road Ahead

Jack wraps up his closing with a few more works and what we can look forward to, the What's Next is GIS.

What

He shares how we are Serving Our Users.

Who is Esri?

In closing, Jack quotes Charles Darwin. “It is not the strongest of species that survive, nor the most intelligent, but the ones most responsive to change.”

Thank for joining us for Part One of the morning session.

We're back! You can continue following along for Part 2 of the morning session here

more
25 27 18K
CharlottePapp
Occasional Contributor II

What is the GIS Managers’ Open Summit?

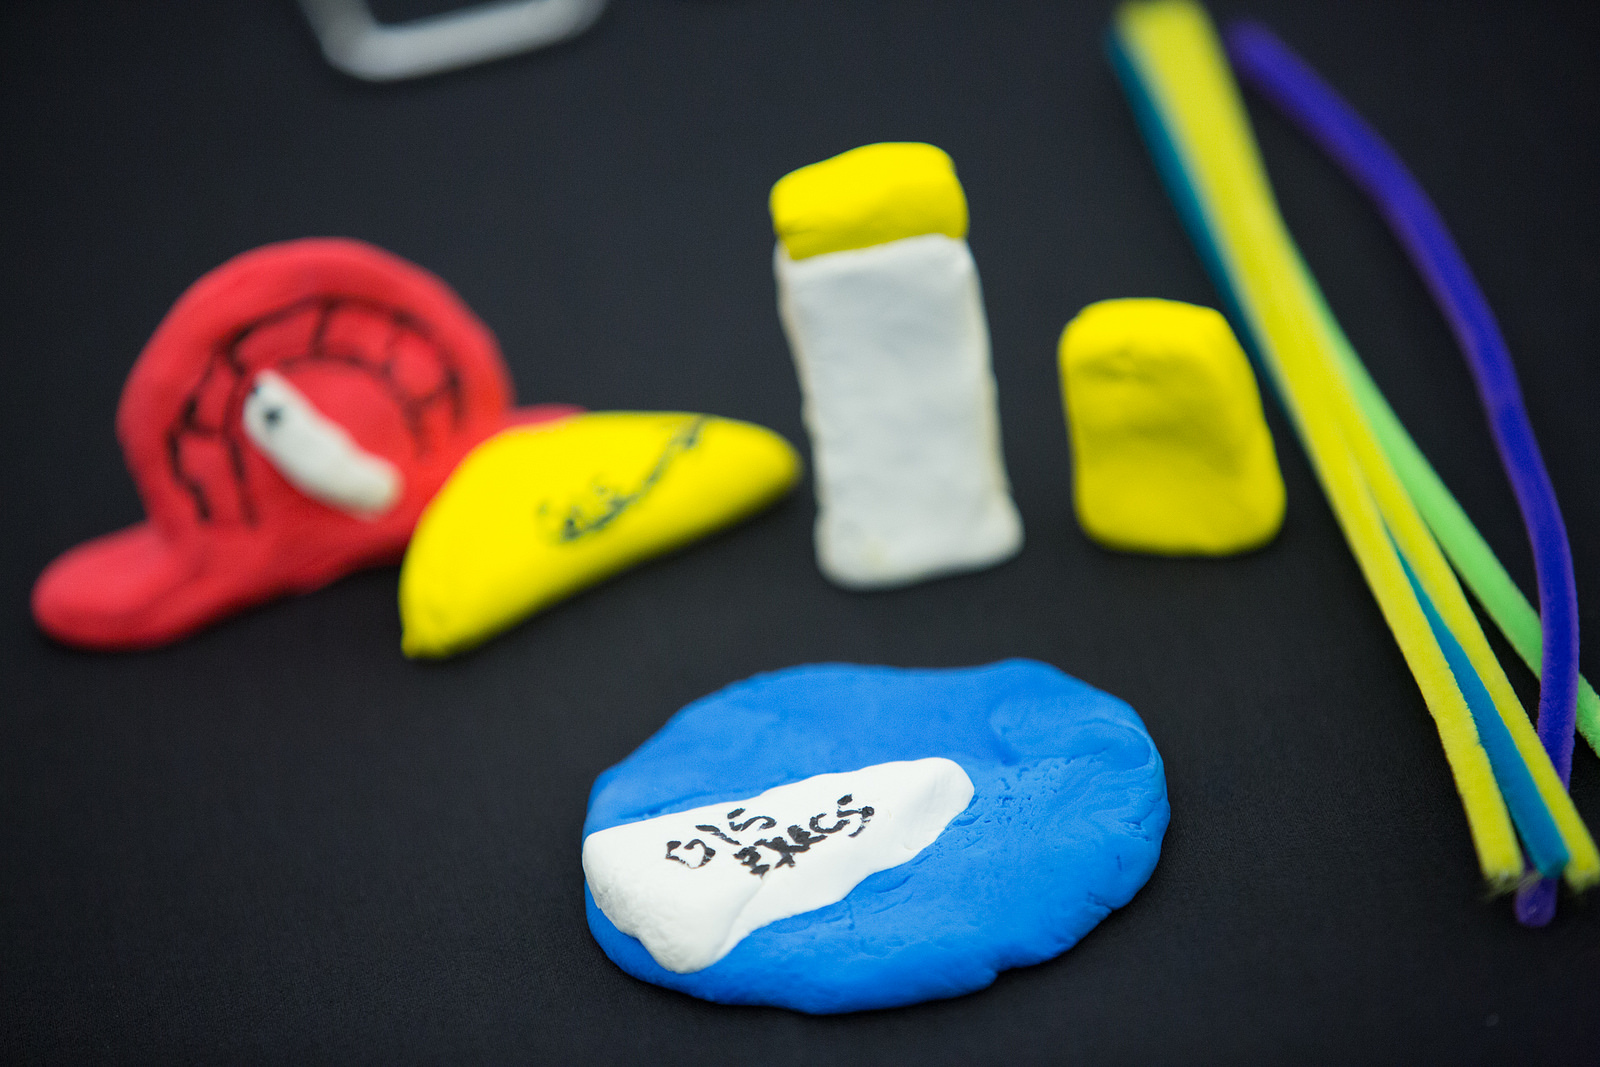
Play-doh figures of dials and chartsThe GIS Managers’ Open Summit (GISMOS) is an all-day interactive experience followed by the new GIS Managers track with eight sessions on Wednesday and Thursday of the User Conference. The summit focuses on showing people with a GIS background how to be successful as leaders. Adam Carnow the Community Evangelist, explains the summit aims to “turn managers into leaders.”
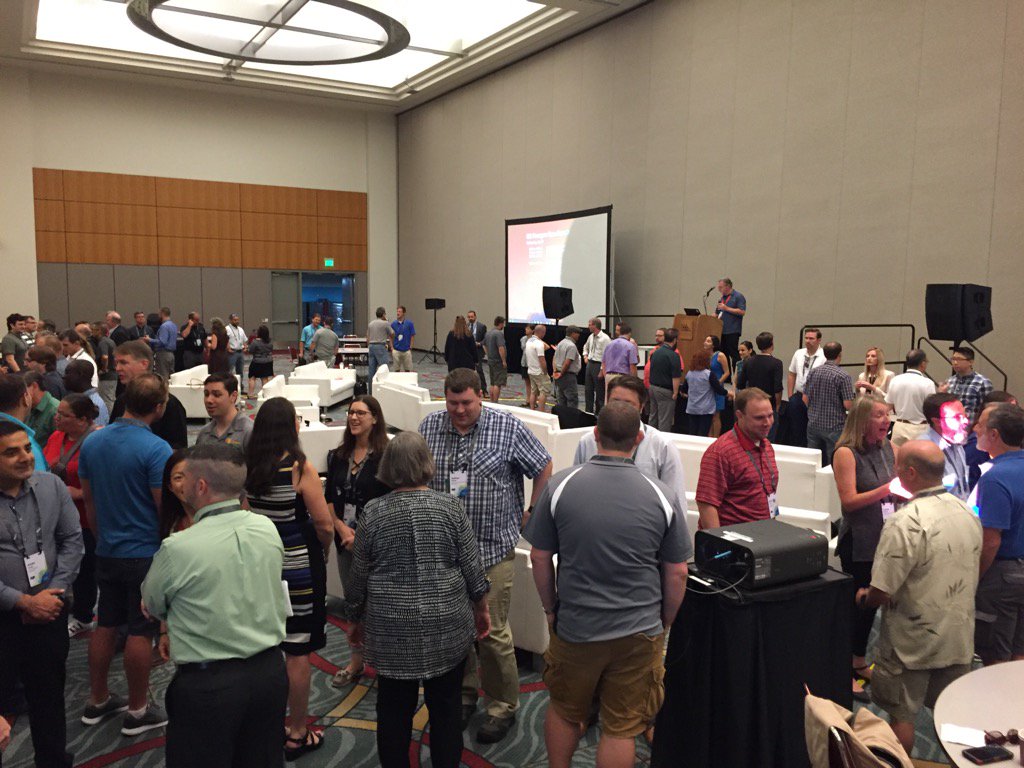

The summit began in 2010 at the User Conference with a meet-up of 30 people and the Managers in GIS LinkedIn group. Since then, GISMOS has grown to include 180 attendees.

WLarge group of people shaking handsho should be attending this summit?

Anyone that is a manager or a leader of a GIS team, and even future managers/leaders can attend the GISMOS. This could mean CIO’s, managers, IT leaders or anyone that wants to one day lead their team.

Registration is free, and seating is limited. You must be registered for the User Conference to attend this summit. Please click the link below to register.

Register Now >>

What should I expect at the summit?

Presentations

Among the other GISMOS activities this year, we are going to have an Esri led presentation focusing on the executive and elected officials’ view of GIS, and three guest speakers. The seating will be designed to encourage activities and discussions between presentations.

I asked the GISMOS team what made these guest speakers standout, and they expressed that the presenters have a strong handle on the business-side of GIS. They show the power that GIS can have and how their GIS work has transformed their organizations. The GISMOS team hopes that the speakers will be able to inspire the attendees in their own work.

Networking

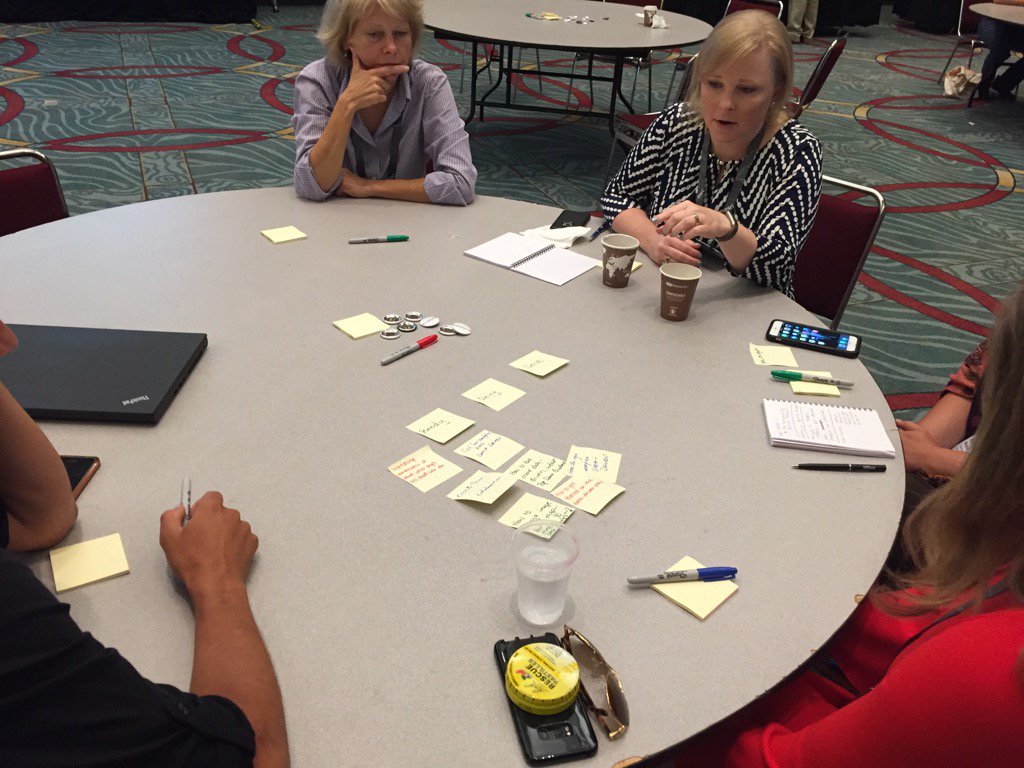
Group discussion at a round table with sticky notes on tableGISMOS is not just a day of inspirational presentations. The emphasis is also on networking and the interactions between participants.


The day starts off with an icebreaker. This is your opportunity to make many new connections.


Group discussions are held after each presentation using the Lean Coffee method for meetings. The group discussion helps further the understanding of the presentation topics. At the end of each discussion, attendees are asked to share the topics they discussed. Fortunately, this will be very simple when you already have your sticky notes ready!

Please see the attached agenda for more details!

Tips from the Team:

For Discussion:

For our former GISMOS attendees, what made you choose to go to the GISMOS, and what was your favorite part?

more
1 0 1,461
CharlottePapp
Occasional Contributor II

This week we are talking about certification testing. Our certification program started in 2010 as a way for the Esri community to benchmark their ArcGIS skills. The program is open to Esri employees, distributors, partners, and customers worldwide. We started with only five exams and now offer nine different certifications, with certified individuals in 86 countries.

Man and woman sitting behind computers taking an examWhat is certification testing?

Certification testing is a benchmark to measure your proficiency with Esri GIS software. They typically last between 2-2.5 hours, with 80-95 multiple choice questions. Certification is a way to differentiate tech workers in the market, grow your professional resume, or reach a personal goal.

Why should I get certified?

It is a requirement for certain positions and highly valued by many companies. All of our Esri instructors must have them. Certification is a great way to grow within your organization, find a new position, increase your salary or develop your personal and professional skills.

You can read some success stories from those who have benefited from their certifications, or read this blog post about the value of certification.

Check out a recent survey about certifications and average salary.
 

How do I get certified?

Our certification team is excited to offer Certification testing at the Esri User Conference this year making it more convenient to take your exam. Testing will be offered Tuesday, July 10 – Thursday, July 12, 8 a.m.  –  5 p.m. in the Omni Hotel across the street from the San Diego Convention Center. You can find more information here.

Here’s a quick rundown of the process:

  1. Select your exam. You can choose from nine (9) exams across three domains with three different skill levels. If you are unsure which exam is best for you, check out this post.
  2. Prepare for the exam. There’s a post about that too!
  3. Register for the exam. Registration is optional but highly recommended.
  4. Pay for the exam. The cost of the exam is $225. You can pay when you arrive on site (click here for conference discount information).
  5. Bring two forms of ID!
Tips from the Team:

  • Wear layers
  • Wear comfortable shoes
  • Bring a water bottle
  • Talk to 1000 people. Talk to presenters, talk to the person sitting next to you, talk to everyone you possibly can
  • Have an energy bar in your bag for a mid-morning or mid-afternoon snack

For Discussion:

For our certified GeoNet members, what made you decide to get your certification? What advice do you have to prepare for the exam?

more
6 1 1,149
CharlottePapp
Occasional Contributor II

This week we will be discussing the third annual Esri Science Symposium. The Symposium started in 2015 by Esri’s Chief Scientist Dawn Wright as a reception for the 300 scientists of the GIS community attending the UC. In 2016, the reception expanded into the first actual Symposium with a keynote speaker, reaction discussion panel, and an audience of 450 attendees. The Symposium continues to grow in popularity with an expected audience of 600 for the 2018 event!

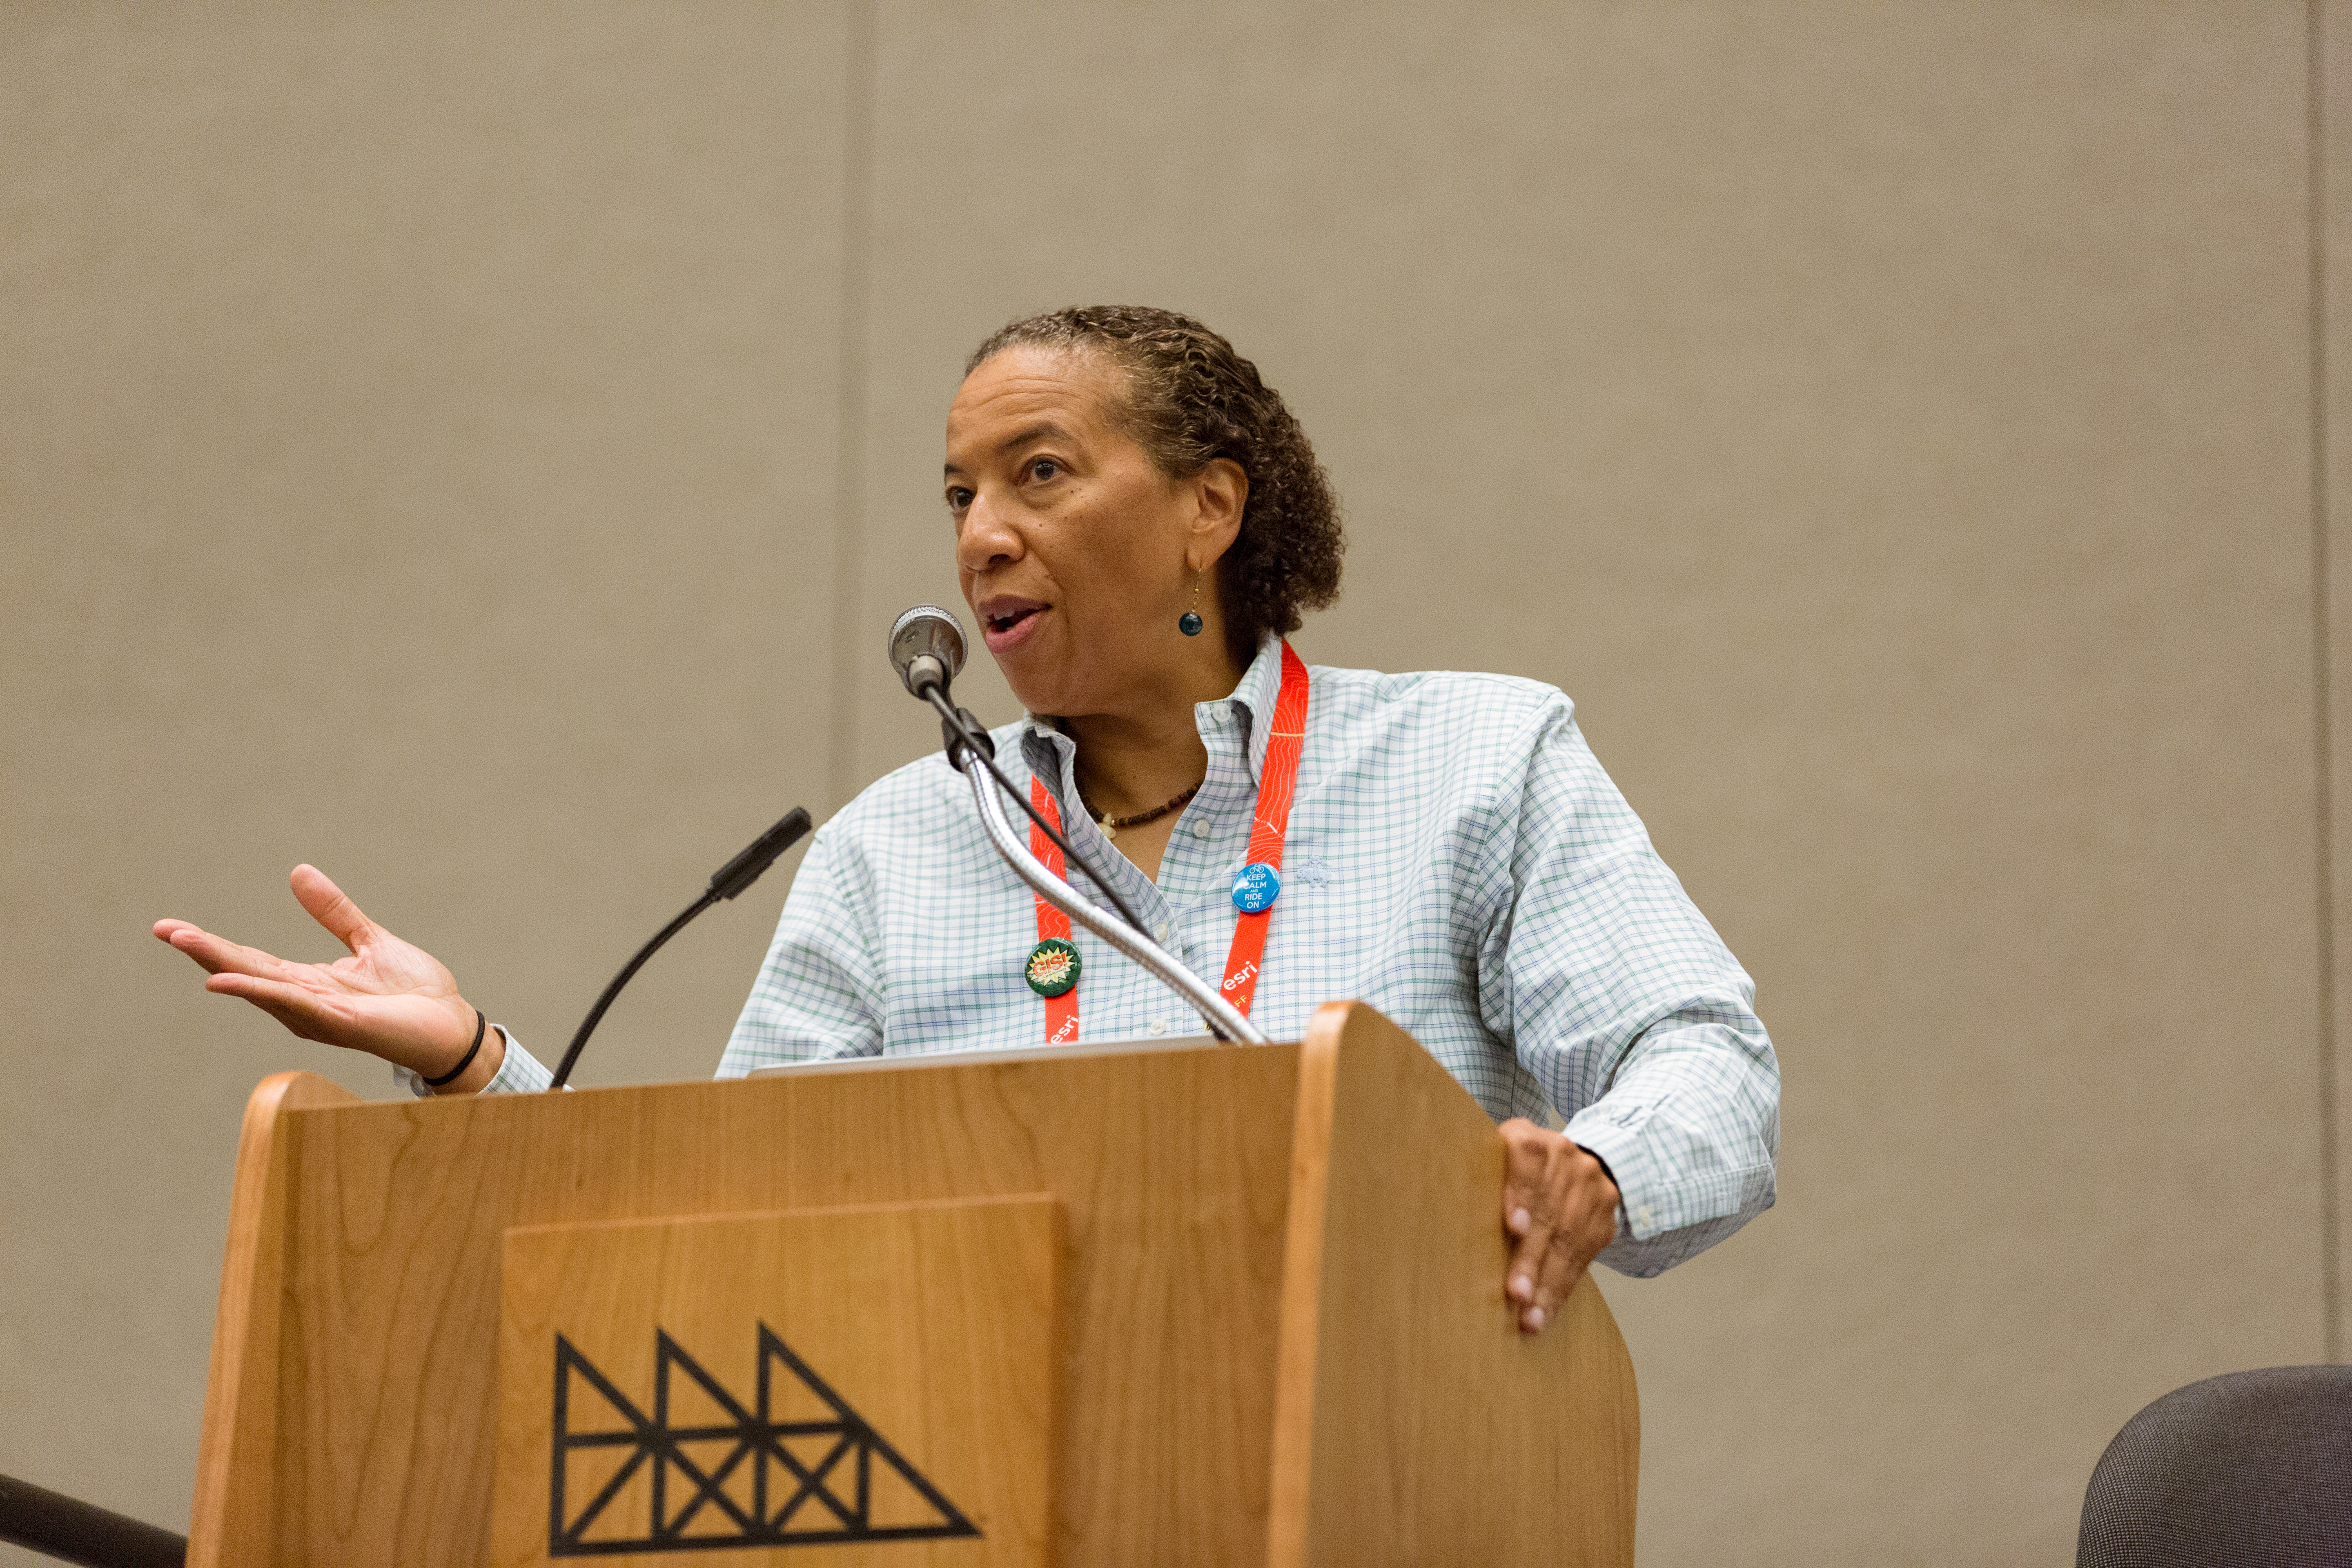
Dawn Wright presenting behind podiumWhat is the Esri Science Symposium?

The Science Symposium is held on Tuesday, July 10, 2018, from 4:00 p.m. – 6:30 p.m. in Ballroom 20D of the San Diego Convention Center. The keynote presentation will focus on critical environmental issues, while the reaction panel will include GIS experts talking of how the vision presented by the keynote speaker can be realized geospatially. Following the panel discussion is a Q&A and a discussion among the audience. The Symposium will conclude with a networking reception.

The purpose of the Symposium is to “broaden the tent" of participation at the UC beyond the traditional geographers, GI engineers and GIScientists who come to the UC, inviting those working in the domain sciences.

Domain sciences include: ocean science, hydrology, ecology, forestry, climate science, geology/geophysics, agricultural science, conservation biology, sustainability science and/or geodesign, health sciences, the social sciences
 

It also serves as a focal point for scientists at the UC who are normally scattered about as individuals and hidden in various sessions during the week.

How is the keynote speaker selected?

The keynote speaker is selected based on their relationship with Esri and the advancements that they are making in their field of science. Last year, Dr. Jon Foley, the Executive Director of the California Academy of Sciences, spoke about the need for scientists to communicate more clearly about the societal importance of their work, particularly in the area of climate change.

This year the keynote speaker will be Dr. Camilo Mora of the University of Hawaii. Dr. Mora will be presenting on his work with deadly heatwaves impacting the entire planet. His work (featured in media outlets such as CNN, Newsweek, Wired, the Washington Post, and the Huffington Post) has shown that 74% of the world’s population will be exposed to deadly heatwaves by the year 2100 if carbon gas emissions continue to rise at current rates. Even if emissions are aggressively reduced, the percent of the world’s human population affected is expected to reach 48% by that same year.

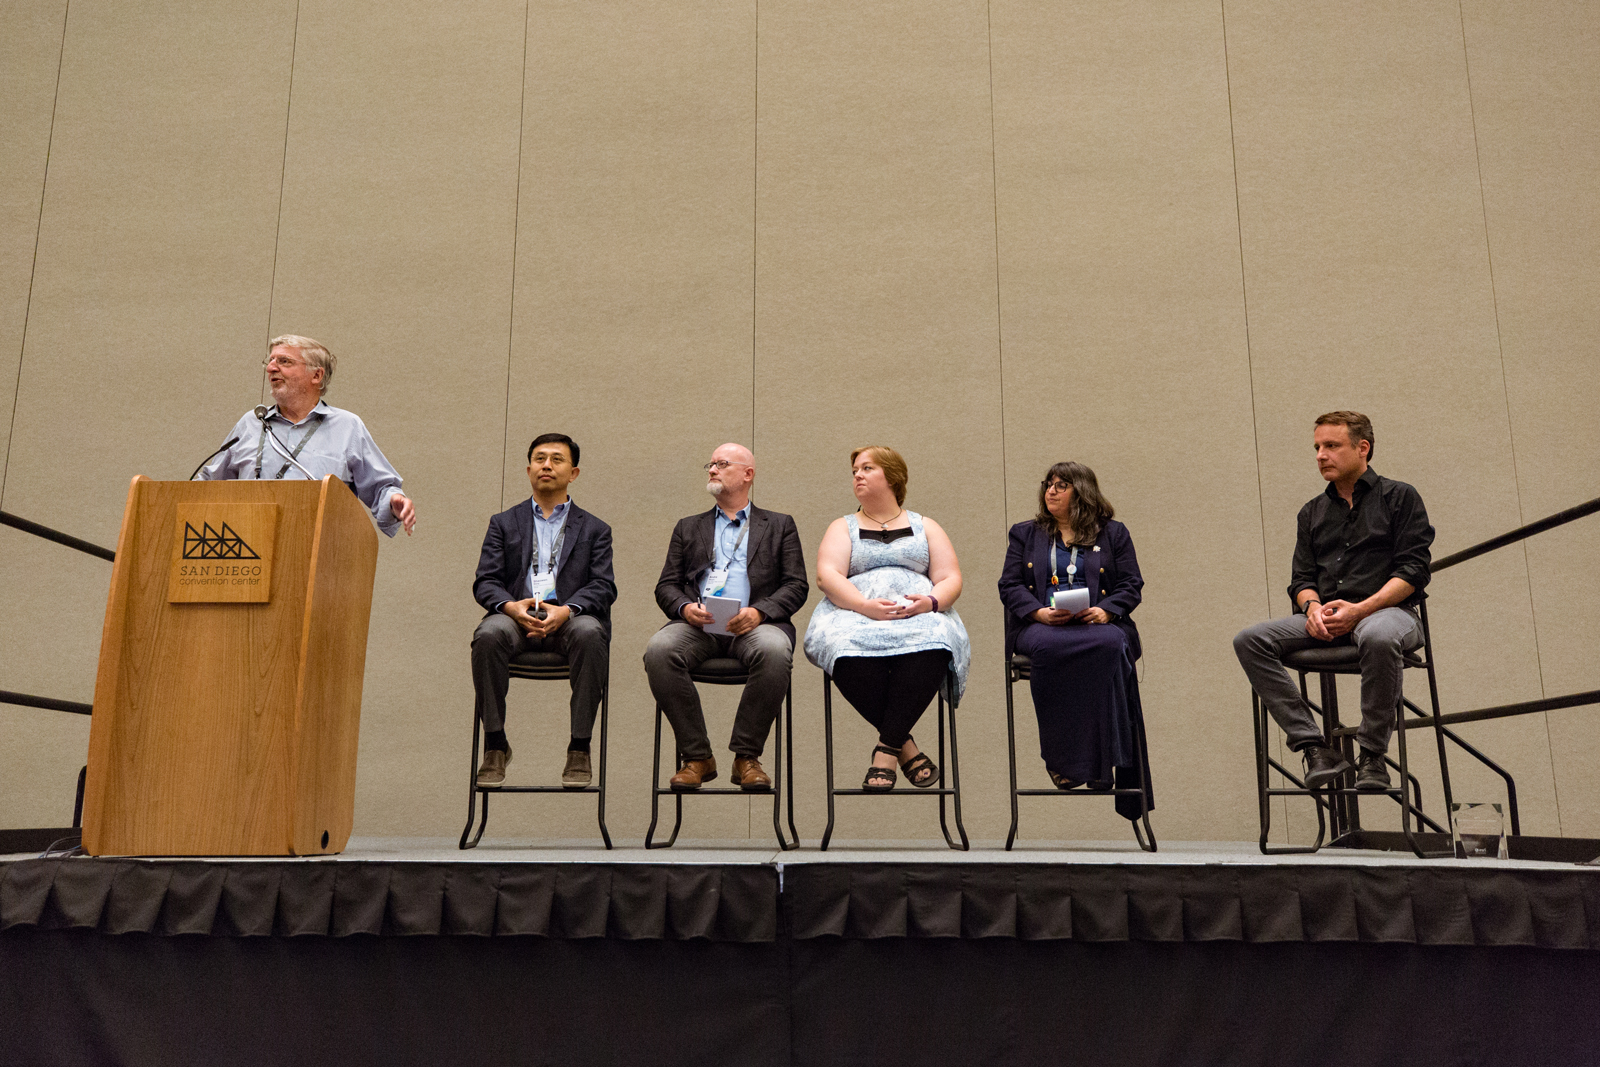
Reaction panel sitting on stageHow is the reaction panel of experts chosen?
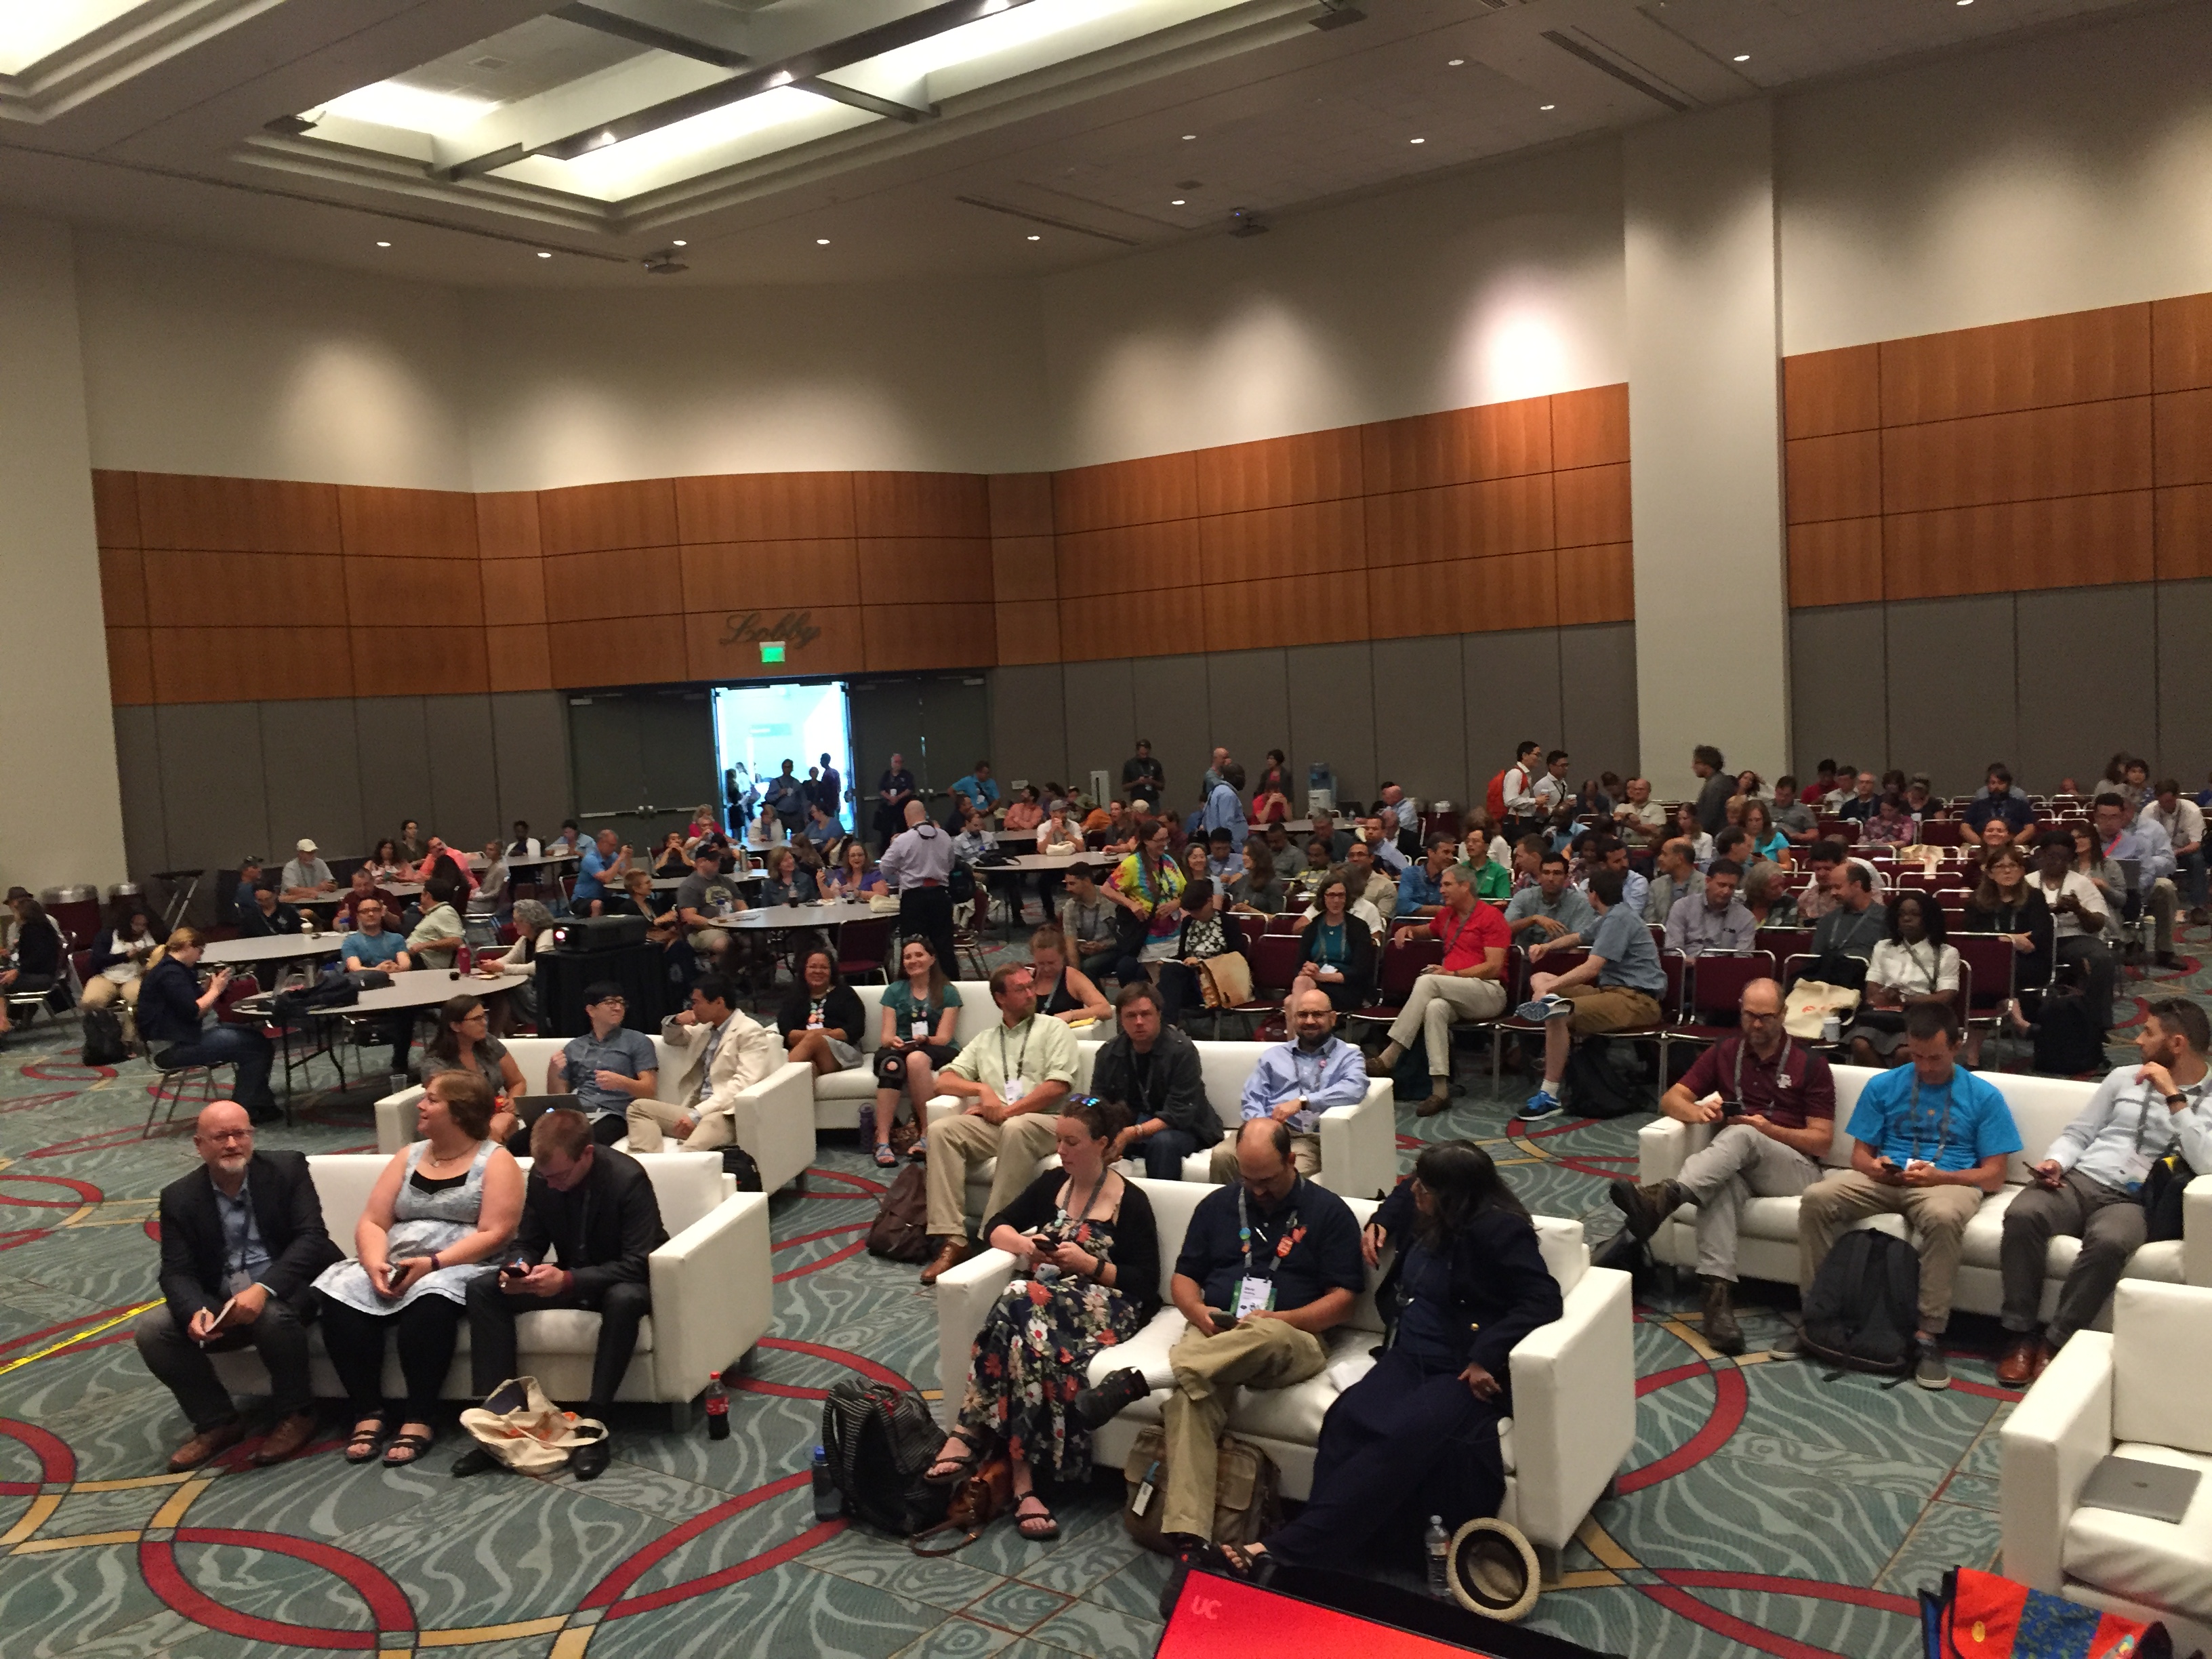
In addition to our keynote speaker, we are happy to welcome our five reaction panelists:

  • Tom Cova, University of Utah
  • Kellee Koenig, Conservation International
  • Mark Kumler, University of Redlands
  • Karen Kemp, University of Southern California
  • Amber Witner, United States Geological Survey

This year the reaction panel, consisting of a variety of GIS experts, will discuss how GIS can play a role in reversing this trend. Panelists are chosen based on their backgrounds, their prior work with Esri teams and Esri software, and their ability to speak to the issues that will be raised by the keynote speaker. The session will end with general questions and comments from the audience.

Crowd of people at 2017 Science SymposiumWho should attend?

The Symposium is open to everyone with interest in science and how GIS may be used to solve a variety of scientific problems that also have a great effect on society. The content is slightly geared towards professionals rather than researchers, but the conversation stems from those in the room, and all are welcome. Registration is free, and seating is limited.

(Please note: you must be registered for the Esri User Conference, or Education Summit @ Esri UC to attend this event)

Register Now>>


What makes the Science Symposium unique?

The Science Symposium is not a Technical Workshop or a User Presentation. Nor, is it a Special Interest Group meeting. It covers broad science issues such as Earth observation, sustainable development and climate change by prominent scientific experts, and provides a unique opportunity for UC attendees to interact directly in discussions with them. The speaker and panelists bring with them different perspectives and expertise that in turn help all attendees get a thorough understanding of the issue at hand. The Symposium is also more interactive than a traditional session, with inspiring moments coming from the speaker, and from the discussions with the reaction panel and the audience.

Tips from the Team:

  • Pace yourself. It's like going to Disneyland, if you try to do too much all at once you'll burn out
  • Ask anyone with a red lanyard for help; for anything; at any time
  • Pick up your badge before Monday morning
  • Bring a light wrap, pashmina or jacket that will fit into your bag
  • Stay involved after the symposium with the Sciences group

For Discussion:

For our GeoNet Scientists who have attended in the past, why have you attended previous Esri Science Symposiums?

more
0 0 1,272
CharlottePapp
Occasional Contributor II

We are starting the party this week with our User Conference SIGs and Socials! Last year we held 176 different meetings and socials during the conference, giving attendees plenty of opportunities to network with their peers.

What is a SIG?

SIG stands for Special Interest Group meeting. These meetings typically take place at lunchtime or in the evening during the conference, although there are a Woman and two men socializing in lobbyfew early birds that do breakfast meetings. The goal of these meetings is to connect with individuals in the same industry, with the same interests, or in the same area (known as Regional User Group meetings) to talk about relevant topics and trends in GIS.

How do we plan and schedule SIGs and Socials?

Each of these meetings is requested through our Meeting Request System and reviewed by a special team. The reviewing team looks at each request to make sure the meeting will be beneficial to attendees and that we will be able to accommodate the time and number of people attending in our open conference rooms. Once the request is approved, it is scheduled. We schedule the meetings on a first-come-first-served basis and try our best to place them in rooms near related User Presentations and Technical Workshops.

What kinds of SIGs are happening this year?

Currently, we have 157 scheduled SIGs and Socials. They vary in topic from Airports to Augmented Reality, from Telecommunications to Trails, and everything in between. (There’s also two GeoNet meetups!)

You can see the full schedule of SIGs and Socials in our Agenda.

Man pointing at camera at a partyWhy should I go?

SIGs and Socials are a great place to connect with your community. The presentations focus on exactly the applications of Esri software used by your group and go over the most important changes and trends that the industries are facing.

These events are also one of the best places to network at the conference. Be sure to bring your business cards. What better way to make valuable connections than to surround yourself with people that have shared interests?

Tips from the Team:

  • Bring a sweater
  • Make sure you keep your phone and charging cables with you. We’ll have charging stations around the convention center to plug in
  • Drink water! There are water coolers in most session rooms to fill up your bottles
  • Are you a foodie? Check out this story map of places to eat in San Diego.
  • Be aware there are cash limitations. Bring a credit/debit card.

For Discussion:

How do you find the balance between work and play at the User Conference? What are your best networking tips?

more
2 0 958
52 Subscribers