Telecommunications Blog - Page 2

cancel
Showing results for 
Show  only  | Search instead for 
Did you mean: 

Latest Activity

(44 Posts)
StaciaCanaday
Esri Contributor

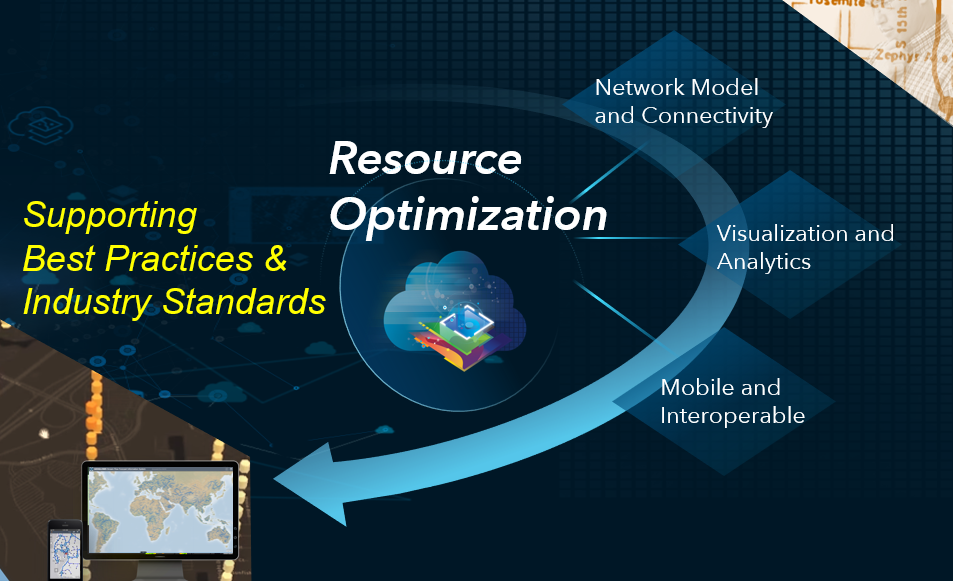
These days it seems the term resource optimization gets a lot of airtime and attention.  I mean, who among us doesn’t want to save money, spend less, work smarter not harder, and make the most of what we have to use?  At Esri, we believe the key to resource optimization is the incorporation of location into corporate strategy, communication and decision making.  No one conveys that message better than Jack Dangermond, who said, “Executives are waking up to realize that they can do a lot better, save money, make better decisions if they optimize and start thinking geographically and have a location strategy.”

Resource optimization is also a somewhat broad term.  I know what I think it means, just as you do, but our two understandings don’t always line up perfectly.  So we set out to ask a few geographically enlightened participants in the telecom and cable industry for their thoughts about resource optimization.  We asked big companies, small cooperatives, and contractors as well as senior leaders and individual contributors.  Here are some of their insights:


What does resource optimization mean to you as a telecom professional?

As expected, each answer was different.  Respondents described resource optimization as improving efficiency, achieving situational awareness, even breaking down silos. 

“Utilizing tools, information, and personnel in such a way to make a process or task more efficient.”

“I believe resource optimization is about having the highest level of situational awareness possible.  Through the highest possible situational awareness, an individual contributor, leader, or company can make the best possible decision needed to meet their customer needs and company goals.”

“Traditional telecom operations are very siloed.  Resource optimization, to me, means the removal of silos.  By having consistent information shared across an entire organization you can consistently achieve resource optimization.”


What’s your favorite story about maps and GIS impacting the use of resources?

Since everything in telecom happens somewhere, it’s no surprise that stories range from design to market analysis to operations to sales/customer service.  While everyone’s experience was different, their stories do prove that maps and spatial analysis can bring value to almost every aspect of a telecom’s business.

“We provide GIS data via the Explorer app to our field employees as well as contractors placing fiber on an overbuild project.  One of the supervisory contractors requested an account so he could utilize our GIS data in the field.  After a brief explanation of how to use the app, he was off and running.  Two days later, than same supervisor came back into my office to specifically thank me for it.  He explained how he was searching desperately for a copper pedestal but couldn’t find it.  He pulled out his phone and opened the app.  He discovered he was standing near the ped but had not walked into the woods on the side of the road.  After walking a few feet, he came right to the pedestal using the location services on his phone.  He was sold on it!”

“Our organization was running several design ‘what-if’ scenarios to help build our strategy around some government funding.  With GIS, we created a model with parameters and began creating rough designs that would enable us to serve 98% of a given market with specific levels of service.  Using this approach, we were able to evaluate 18 markets each day.  Previously, we would have manually drawn designs and maybe gotten through one market a day.”

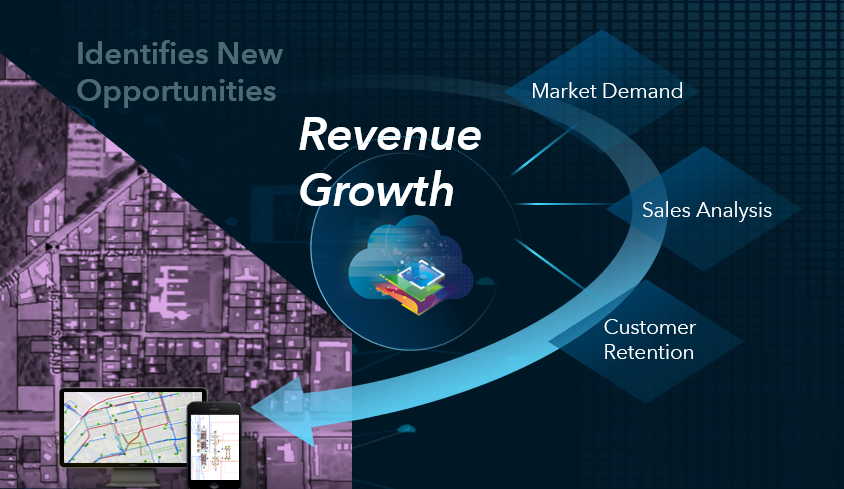
“Just recently, I shared our company’s network data overlayed with census data with our CEO.  The map clearly showed a growing population just outside our serving area.  I doubt seriously he would even be aware such a ripe area existed without seeing it geographically, which led to the logical decision to move into that area.  We would not have known this opportunity was there without combining outside information with our own company information and visualizing it on a map.”

“We have always been tasked with identifying which technology to use when servicing a new customer.  Before GIS, our company was slow to tell a prospective customer their max broadband speeds or what services we could offer.  We were able to optimize this process by implementing location based services through our GIS assets and geolocating each customer order.  With a simple polygon query, each customer service rep now knows immediately up front what technology will be used to serve the customer and therefore the max broadband speed and additional services.  We were then able to re-allocate several employees to perform other tasks.”

“Two projects for fiber design came in around the same time.  One was assigned to me, the other to one of my peers.  Each was around 300 miles.  My colleague used large format paper maps with hand-drawn designs.  He took three months and delivered 100 paper maps, which the customer couldn’t read or decipher.  I used GIS.  I completed the work, delivered the design, went through a review round, and moved onto construction in 3 weeks.  Needless to say, we ended up converting his paper maps to GIS to deliver.”

“One of my favorite GIS web apps we created helped provide situational awareness for our company.  It was a combination of multiple point and polygon layers providing a diverse view of operations.  The map showed existing and potential customers, products taken by current customers, past activity (such as outages, scheduled maintenance, new builds), planned activity potentially impacting customers, current service tickets, node utilization metrics, and technician service areas.  This one application helped in many ways.  Dispatch could better determine the best technician to send.  When multiple service tickets were in close proximity, a tech was sent to investigate a larger issue instead of sending multiple technicians to individual calls.  Numerous teams became aware of upcoming work, helping them prepare and plan instead of being surprised.  Teams once isolated by workflow were now able to see activities of other groups.  Teams could collaborate and combine work for the same scheduled maintenance activity to minimize impact on customers.  We also saw reduced expenses related to service tickets and reduced capital expenditures associated with cancelled jobs on new build activity.”


In your opinion, what will be the next big thing when it comes to GIS and resource optimization?  What will trailblazing companies do with GIS to impact resource optimization?

Lastly, we were curious what the industry thinks is next on the horizon.  A common thread seems to be digital transformation and data analytics.

“I believe as companies see their competition gaining competitive advantage in the marketplace through improved situational awareness, they too will work to improve their efforts or be left behind.  Trailblazing companies, ones leaving their competition behind, will focus on key foundational tasks in order to harness and utilize the full potential of GIS.  Many companies still use paper maps and records (yes, this is still a huge issue in the industry).  Converting those records to digital format and auditing existing digital datasets will improve overall accuracy, reduce the amount of time it takes to incorporate changes, give accurate information to field workers, and overall foster a culture of change and accountability.”

“Our company is currently building data analytics to identify current market drivers and predict future demand.  Engineering will then leverage this market map layer in conjunction with our existing infrastructure and construction budgets to help us get the most dollars for our construction.  Only then will the “where should we build next” question stop being an educated guess.  We’ll use data to drive what is most optimal for our company to get the most customers for our dollars going into the ground.”

 “I think it will be finding new ways to leverage technology and data and ultimately being able to visualize that data to create metrics or actionable items to proactively go after. If this information is assembled and shown in a way that can take very complex projects and simplifies them to a point to where it can show specifics on which areas are performing (or underperforming), or identify potential roadblocks or to help create trends and or project timelines, it can be impactful on the overall success of the project.  And what better way to simplify very complex information than on a map.  This approach will be leveraged to help transform the workforce of today and their existing skill sets to create the project workflow and reporting of the future.  It’s all about efficiency, and what better way to drive efficiency than to have metrics and data.  Think Moneyball in baseball.  Baseball has long been a sport driven by data (or statistics) but it wasn’t until recently that the numbers and statistics being tracked started to change and folks started looking at trends and tendencies.  Baseball was the first to fully adapt to this way of doing things, but I don't think there is a sports team out there that doesn’t have an analytics department constantly looking at data and identifying trends and create new strategies in an effort to find more success. The telecom industry is on the cusp of the exact same thing, from my perspective.”


So there you have it, straight from your peers in the industry.  Resource optimization is all about making the most of out of the assets at your disposal, whether that’s people, finances, equipment, or time.  You read their stories about how GIS improved their overall situation awareness, led to better decision making, save the company money, helped the organization spend money wisely, and ultimately improved customer satisfaction.   What do you think?  Share your own stories below in the comment section or click here to learn more about the ArcGIS technology these companies used.

more
4 0 2,535
SpatialNinja
Esri Regular Contributor

Limitations of 5G frequencies and fiber densification will create a dependency on GIS and geospatial technology not seen in previous wireless technologies. Check out the latest Geospatially Enabling Telecom Blog: 

TelcoProfessionals - Telecomblog Profile - Why the G in 5G should stand for Geospatial – Part 2 

more
0 0 689
SpatialNinja
Esri Regular Contributor

With 5G comes a dependency on location not seen in previous wireless technologies. In today's broadband economy, geospatial technology matters more than ever before, and the Science of Where is here to help. Check out the latest Geospatially Enabling Telecom Blog:

TelcoProfessionals - Telecomblog Profile - Why the G in 5G should stand for Geospatial – Part 1 

more
0 2 1,072
SpatialNinja
Esri Regular Contributor

In this next Geospatially Enabling Telecom blog we'll look at a few of the Esri solutions to help your organization optimize resources. Resource optimization is not only optimizing telecom networks, but optimizing the people, processes, and systems that maintain and manage telecom networks. Understanding network performance in order to build open networks with growth in mind, while maximizing capacity on existing networks are key to resource optimization. But ensuring the processes and people who plan, build, and maintain the networks and support systems are also optimized is crucial to long term sustainability of asset management.

Esri’s ArcGIS can help telecom organizations and communication service providers (CSPs) optimize their resources through the use of location intelligence and GIS technology. ArcGIS solutions provide an advanced network model, geospatial visualization and analytics, and mobile apps that leverage an open and interoperable complete GIS. 

Network Model and Connectivity

Fixed Wireless and Fiber Planning

ArcGIS models the entire network with spatially accurate data. It has the tools to model fiber, COAX, wireless, and hybrid networks as they really are on the ground. ArcGIS's system of record for communication networks offers connectivity modeling of assets in two and three dimensions, supporting best practices and industry standards.  By leveraging one complete GIS for managing all aspects of the network, from design to as-built, CSPs can ensure networks are optimized and the right network technology is built in the right location, at the right time.

Getting Started with Fixed Wireless and Fiber Planning

To get started and for more information, check out this blog on the next generation network management solution in ArcGIS, or view this story map for details on wireless planning solutions.

Visualization and Analytics

Territory Design

CSP’s want a greater insight into their operations and daily processes. Map visualization and spatial analysis can play a strong role in effectively managing people and processes. ArcGIS’s spatial analytics tools for territory design can optimize the areas a technician services to ensure jobs are getting completed as assigned and install windows are being met.

Getting Started with Territory Design

To get started and for more information, check out the territory design tool apart of ArcGIS Business Analyst.

Mobile and Interoperable

Drop/Bury Management

ArcGIS brings network functionality to any device, anytime, anywhere for complete operational awareness. Advanced data collection tools for the field shorten network build outs and improve asset inspections. Share the immediate state of assets and projects with corporate.  ArcGIS apps can also improve collaboration between contractors and CSPs to ensure network drops are buried in a timely fashion. Whatever the field workflow may be, ArcGIS apps can be configured to support it, and if not, the extensive developer framework allows for extending the mobile apps with open SDKs.

Getting Started with Drop/Bury Management

To get started and for more information, check out ArcGIS QuickCapture and Operations Dashboard. And for other examples of ArcGIS mobile apps supporting field operations, take a look at this story map.

Also, be sure to re-watch the whole Resource Optimization Webinar from late last year to see all of the Esri solutions in action. Please feel free to comment below on anything covered in this blog, and to provide feedback or offer suggestions on functionality you would like to see in any of the Esri resource optimization business offerings, and for more information on all of Esri's solutions for telecommunications visit Esri.com/telecom.

 Thanks,

- Esri Telecom Team

telecominfo@esri.com

telug‌

more
1 0 3,427
SpatialNinja
Esri Regular Contributor

In this next Geospatially Enabling Telecom blog we'll look at a few of the Esri solutions to help your organization grow revenue.  Communication Service Providers (CSPs) are always looking for ways to increase revenues. Revenue growth starts with understanding market demand and performing sales analytics. Next, it moves into ensuring a successful customer journey by accurately qualifying a prospect and service fulfillment. Finally, it goes into retaining and upselling the customer for continued revenue streams. Esri's solutions for revenue growth can help CSPs increase revenue by leveraging spatial analytics with existing market demand and sales analysis to locate high-growth areas and upsell opportunities, while enabling presales engineers and customer sales representatives (CSRs) to qualify customers in a quarter of the time. Esri also provides geospatial tools and maps to the organization for improving customer retention.  

Market Demand

Greenfield Opportunity Analysis

Understanding market demand allows for the right product or service to be offered to the right customer at the right time. With Esri's greenfield opportunity analysis solution you can easily locate market demand with geospatial analytics and Esri's demographic data.  With a GIS based service request app, you can start to capture the location of off-net service requests to be leveraged in network planning. And ArcGIS Business Analyst is a focused app to assist in greenfield opportunity analysis that brings together analytics and demographic data. The video below shows how you can leverage off-net service requests and ArcGIS Business Analyst.


Getting Started with Greenfield Opportunity Analysis

To get started and for more information, check out the service request solution template and take a look at the capabilities ArcGIS Business Analyst can offer for market analysis.

Sales Analytics

Upsell Opportunity Analysis

Spatial analytics support sales analytics in many ways—from retail analysis to customer 360 analysis to service qualification analysis. ArcGIS offers hundreds of ready-to-use spatial analytics tools to geographically analyze customer data and qualify customers faster. Create smart maps using ArcGIS Business Analyst that allows you to set an ideal customer demographic criteria, and locate all geographic areas that meet your criteria. See how in the video below.

Getting Started with Upsell Opportunity Analysis

To get started and for more information, check out the ArcGIS Business Analyst solution.

Serviceability & High-level Estimates

Enable staff in your organization to identify an optimized network route to customer locations by configuring the Serviceability and High-level Estimates solution. Serviceability lets pre-sales engineers to specify the customer’s location and determine the shortest route or use the business influence feature to find a route with maximum business potential. After determining the best route, save the results to share with your organization. Turn around service qualification requests faster with these serviceability and high-level estimate tools.

Serviceability & High-level Estimates - Instant Qualification

Serviceability & High-level Estimates - Network Planning

Getting Started with Serviceability & High-level Estimates

To get started and for more information, check out the downloadable solution template.

Customer Retention

Customer 360 Analysis

Reducing churn and upselling customers drive revenue growth. Boost customer engagement and improve the customer journey with ArcGIS. Geographically monitor NPS and customer sentiment and better understand the demographic characteristics of your customers.  With the customer 360 analysis tools in ArcGIS, you can analyze 100s of variables in your customer 360 database to better understand which variables impact churn.  Then use those analysis results as a model to run machine learning against your current customers to get alerts of when a customer is likely to churn.

Getting Started with Customer 360 Analysis

To get started and for more information, check out AI/ML tools in ArcGIS and the Forest-based Classification tools. 


Also, be sure to re-watch the whole Revenue Growth Webinar from earlier this year to see all of the Esri solutions in action.


Resource Optimization: Optimizing Assets, People, & Processes

In the next Geospatially Enabling Telecom blog we’ll look at how telecommunication companies are optimizing their assets and field operations with digital, real-time, map based analytics and mobile apps. We'll focus on some ways our uses are reducing trips to the field with ArcGIS Field Apps. Please feel free to comment below on anything covered in this blog, and to provide feedback or offer suggestions on functionality you would like to see in any of the Esri revenue growth business offerings, and for more information on all of Esri's solutions for telecommunications visit Esri.com/telecom

Thanks,

- Esri Telecom Team

 telecominfo@esri.com

telug

more
3 0 1,520
SpatialNinja
Esri Regular Contributor

This year’s GeoConX meetup held at the Cobb Galleria Centre in Atlanta, Georgia, saw the largest number of utility and telecom GIS professionals ever gathered to share their work, collaborate on new projects, and discuss new ways of leveraging GIS and location intelligence to support the telecom business.  The event kicked off with a half-day opening plenary session featuring geospatial thought leadership from Jack Dangermond, CEO of Esri, along with ArcGIS user presentations and ArcGIS technology updates.

Highlights from the plenary included a presentation from the University of Kentucky’s Eric Carroll on leveraging ArcGIS and its field capabilities to map UK's telecommunications backbone, creating a GIS fiber system of record for the entire campus. Adam Bakiera and Courtney Pesak from Guadalupe Valley Electric Cooperative (GVEC) shared during the plenary how they’ve created a simple, configurable, cohesive web mapping application, providing customers with the information they need about their broadband service, as well as capturing their interest, helping the cooperative better understand the customer’s needs to grow and expand their services to the community.

The opening session really set the energy for the rest of the week as there was a lot of buzz around how GIS supports fiber design and management, 5G and fixed wireless planning, and how to support the telecom business with maps and geospatial apps.  Here are a few of our favorite highlights during the week.


Telecom Peer Connects 

Connecting with peers is what GeoConX is all about. This year’s telecom peer connects session featured a panel with Gary Barden of American Tower, Derek Rieckmann of Midco, and Edward Gause of HTC. Lots of interesting Q&A and discussion around geospatial data quality and cleanup, fiber planning, service qualification, and enabling other parts of the business with maps and geospatial apps. Lots of common GIS related problems across tower providers, cable MSOs, and traditional carriers.


User Paper Sessions

Throughout the week, users of Esri’s ArcGIS shared how they are using GIS to help digitally transform their organizations to be the telecom of the future.  

  • Fiber Transport Modernization with GIS Insights - Trina Ivey, Senior Tech, Project/Program Manager for AT&T, shared how GIS solutions are being widely accepted in the telecom sector with the primary benefit being real-time accessibility and sharing of current information. Trina discussed how it’s important to consider the need to automate multiple workflows and different users (engineers, consultants, inspectors, managers, executives, and 3rd parties) who all need different tools to effectively perform their jobs. When all factors have been considered during design, the resulting GIS solution will drastically improve efficiencies for all users.
  • The IN of the Telecommunications Fiber Optic Infrastructure - Eric Carroll, Team Lead Utilities & Network GIS at University of Kentucky, showed how interior fiber optic network mapping on a geospatial platform is the way of the future. The ability to trace individual circuits, represent them in a geometric network, thus enabling analytics, maintenance scheduling and troubleshooting are powerful in their own right. Eric discussed how the University of Kentucky together with Geograph Technologies LLC, developed a method for collecting as-built information in a GIS. The solution presented combined ArcGIS for Desktop, ArcGIS for Server, the CrescentLink extension for ArcGIS, and Survey123 to showcase how data could be collected, processed and represented in a format that is logical and easy-to-use.
  • Operational Transformation with GIS - Derek Rieckmann, Director of GIS at Midco, showcased how geospatial technology continues to expand its influence on the way that MSOs operate. Through digital transformation of legacy mapping to a more spatially intelligent option, new methodologies have been implemented across the enterprise around activities like plant maintenance, extensions, and troubleshooting.  Derek highlighted that GIS is no longer just a system of record, but also becoming one of engagement and insight.  Rather than simply reading data, it is the authoritative source for many datasets.   Derek discussed the path Midco took from using GIS to record network information with very specific use cases, to an enterprise level platform with over 80% of employees directly using web delivered services.
  • GIS at American Tower: The Evolution Toward an Enterprise GIS - Gary Barden, GIS Program Manager at American Tower discussed how their GIS team is ever adapting to the changing wireless market, and how their team evolved over the years to meet the needs of customers, both internal and external.

Tech Updates & Hands-on Learning Lab

Numerous new updates to Esri technology were shown at GeoConX and following the positive feedback of the hands-on learning lab last year, the lab was brought back this year and even more Esri products were available for attendees to try out and play with, and training courses were available for attendees to work through while at the event.

New Tech Highlights:

  • Machine Learning Tools An update to the machine learning tools in ArcGIS was shared in a session that focused on spatial tools for classification, clustering, and prediction. Some of tools shown were Random Trees, Density-based Clustering, and Geographically Weighted Regression. Also, show was the integration of ArcGIS with external machine learning frameworks like TensorFlow and Scikit Learn. Image detection for detecting features in imagery, such as poles and sidewalks, gained a lot of interest from fiber planners.
  • Network Planning – During the plenary session new updates to ArcGIS Pro showcased dynamic map binning of call record and tower locations, and planning tools for fiber buildouts. The tools included optimized fiber route planning with ArcGIS Network Analyst and network tracing within the ArcGIS Utility Network Management. Re-watch the demonstration below.

  • Field Apps – The demonstrated Esri field apps showed how you can coordinate field activities using Workforce, how to efficiently get to the location of work using Navigator, how to gain spatial awareness and mark up maps using Explorer, how to accurately locate, capture and inspect assets using Collector, Survey123, and QuickCapture, and how you can improve accountability and enhance situational awareness using Tracker and Operations Dashboard.
  • Sensors, Big Data, and Analytics – Highlighted in this session was the ability to track field personnel as sensors, consuming their location with GeoEvent Server for visualization, geofencing, and storage for improved field operations and increased safety. GeoAnalytics Server was highlighted to help with the analysis of large collections of sensor data. Finally, a new Esri product in development was introduced: ArcGIS Analytics for IoT. This is a SaaS product that combines capabilities of GeoEvent Server and GeoAnalytics Server into a scalable, cloud-based product.
  • Business Analytics – New updates to ArcGIS Business Analyst were shown in a session that also highlighted greenfield opportunity analysis for broadband expansion and how to leverage Esri Demographics for upsell analysis. A crowd favorite was the improved dynamic infographics that can be configured and generated from apps across ArcGIS.


GeoConX Expo

Throughout the week, attendees had the opportunity to meet with Esri teams, including solutions engineers and product managers in the GeoConX Expo. 5G and fixed wireless planning seemed to be a top of everyone’s mind and new 3D analysis capabilities were shown at the Esri booth to assist in wireless planning.  Automating fiber design and field inspection workflows were also topics being discussed across the expo floor.


During the GeoConX Expo, Esri Partners showcased their latest solutions on top of ArcGIS for fiber, HFC, and copper network management, workflow automation, field operations, data migration, and more.


Another Fantastic GeoConX Event

This year’s GeoConX was another great meetup for GIS professionals in telecommunications, and we look forward to keeping the conversation going throughout the year, and seeing everyone at GeoConx 2020 in Denver, Colorado.  Be sure to stay engaged with the community on GeoNet, and register for the last telecommunications webinar of 2019, Resource Optimization on December 11th.

more
3 0 1,518
SpatialNinja
Esri Regular Contributor

In the last Geospatially Enabling Telecom blog we discussed Network Transformation and the impact 5G will have on communications networks.  To support Network Transformation, Esri and its Partner's solutions can be categorized into 4 main business offerings; Strategic Planning Tools, Desktop & Walkout Surveys, Network Design & Asset Management, and Project Tracking & Monitoring. While, the main focus of the previous blog was around Network Design & Asset Management solutions, this blog will take a look at the other solutions in these Network Transformation offering areas.


Strategic Planning Tools

Deployment of new wireless technologies, like 5G, and improvements to existing wireless networks are causing service providers to densify both their wireless antennas and their fiber networks.  But with limited CAPEX, services providers need to be strategic in where and when they perform network densification. Esri offers spatial analytical tools and models to help understand where network transformation should occur based historical network performance, market analysis, and business requirements. These tools can run in a desktop or server environment on hundreds or millions of data points. In the video below, a few of the Strategic Planning Tools are shown, including;

  • Clustering : Identifies statistically and geographically significant cluster of features
  • Snapping : Snaps features to lines and polygons for aggregated totals
  • Spatial Aggregation/Binning : Aggregates and summarizes features to other features like hexagon polygons
  • GeoEnrichment/Spatial Join : Appends attributes from one set of features to another set of features based on location
  • Site Suitability : Locate ideal locations based on overlaying and weighting input features
  • Space/Time Prediction : View patterns and trends over geographic space and time
  • ML Image Classification : Locate features in images or imagery based on training datasets

Big Data Toolkit

A new deployment option for the Strategic Planning Tools solution that has recently gained a lot of attention from ArcGIS users is the Big Data Toolkit.  This toolkit contains core ArcGIS spatial analysis tools that can be deployed into big data environments like Hadoop, and are run through Spark jobs.  This allows analysts to bring ArcGIS spatial analysis tools directly to large datasets, distribute analysis across nodes in a cluster, and perform spatial operations without spatial indexing, drastically improving performance and speed.  

Getting Started with Strategic Planning Tools

To deploy the Strategic Planning Tools within your organization, you have 3 main options, including Big Data Toolkit, depending on the analysis workflow and size of the datasets:

  1. ArcGIS Pro and ArcPy Python spatial libraries (core ArcGIS tools typically ran within a desktop environment)
  2. GeoAnalytics Server and Spatiotemporal Data Store (big data spatial analysis, bring the data to ArcGIS)
  3. Big Data Toolkit and ArcGIS (big data spatial analysis, bring ArcGIS to the data)

For more information on Esri's Strategic Planning Tools, check out this Story Map. https://arcg.is/1H1XH4 

Desktop & Walkout Surveys

While complete remote engineering is what we all strive for, its not always the case, and rolling a truck for pole audits and walkout surveys is part of the engineering process. Esri offers solutions for Desktop & Walkout Surveys that can help reduce truck rolls or site visits, while improving the efficiency of field work. Some of the ways that these ArcGIS solutions can aid your engineers and automate workflows are:

Desktop Surveys 

  • Automated fiber routing and if/then scenarios

  • Wireless planning and line of sight

  • Access to basemaps and geographic content from the Living Atlas

  • Heavy desktop solution or lightweight web apps

  • Integrated street view and image detection

  • Geographic data management

Walkout Surveys 

  • Cross platform configurable mobile apps
  • Offline mobile map books
  • Editing tools and redlining
  • Location based geotagging of photos
  • Integrated with Desktop Survey apps

Demo Video: Desktop & Walkout Survey Demo from Esri UC 2019 

Getting Started with Desktop & Walkout Surveys

To get started and for more information, check out this story map: https://arcg.is/1zKbbX 

Project Tracking & Monitoring

With the increased number of network build outs to support Network Transformation, project tracking and monitoring is more important today than ever before.  Engineers are designing networks on top of each other and in near real-time, and sales and operations teams need to know when projects will be completed.  So in order to make timely and accurate decisions, access to underlying data in an easy to interrupt format is a business necessity. Esri's Project Tracking & Monitoring solutions allow for visualizing data on a map or dashboard to better understand activities, projects, and operations. ArcGIS integrates existing data, metrics, and operational and analytical layers in a way that produces information valued by decision makers. Ensure all of your network transformation projects stay on time and on budget.

Demo Video: Project Tracking & Monitoring Demo from Esri UC 2019


Getting Started with Project Tracking & Monitoring

To get started and for more information, check out Network Transformation at esri.com/telecom

Also, be sure to re-watch the Network Transformation Webinar from earlier this year to see all of the Esri solutions in action.


Network Transformation: Modeling Fiber - Part 1

In the next Geospatially Enabling Telecom blog we’ll expand upon the second blog of the series and further discuss the simple network management capabilities and workflows available today, and the advanced network management capabilities and workflows coming with the addition of Object Classes in the utility network and the release of the Industry Configuration for fiber.  We'll also do a deeper dive on the first preview release of the fiber asset package data model. We'll follow up the 'Modeling Fiber' blog with additional blogs on the other Esri business offerings that support network transformation.  

Please feel free to comment below on anything covered in this blog, and to provide feedback or offer suggestions on functionality you would like to see in any of the Esri network transformation business offerings, and for more information on all of Esri's solutions for telecommunications visit Esri.com/telecom.

Thanks,

- Esri Telecom Team

 telecominfo@esri.com

telug‌

more
3 0 1,226
SpatialNinja
Esri Regular Contributor

There are plenty of rumors, miscommunication, and marketing around 5G and the size of the network investments, the value 5G will bring to end consumers, and the timelines for service roll out. Yet one thing that is clear, 5G is coming, and service providers are investing heavily in network transformation projects to densify wireless and fiber networks.  GIS and maps are playing a larger roll in the strategic planning, remote engineering, and operational awareness of these network transformation projects, and because of this, Esri has been investing in, and evolving ArcGIS to better support the geospatial requirements within telecommunications. This blog, and subsequent ones to come, will dive into more details on the Esri business offerings and the recent enhancements to ArcGIS that can help with network transformation.

To support 5G and fiber deployments, Esri and its Partner's solutions can be categorized into 4 main business offerings; Strategic Planning Tools, Desktop & Walkout Surveys, Network Design & Asset Management, and Project Tracking & Monitoring

Since understanding the location of existing network assets (towers, cables, cabinets, etc.) is a key component to planning, designing, and constructing new communications networks, the first business offering we'll explore is network design and asset management and the different tiers of GIS network management required to perform certain workflows, as well as the deployment options available today and in the future.  We'll cover the remaining network transformation business offerings in follow-on blogs, and be sure to re-watch the Network Transformation Webinar from earlier this year to see all of the Esri solutions in action.


Network Design & Asset Management

Esri and its Partners have offered network design and asset management solutions to the telecom industry for many years, and based on the business requirements and GIS maturity of an organization, ArcGIS is typically deployed to support a range of simple network management workflows to advanced network management workflows. Some examples of these two types of workflows include:

Tier 1 - Simple Network Management

  • Basic Physical Network Inventory (PNI)
  • Field Inspections
  • Serviceability Checks
  • Network Planning

Tier 2 - Advanced Network Management

  • Detailed PNI Including Ducts, Fiber Strands, & Ports
  • Logical Network Inventory (LNI)
  • Port to Port & Ring Management: Network Traces, OTDR Reports, Physical Redundancy Planning
  • Service & Channel Management: Circuit Trace, Channel Reports, Availability
  • Detailed Engineering & Design - Web and Mobile

With the recent release of the ArcGIS Utility Network Management extension, Esri has re-engineered its network modeling framework (previous network modeling framework was the Geometric Network) which supports network design & asset management solutions, giving ArcGIS users enhanced simple network management capabilities, while offering new advanced network management capabilities at a later release. This framework allows for better network modeling, enhanced visualization / embedded analytics, and easier network sharing.  Along with the release of this ArcGIS server extension, Esri’s Solutions Team is offering downloadable Industry Configurations (asset package data models + symbology + maps) for different industry domains which will allow users, developers, and Esri Partners to start modeling networks in the utility network and extending either simple or advanced solutions off it.

Over the coming months, as Esri further enhances the utility network and develops Industry Configurations for telecom to further support telecom networks (fiber, HFC/COAX, copper, & wireless/microwave) with advanced network management capabilities, we will be releasing a series of blogs apart of the Geospatially Enabling Telecom blog series, with documentation and best practices for how to model different telecom networks and devices within the utility network. The intent of this outreach is to educate and allow our users and Esri Partners to offer feedback and guidance for the direction of the Industry Configurations and core capabilities of the utility network in support of managing telecom networks. Because every organization models, manages, and designs networks in a slightly different way, we hope that the increase in transparency and communication with our users and Esri Partners will allow Esri to crowd-source and release best of breed Industry Configurations that support simple and advanced network management.  We are already engaged with many of our users and Esri Partners for validating our methodologies, and we hope to see that increase in the months to come. 

Modeling Telecom in the Utility Network

The first utility network Industry Configuration Esri will release for telecom networks will be for fiber (PON/GPON) networks.  While this is being developed by Esri, users and Esri Partners can design and deploy their own asset package data models on top of the utility network today to take advantage of simple network management. (To learn more about deploying your own asset package data model, please refer to this link.)

The utility network at the ArcGIS Enterprise 10.7.1 and ArcGIS Pro 2.4 release supports associations, containment, and connectivity of features with a spatial geometry. This means assets with a physical geometry (drawn on the map) can be managed and maintained within the utility network at its current release.  At a future release of the utility network, a new set of asset classes called Object Classes (edge & junction) will be introduced into the utility network to support management of non-spatial features. This will allow for associations and connectivity of features maintained in the utility network without requiring a physical geometry (not-drawn on the map). The diagram below shows a high-level conceptual view of the main fiber assets aligned to the utility network tiers and asset classes of the utility network. This includes physical assets that could be managed today (simple network management) by building your own asset package data model on the utility network, and non-spatial assets that could be managed at a later release of the utility network (advanced network management), or managed today through Partner solutions and the older Geometric Network framework. 

As you can see in the diagram above, the physical location and attributes for telecom sites, structures, equipment, span, and cables can be managed in the utility network today. This would provide simple network management and allows for containment on these features.  To support many of the non-spatial assets in a fiber network, like fiber strand and ports, and to run connectivity traces, the Object Classes (non-spatial tables) will be essential additions to the utility network set of asset classes providing advanced network management.  

Getting Started with Network Design & Asset Management

For those looking to leverage ArcGIS for network design & asset management here are the options today and in the future:

For simple network management today, ArcGIS with either a geodatabase, a geodatabase + Geometric Network, or ArcGIS + Utility Network Management extension is required to store asset locations and attribution about those assets.  Simple network management will enable a base set of capabilities and workflows for your organization. For advanced network management today, ArcGIS with a geodatabase + Geometric Network is required, and typically an Esri Partner solution built on top. At a future release of the utility network, ArcGIS + Utility Network Management will bring advanced network management capabilities to the table for users and Partners to build solutions around.  Also, keep in mind that Esri Partners and the user community are key to extending both simple and advanced network management capabilities offered by ArcGIS in order to build complete network management solutions for your organization.

Here is some additional guidance depending on if you are looking to deploy simple or advanced network management:

****For access to early version previews of the Industry Configurations for telecom, including asset package data models, please refer to this discussion thread: https://community.esri.com/message/717465-telecom-industry-configurations-for-arcgis-utility-network...

For more information and resources on the ArcGIS Utility Network Management extension, please refer to: https://www.esri.com/en-us/arcgis/products/arcgis-utility-network-management/resources 

Network Transformation: Strategic Planning, Remote Engineering, & Operational Awareness

In the next Geospatially Enabling Telecom blog we’ll look at other workflows in the Network Transformation process that surround Network Design & Asset Management. We'll highlight big data tools, fiber routing and planning tools, and dashboards for monitoring projects.

Please feel free to comment below on anything covered in this blog, and to provide feedback or offer suggestions on functionality you would like to see in any of the Esri network transformation business offerings, and for more information on all of Esri's solutions for telecommunications visit Esri.com/telecom.

Thanks,

- Esri Telecom Team

 telecominfo@esri.com

telug‌

more
6 0 3,513
SpatialNinja
Esri Regular Contributor

This years Esri Users Conference was another great event for GIS users in telecommunications.  One apparent observation was that the need for GIS and maps in support of telecom workflows is growing, and not only for traditional telecom service providers but for other industries that are starting to, or have been, deploying communications networks.  Because of this growing demand for GIS in telecom, the Esri Telecom Team will be releasing a series of blogs in correlation with the ongoing Telecommunications Webinar Series to explore new ways of Geospatially Enabling Telecom.  The ongoing webinar series and these blogs will look at how GIS and maps can support all aspects of the telecom business from network planning, to fulfillment, to assurance and how GIS directly impacts today's trends and driver's in the industry. The business drivers we'll focus on and explore GIS use cases within will be Network Transformation, Resource Optimization, Revenue Growth, Customer Experience, and Digital Services.

A Complete GIS for Telecommunications

In order to support the above technology trends and business drivers, GIS has needed to evolve from simple mapping software to a complete GIS platform supported by geospatial infrastructure.  This geospatial infrastructure which includes a system of record, system of engagement, and system of insights is moving into the cloud and giving organizations a web GIS, opening up geospatial web services for consumption in different OSS/BSS applications.


ArcGIS is the only Complete GIS digitally transforming telecommunications that offers geospatial infrastructure and focused business offerings designed specifically for telecommunications.  In the blogs to come we'll dive deeper into Esri's focused business offerings for telecommunications and how they support today's industry drivers along with how to get started with the solution.  Some of the offerings to look out for include:

Network Transformation (Watch Webinar)

Resource Optimization (Register for Webinar)

Revenue Growth (Watch Webinar)

Customer Experience (Watch Webinar)

Digital Services (Register for Webinar)

Network Transformation: A Strategic Investment in New Capabilities

In the next Geospatially Enabling Telecom blog we’ll discuss Esri's offerings for Network Transformation and how GIS is supporting network projects around 5G and fiber deployments. For more information on all of Esri's solutions for telecommunications visit Esri.com/telecom.

Thanks,

- Esri Telecom Team

 telecominfo@esri.com

telug‌

more
2 0 2,205
SpatialNinja
Esri Regular Contributor

Updates to original script in comments below - 9/5/2019

With hurricane season upon us, I wanted to share a simple but powerful python script which locates assets that are in path of a major storm.  The script leverages the ArcGIS Python API and can be run manually or automatically from a variety of sources, which I'll cover later on.  The script also requires that your asset locations are in a feature layer within your GIS portal, along with a polygon feature layer used as a storm track, and a layer to add your alarms or vulnerable assets to. The script is attached below, but lets first break it down.

First, import the necessary ArcGIS python libraries and authenticate into your GIS portal.  Since this script uses feature layers, we'll mostly use the arcgis.features module.

from arcgis.gis import GIS
from arcgis.features import FeatureLayer
from arcgis.features.managers import FeatureLayerManager
from arcgis.geometry import filters
from IPython.display import display
gis = GIS("https://your.portal.here/", 'username', 'password')‍‍‍‍‍‍‍‍‍‍‍‍‍‍‍‍‍‍‍‍‍‍‍‍‍‍‍‍‍‍‍‍‍‍‍‍‍‍‍‍‍‍‍‍‍‍‍‍

Next we'll load in the feature layers used in the script. The script requires a point feature layer of your asset locations, a polygon feature layer of your storm track, and another point layer used as alarms or your vulnerable asset locations.

Ninja Pro Tip: Leverage the Active Hurricane live feed from Esri's Living Atlas as your storm strack.

#assets layer
cellSiteFeatureLayer = gis.content.get('88b5acd4444343b3bdaea40918d070bf')
#storm track layer
hurricaneFeatureLayer = gis.content.get('6c8256c93c0e40debe46d9dcf79d0049')
#alarms layer
warningsFeatureLayer = gis.content.get('6f735776f0c246b1ba602a774dbc1b1d')‍‍‍‍‍‍‍‍‍‍‍‍‍‍‍‍‍‍‍‍‍‍‍‍‍‍‍‍‍‍‍‍‍‍‍‍‍‍‍‍‍‍

Next, well truncate and clear out previous alarms and vulnerable assets from the alarms layers.

warningsLayer = warningsFeatureLayer.layers[0]
warningsLayer.manager.truncate()‍‍‍‍‍‍‍‍‍‍‍‍

Then, well store the current geometry of the polygon layer or the storm track which will be used to query the assets that fall within it.

hurricaneFeatures = hurricaneFeatureLayer.layers[8]
queryHurricane = hurricaneFeatures.query(where='1=1')
hurricaneGeometry = queryHurricane.features[3].geometry
##print (hurricaneGeometry)‍‍‍‍‍‍‍‍‍‍‍‍‍‍‍‍‍‍‍‍‍‍‍‍

Now we'll the use the geometry we just stored as the spatial geometry filter for our query on the assets layer.

cellSiteFeatures = cellSiteFeatureLayer.layers[0]
warningsResult = cellSiteFeatures.query(where='1=1', out_fields='SiteID', geometry_filter=filters.intersects(hurricaneGeometry))
##print(warningsResult)‍‍‍‍‍‍‍‍‍‍‍‍‍‍‍‍‍‍

Finally, take the feature set returned by the query and add the features to the alarm layer.

warningsLayer.edit_features(adds=warningsResult)
‍‍‍‍‍‍‍‍‍‍‍

And that's it. The result is new point locations showing you where assets fall within a storm track.

The script can be run in variety of locations depending on the experience you want for the end user.  Here some options:

  1. Locally in your own IDE
  2. Within ArcGIS Pro as a GP tool
  3. Shared as a GP service and leveraged in the GP widget of Web AppBuilder
  4. Brought into ArcGIS Notebook server
  5. Ran automatically using Windows Task Scheduler 

Ninja Pro Tip: Leverage Operations Dashboard for ArcGIS to view the results of the analysis.

Patrick Huls

Solution Engineer Team Lead - Telecommunications

LinkedIn: Patrick Huls| Twitter: @SpatialNinja| GeoNet:Phuls-esristaff

more
5 3 2,762
85 Subscribers