- Home
- :
- All Communities
- :
- Products
- :
- Spatial Statistics
- :
- Spatial Statistics Questions
- :
- Re: How to remove observer bias from grid based ob...
- Subscribe to RSS Feed
- Mark Topic as New
- Mark Topic as Read
- Float this Topic for Current User
- Bookmark
- Subscribe
- Mute
- Printer Friendly Page
How to remove observer bias from grid based observations
- Mark as New
- Bookmark
- Subscribe
- Mute
- Subscribe to RSS Feed
- Permalink
- Report Inappropriate Content
Hi all
I have old animal sightings data that I want to analyse for distribution, frequency and landscape utilization. However the data was captured using a grid system where all animals seen within a specific grid cell get assigned the coordinate of the bottom left corner of the cell.
The area is fairly mountainous and there seems to be a strong bias towards grid cells with roads through them.
Is there a way to quantify and or remove this bias?
Any suggestions would be welcome.
Regards
Chenay
- Mark as New
- Bookmark
- Subscribe
- Mute
- Subscribe to RSS Feed
- Permalink
- Report Inappropriate Content
Image?
- Mark as New
- Bookmark
- Subscribe
- Mute
- Subscribe to RSS Feed
- Permalink
- Report Inappropriate Content
Hi Dan
No, the records are captured as points. The reserve was divided into a reference grid of 1 * 1km cells that were used to assign a location to the sightings (so one location was given to all the sightings within that grid).
I had thought of transforming the points to a raster but there are too many variables in the attribute table that I need to keep.
Thanks
Chenay
- Mark as New
- Bookmark
- Subscribe
- Mute
- Subscribe to RSS Feed
- Permalink
- Report Inappropriate Content
I think Dan Patterson refers to "A picture is worth a thousand words"... Can you include a screenshot of your data to show what we are taling about?
- Mark as New
- Bookmark
- Subscribe
- Mute
- Subscribe to RSS Feed
- Permalink
- Report Inappropriate Content
Sorry 🙂
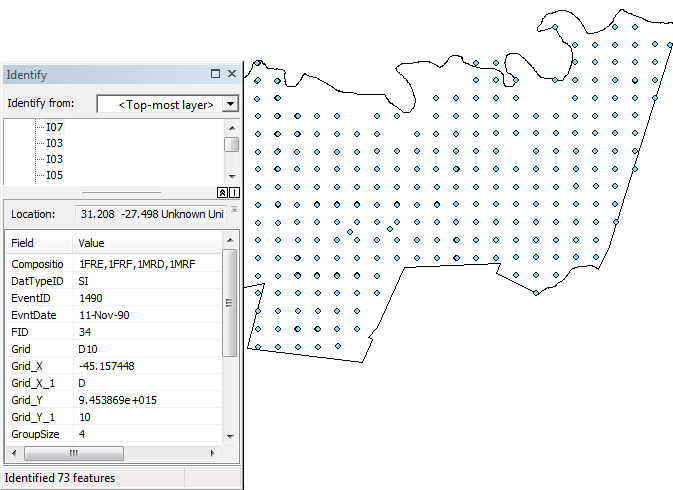
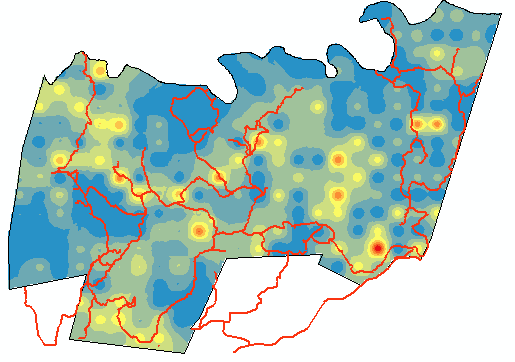
Included here is the point data as well as the results of an identify of one of the points (you can see that this one point has 73 records associated with it). Below that is a quick density map using all the points with the roads overlayed on it. There roads to the south and west are the most frequently used roads whilst the roads to the east are used fairly infrequently. There seems to be a correlation between them and animal densities...... There is also some terrain bias but at first glance it is not as influential.
- Mark as New
- Bookmark
- Subscribe
- Mute
- Subscribe to RSS Feed
- Permalink
- Report Inappropriate Content
Are the point the you are showing on the lower left corner of the grid cell, or did you correct them to be moved to the middle of the cell? I also see some points that don't seem to follow that pattern and some points that almost overlap at some locations. What is happening there?
If it is animal distribution that you are after, it may be difficult to determine this based on sightings. If in area there haven't been observed this does not mean that there aren't any animals. What is really the effect of the roads that are more used on your animal sightings? As Ben Leslie states, you may need additional data to be able to say something about the animal density if that is what you are after.
- Mark as New
- Bookmark
- Subscribe
- Mute
- Subscribe to RSS Feed
- Permalink
- Report Inappropriate Content
Hi Xander
I have not finished my data cleaning yet hence the discrepancies. Some of the later data was captured using GPS's which resulted in some points not following the grid pattern. Also some observers used more/less decimals in the grid coordinates when recording the sightings hence the slight shift in some of the observations 😞
Thanks for the inputs
- Mark as New
- Bookmark
- Subscribe
- Mute
- Subscribe to RSS Feed
- Permalink
- Report Inappropriate Content
OK, makes sense.
Question: what are you exactly trying to obtain with this analysis?
- Mark as New
- Bookmark
- Subscribe
- Mute
- Subscribe to RSS Feed
- Permalink
- Report Inappropriate Content
Hi Xander
The protected area we are working in has seen a relatively large number of animal mortalities due to fighting. This study is trying to work out the cause of this (too high population densities, competition for resources…..) We are thus trying to get a reliable density map that will eventually feed into a landscape and social analysis.
Thanks
- Mark as New
- Bookmark
- Subscribe
- Mute
- Subscribe to RSS Feed
- Permalink
- Report Inappropriate Content
That is indeed a confusing distribution, because in some areas, yellow/red is clustered (Y) near the roads and in other areas the opposite is true (N).
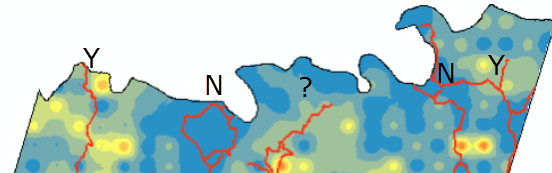
It even gets more confusing as you head south