- Home
- :
- All Communities
- :
- Products
- :
- Spatial Data Science
- :
- Spatial Data Science Questions
- :
- Re: point cloud to polyline feature
- Subscribe to RSS Feed
- Mark Topic as New
- Mark Topic as Read
- Float this Topic for Current User
- Bookmark
- Subscribe
- Mute
- Printer Friendly Page
- Mark as New
- Bookmark
- Subscribe
- Mute
- Subscribe to RSS Feed
- Permalink
- Report Inappropriate Content
Hey Everyone,
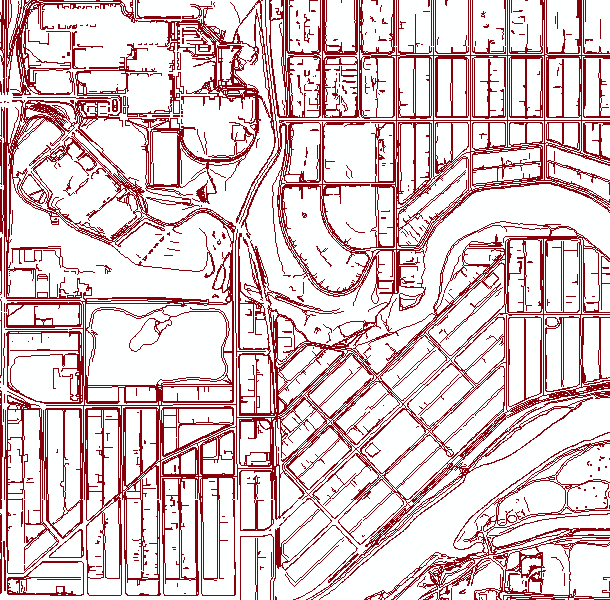
I have a txt file with x,y,z and 0/1 columns. There are about 35000 point coordinates. When displayed, a pattern is clearly visible. How should i convert it to a line feature so that it can be used as a barrier in IDW interpolation. Please note: I already tried point to line feature tool but that doesn't follow the point pattern.
Any help would be appreciated.
Thanks
Solved! Go to Solution.
- Mark as New
- Bookmark
- Subscribe
- Mute
- Subscribe to RSS Feed
- Permalink
- Report Inappropriate Content
Wherever you see a 0, that means its a start of a new line.
so, for example:
X Y Z 0 ->Start of new line segment
X Y Z 1
X Y Z 1 ->End of this line segment
X Y Z 0 -> Start of a new line segment
X Y Z 1
X Y Z 1
- Mark as New
- Bookmark
- Subscribe
- Mute
- Subscribe to RSS Feed
- Permalink
- Report Inappropriate Content
you just posted the information required sorry... then what I suggested is the way that the log could be parsed to produce separate segments
- Mark as New
- Bookmark
- Subscribe
- Mute
- Subscribe to RSS Feed
- Permalink
- Report Inappropriate Content
Could you guide me to get me started on it. What exactly should I search for?
- Mark as New
- Bookmark
- Subscribe
- Mute
- Subscribe to RSS Feed
- Permalink
- Report Inappropriate Content
If fact can you confirm the whole column header list. I have seen the 0,1 thing in some gps outputs indicating the start and stop of a tracklog and/or when movement paused sufficiently long enough that the log resets its self, however, the continuous tracklog keeps going. There is no guarantee that the numbers before and after a 1, 0,1 triplet will be the same, since it can take some time before a unit realises that it is moving again. But if the headers could be confirmed then the distance between points could be calculated as Xander suggests and the log could be split accordingly
- Mark as New
- Bookmark
- Subscribe
- Mute
- Subscribe to RSS Feed
- Permalink
- Report Inappropriate Content
The data/header is confirmed.
- Mark as New
- Bookmark
- Subscribe
- Mute
- Subscribe to RSS Feed
- Permalink
- Report Inappropriate Content
That makes more sense...
I first started to play with the max distance between two vertices and with 10 meters it started to make sense, yet created some errores. With the 0 as beginning of a new line it is much better:
If you're interested I can include the code. Is is ugly, but it worked.
- Mark as New
- Bookmark
- Subscribe
- Mute
- Subscribe to RSS Feed
- Permalink
- Report Inappropriate Content
OK, just in case you're interested, but I'm sure Dan will come up with a better solution:
import arcpy

import os
import math

txt = r"D:\Xander\GeoNet\PointCloud\sample.txt"
fc_pnt = r"D:\Xander\GeoNet\PointCloud\gdb\test.gdb\points05"
fc_lines = r"D:\Xander\GeoNet\PointCloud\gdb\test.gdb\lines05"
max_dist = 25

arcpy.env.overwriteOutput = True
# sr = arcpy.SpatialReference()

# create empty fc
pnt_ws, pnt_name = os.path.split(fc_pnt)
arcpy.CreateFeatureclass_management(pnt_ws, pnt_name, "POINT", "#", "DISABLED", "ENABLED")

fld_X = "X"
fld_Y = "Y"
fld_Z = "Z"
fld_A = "Att"
fld_dist = "Dist"

arcpy.AddField_management(fc_pnt, fld_X, "Double")
arcpy.AddField_management(fc_pnt, fld_Y, "Double")
arcpy.AddField_management(fc_pnt, fld_Z, "Double")
arcpy.AddField_management(fc_pnt, fld_A, "Integer")
arcpy.AddField_management(fc_pnt, fld_dist, "Double")

flds = ("SHAPE@", fld_X, fld_Y, fld_Z, fld_A, fld_dist)

lst_lines = []
with arcpy.da.InsertCursor(fc_pnt, flds) as curs:
    # open txt file
    arr_line = arcpy.Array()
    i = 0
    with open(txt, 'r') as f:
        for r in f.readlines():
            i += 1
            r = r.replace('\n', '')
            lst = r.split(' ')

            if i % 1000 == 0:
                print "Processing line: {0}".format(i)

            if i == 1:
                x = float(lst[3])
                y = float(lst[5])
                xp = x
                yp = y
            else:
                xp = x
                yp = y
                x = float(lst[3])
                y = float(lst[5])

            z = float(lst[10])
            a = int(lst[12])

            dist = math.hypot(xp-x, yp-y)
            pnt = arcpy.Point(x, y, z)
            pnt_g = arcpy.PointGeometry(pnt)

            curs.insertRow((pnt_g, x, y, z, a, dist, ))

##            if dist < max_dist:
##                # add to line
##                arr_line.add(pnt)
##            else:
##                # add previous line to list
##                if arr_line.count > 1:
##                    polyline = arcpy.Polyline(arr_line)
##                    lst_lines.append(polyline)
##
##                # create a new line
##                arr_line = arcpy.Array()
##                arr_line.add(pnt)

            if a == 1:
                # add to line
                arr_line.add(pnt)
            else:
                # add previous line to list
                if arr_line.count > 1:
                    polyline = arcpy.Polyline(arr_line)
                    lst_lines.append(polyline)

                # create a new line
                arr_line = arcpy.Array()
                arr_line.add(pnt)

arcpy.CopyFeatures_management(lst_lines, fc_lines)
- Mark as New
- Bookmark
- Subscribe
- Mute
- Subscribe to RSS Feed
- Permalink
- Report Inappropriate Content
- Mark as New
- Bookmark
- Subscribe
- Mute
- Subscribe to RSS Feed
- Permalink
- Report Inappropriate Content
Sorry I don't have time to finish it right now, but I will provide a numpy solution that at least splits your array into its component parts. These can then be used to reassemble polylines. I will try to return to this later in case anyone hasn't come up with a simple solution...but this one took no time to implement up to the part of using the output results to reassemble. I just grabbed some of your data and made a list of tuples of coordinates, converted them to an ndarray and gave them some headers, then split up the data (aka...an array) into subarrays, which can then be reassembled into polylines using geometry objects.
>>>
>>> import numpy as np
>>> np.set_printoptions(precision=4,threshold=10,edgeitems=3,linewidth=60, suppress=True,)
>>>
>>> a = [(-5669.381,  5657594.686,1047.036,  0),
   (-5653.986,  5657609.230,     1046.894,  1),
   (-5645.052,  5657617.510,     1046.794,  1),
   (-5637.189,  5657624.986,     1046.734,  1),
   (-5629.506,  5657624.986,     1046.501,  0),
   (-5638.223,  5657616.218,     1046.584,  1),
   (-5648.777,  5657606.484,     1046.654,  1),
   (-5669.381,  5657587.371,     1046.869,  1),
   (-5669.382,  5657530.797,     1046.489,  0),
   (-5668.446,  5657531.698,     1046.485,  1)]
>>>
>>> arr = np.array(a,dtype= [('x','<f8'),('y','<f8'),('z','<f8'),('split','<i4')])
>>> arr
array([(-5669.381, 5657594.686, 1047.036, 0),
       (-5653.986, 5657609.23, 1046.894, 1),
       (-5645.052, 5657617.51, 1046.794, 1),
       (-5637.189, 5657624.986, 1046.734, 1),
       (-5629.506, 5657624.986, 1046.501, 0),
       (-5638.223, 5657616.218, 1046.584, 1),
       (-5648.777, 5657606.484, 1046.654, 1),
       (-5669.381, 5657587.371, 1046.869, 1),
       (-5669.382, 5657530.797, 1046.489, 0),
       (-5668.446, 5657531.698, 1046.485, 1)],
      dtype=[('x', '<f8'), ('y', '<f8'), ('z', '<f8'), ('split', '<i4')])
>>>
>>> # get the indices where 0 occurs in the split column
>>>
>>> indx = np.where(arr['split']==0)   # the where clause
>>> indx                               # it returns a tuple containing an array
(array([0, 4, 8]),)
>>>
>>> indices = indx[0].tolist()         # convert the first tuple to a list
>>>
>>> out = np.split(arr,indices,axis=0) # split the array using the indices
>>>
>>> for i in out:                      # here it is for further processing
...  print "\n", i
...
[]
[(-5669.381, 5657594.686, 1047.036, 0)
 (-5653.986, 5657609.23, 1046.894, 1)
 (-5645.052, 5657617.51, 1046.794, 1)
 (-5637.189, 5657624.986, 1046.734, 1)]
[(-5629.506, 5657624.986, 1046.501, 0)
 (-5638.223, 5657616.218, 1046.584, 1)
 (-5648.777, 5657606.484, 1046.654, 1)
 (-5669.381, 5657587.371, 1046.869, 1)]
[(-5669.382, 5657530.797, 1046.489, 0)
 (-5668.446, 5657531.698, 1046.485, 1)]
>>>
- Mark as New
- Bookmark
- Subscribe
- Mute
- Subscribe to RSS Feed
- Permalink
- Report Inappropriate Content
Sorry I am late...
This is the numpy version without Xander's 3D point file and the distance calculations.
It is fairly short and gets the job done.
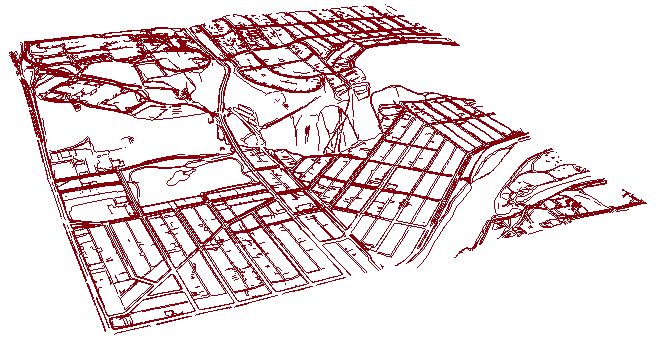
One comment, about the data structure. There are many parallel lines which I presume are curbside points. If your final attempt is to produce a barriers file for IDW interpolation, I can assure you that it will fail miserably since you have far too many barriers and some of them are extremely close together...
...
But non-the-less... your gps data can be convert to polylines using Xander's approach or mine. EDIT..added import arcpy which I cut off
Good luck
# textfile_array.py
import arcpy
import numpy as np
np.set_printoptions(precision=4,threshold=10,edgeitems=3,linewidth=60, suppress=True,)
# data type assumes prior knowledge of data structure
dt = [('x','<f8'),('y','<f8'),('z','<f8'),('split','<i4')] #assumes prior knowledge
# read the text file and specify an output file
arr = np.loadtxt('c:/temp/sample.txt',dtype=dt,unpack=False)
output_shp = 'c:/Temp/x.shp' # alter to suit
indx = np.where(arr['split']==0) # the where clause
indices = indx[0].tolist() # convert the first tuple to a list
out = np.split(arr,indices,axis=0) # split the array using the indices
all_shps = [] # store the polylines
print "\nProcessing array, N = ", np.size(arr)
print "with sub arrays, n = ", np.size(out,axis=0)
for sub in out: # for each sub list
if np.size(sub,axis=0) < 2: # dump anything with too few points
print "too few points"
else:
pnts = []
for i in sub:
pnts.append(arcpy.Point(X=i[0],Y=i[1],Z=i[2]))
p_arr = arcpy.Array(pnts)
p_line = arcpy.Polyline(p_arr)
all_shps.append(p_line)
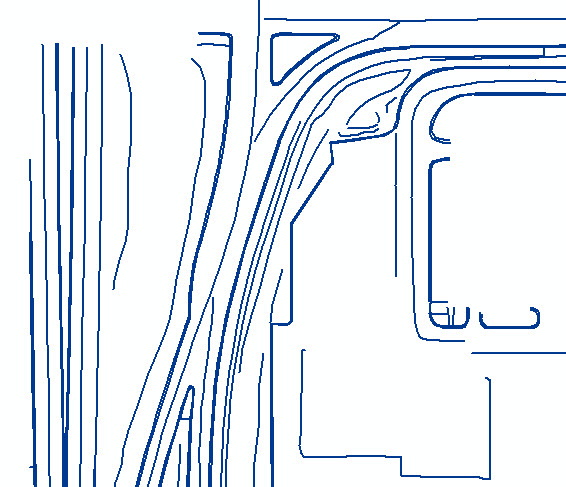
arcpy.CopyFeatures_management(all_shps, output_shp)See the close-up image for what I mean
- « Previous
-
- 1
- 2
- Next »
- « Previous
-
- 1
- 2
- Next »