- Home
- :
- All Communities
- :
- Products
- :
- Spatial Data Science
- :
- Spatial Data Science Questions
- :
- Re: point cloud to polyline feature
- Subscribe to RSS Feed
- Mark Topic as New
- Mark Topic as Read
- Float this Topic for Current User
- Bookmark
- Subscribe
- Mute
- Printer Friendly Page
- Mark as New
- Bookmark
- Subscribe
- Mute
- Subscribe to RSS Feed
- Permalink
- Report Inappropriate Content
Hey Everyone,
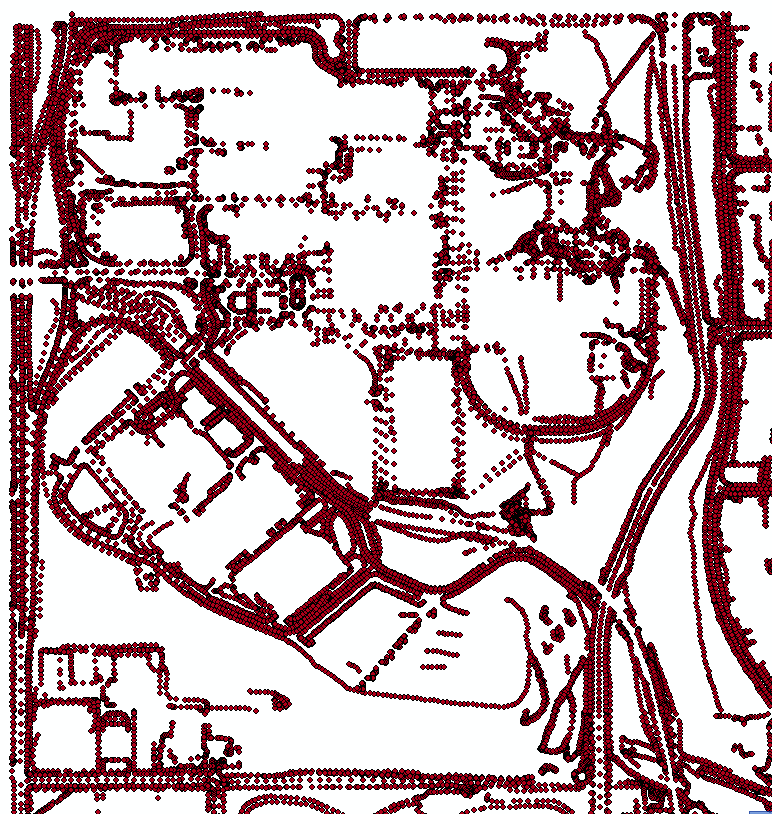
I have a txt file with x,y,z and 0/1 columns. There are about 35000 point coordinates. When displayed, a pattern is clearly visible. How should i convert it to a line feature so that it can be used as a barrier in IDW interpolation. Please note: I already tried point to line feature tool but that doesn't follow the point pattern.
Any help would be appreciated.
Thanks
Solved! Go to Solution.
Accepted Solutions
- Mark as New
- Bookmark
- Subscribe
- Mute
- Subscribe to RSS Feed
- Permalink
- Report Inappropriate Content
OK, just in case you're interested, but I'm sure Dan will come up with a better solution:
import arcpy

import os
import math

txt = r"D:\Xander\GeoNet\PointCloud\sample.txt"
fc_pnt = r"D:\Xander\GeoNet\PointCloud\gdb\test.gdb\points05"
fc_lines = r"D:\Xander\GeoNet\PointCloud\gdb\test.gdb\lines05"
max_dist = 25

arcpy.env.overwriteOutput = True
# sr = arcpy.SpatialReference()

# create empty fc
pnt_ws, pnt_name = os.path.split(fc_pnt)
arcpy.CreateFeatureclass_management(pnt_ws, pnt_name, "POINT", "#", "DISABLED", "ENABLED")

fld_X = "X"
fld_Y = "Y"
fld_Z = "Z"
fld_A = "Att"
fld_dist = "Dist"

arcpy.AddField_management(fc_pnt, fld_X, "Double")
arcpy.AddField_management(fc_pnt, fld_Y, "Double")
arcpy.AddField_management(fc_pnt, fld_Z, "Double")
arcpy.AddField_management(fc_pnt, fld_A, "Integer")
arcpy.AddField_management(fc_pnt, fld_dist, "Double")

flds = ("SHAPE@", fld_X, fld_Y, fld_Z, fld_A, fld_dist)

lst_lines = []
with arcpy.da.InsertCursor(fc_pnt, flds) as curs:
    # open txt file
    arr_line = arcpy.Array()
    i = 0
    with open(txt, 'r') as f:
        for r in f.readlines():
            i += 1
            r = r.replace('\n', '')
            lst = r.split(' ')

            if i % 1000 == 0:
                print "Processing line: {0}".format(i)

            if i == 1:
                x = float(lst[3])
                y = float(lst[5])
                xp = x
                yp = y
            else:
                xp = x
                yp = y
                x = float(lst[3])
                y = float(lst[5])

            z = float(lst[10])
            a = int(lst[12])

            dist = math.hypot(xp-x, yp-y)
            pnt = arcpy.Point(x, y, z)
            pnt_g = arcpy.PointGeometry(pnt)

            curs.insertRow((pnt_g, x, y, z, a, dist, ))

##            if dist < max_dist:
##                # add to line
##                arr_line.add(pnt)
##            else:
##                # add previous line to list
##                if arr_line.count > 1:
##                    polyline = arcpy.Polyline(arr_line)
##                    lst_lines.append(polyline)
##
##                # create a new line
##                arr_line = arcpy.Array()
##                arr_line.add(pnt)

            if a == 1:
                # add to line
                arr_line.add(pnt)
            else:
                # add previous line to list
                if arr_line.count > 1:
                    polyline = arcpy.Polyline(arr_line)
                    lst_lines.append(polyline)

                # create a new line
                arr_line = arcpy.Array()
                arr_line.add(pnt)

arcpy.CopyFeatures_management(lst_lines, fc_lines)
- Mark as New
- Bookmark
- Subscribe
- Mute
- Subscribe to RSS Feed
- Permalink
- Report Inappropriate Content
do you have a picture of the pattern? The line will follow the pattern that they are in within the file, not as you see them on screen
- Mark as New
- Bookmark
- Subscribe
- Mute
- Subscribe to RSS Feed
- Permalink
- Report Inappropriate Content
Maybe you could convert the point cloud to raster (each point the same value) and then convert the raster to polygons (or line if possible) and use that as pattern. Dan Patterson is absolutely right and yes it would be interesting to see what this pattern looks like. It will also to see if what I'm suggesting will work for your case or not...
- Mark as New
- Bookmark
- Subscribe
- Mute
- Subscribe to RSS Feed
- Permalink
- Report Inappropriate Content
- Mark as New
- Bookmark
- Subscribe
- Mute
- Subscribe to RSS Feed
- Permalink
- Report Inappropriate Content
if your points were collected via a gps, it appears you downloaded waypoints which have not been differentiated as to which route they were collected for. It is merely connecting all the point in the order they were collected. You could separate them out into the tracklines if that information was collected. Alternately, if you collected tracks and started and stopped the tracks properly, then you already have the data...otherwise, you could use the trackline and split it up into its component parts. This will probably take as much time as other solutions and will probably yield superior data. When saving tracks, make sure you delete the tracklog between each save otherwise, the whole log will be sequentially appended to each save
- Mark as New
- Bookmark
- Subscribe
- Mute
- Subscribe to RSS Feed
- Permalink
- Report Inappropriate Content
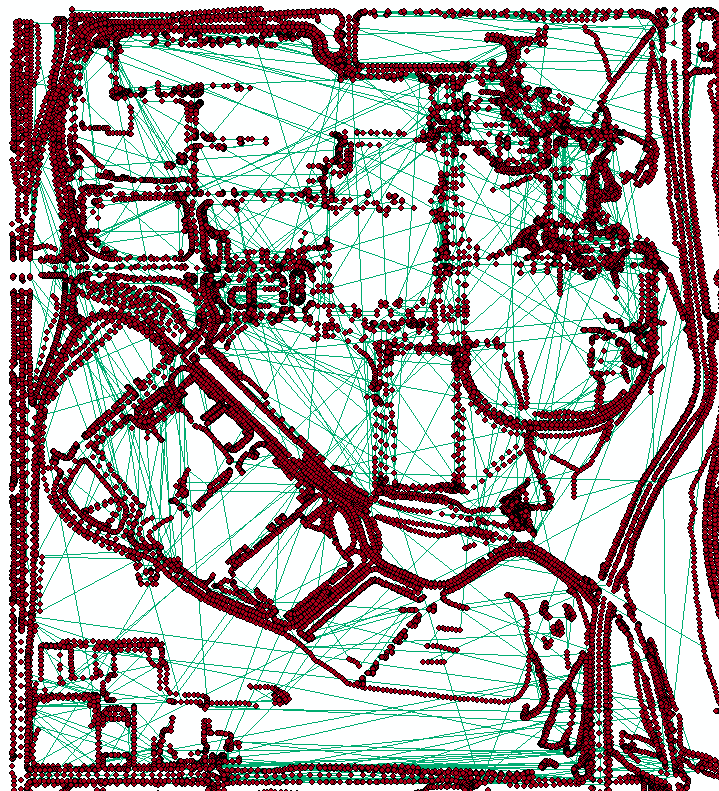
Maybe we could write a python script that will skip a line between vertices when it is larger than a certain length. In that case you could play with that tolerance (max length) and get a result that works for you.
I think the points maybe in the right order, but just lacking an ID for the parts.
- Mark as New
- Bookmark
- Subscribe
- Mute
- Subscribe to RSS Feed
- Permalink
- Report Inappropriate Content
well, the whole point of those data points is to create breaklines for IDW interpolation. What would be the best solution for it? I converted the points to raster to polyline features but the result are not what i was looking for.
- Mark as New
- Bookmark
- Subscribe
- Mute
- Subscribe to RSS Feed
- Permalink
- Report Inappropriate Content
Looking at the screendumps you included, I can imagine that the conversion to raster was not useful.
Is it possible to include (part of) the points? I would like to see if playing with the maximum length of the line could work for your data to get the result you are looking for.
- Mark as New
- Bookmark
- Subscribe
- Mute
- Subscribe to RSS Feed
- Permalink
- Report Inappropriate Content
- Mark as New
- Bookmark
- Subscribe
- Mute
- Subscribe to RSS Feed
- Permalink
- Report Inappropriate Content
Hi Tanya,
Quick question... what is in the forth column (the 0 and 1 values)?