- Home
- :
- All Communities
- :
- Developers
- :
- Python
- :
- Python Questions
- :
- Help using the land_cover_classification_using_une...
- Subscribe to RSS Feed
- Mark Topic as New
- Mark Topic as Read
- Float this Topic for Current User
- Bookmark
- Subscribe
- Mute
- Printer Friendly Page
Help using the land_cover_classification_using_unet jupyter notebook sample
- Mark as New
- Bookmark
- Subscribe
- Mute
- Subscribe to RSS Feed
- Permalink
- Report Inappropriate Content
I downloaded a set of sample Jupyter notebooks from esri at https://developers.arcgis.com/python/sample-notebooks/. One of the notebooks is called land_cover_classification_using_unet, which is supposed to showcase an end-to-end to land cover classification workflow using ArcGIS API for Python. The workflow consists of three major steps: (1) extract training data, (2) train a deep learning image segmentation model, (3) deploy the model for inference and create maps.
I am having trouble running the notebook, and so far have only gotten the first two steps to work, which just create a connection to ArcGIS Online. The third and fourth lines of code are supposed to access a labeled image to train the model, but I get an error that the index value is out of range no matter what index value I use, which basically means the image was not found.
label_layer = gis.content.search("Kent_county_full_label_land_cover")[1] # the index might change
label_layer
---------------------------------------------------------------------------
IndexError Traceback (most recent call last)
<ipython-input-29-a4ac34d0306c> in <module>
----> 1 label_layer = gis.content.search("Kent_county_full_label_land_cover")[1] # the index might change
2 label_layer
IndexError: list index out of rangeI downloaded the original classified image for Kent County in Deleware from the Chesapeake Conservancy land cover project. It looks the same, although I am not completely sure it matches the the extent or classifications of the training image the notebook was supposed to use.
How do I change the code to use the image I downloaded and saved on my computer rather than the image from ArcGIS Online?
I will probably will be asking more questions as I progress though the code, since it seems likely I will hit other problems. I am hoping to first be able to complete the notebook example covering the Deleware region and afterward adapt it to process the NAIP imagery for my jurisdiction.
- Mark as New
- Bookmark
- Subscribe
- Mute
- Subscribe to RSS Feed
- Permalink
- Report Inappropriate Content
Sandeep:
When do you expect to release the notebook you are working on? I have managed to use aspects of the learn.ai module code in the land cover notebook with my local data, so I expect I will be able to make use of the notebook for building footprints. I have several questions about the approach you described. Did you use the Classified_Tiles metadata output from your Export Training Data for Deep Learning tool, and did you have to first convert your building footprint polygons to rasters in order to do that? Or were you able to use a different metadata format output that worked with the original building footprint polygons you had? Also, were you able to use the Classify Pixel modelling with just a single class of buildings, or did you have to have two classes of buildings and non-buildings (everything surrounding your building footprints). Anyway, I would prefer to benefit from your experience on this task, otherwise I will have to do all of the trial and error process on my own, since I am going to come up with a building footprint creation process one way or the other.
- Mark as New
- Bookmark
- Subscribe
- Mute
- Subscribe to RSS Feed
- Permalink
- Report Inappropriate Content
I am really struggling to understand how to use building polygons to create an output that will work with the Export Training Data for Deep Learning tool. I am making an assumption that I need to create classified tiles for use with the Classify Pixels Deep Learning Model, but that assumption could be wrong. I cannot figure out how to make it create classified tiles that make any sense to me. When I run the Polygon to Raster tool with just the building footprint shapes it creates a raster with no background. When I use that raster with the Export Training Data tool it says it worked but no image chips are created.

(Aerial with Polygon to Raster output on top. No training image chips are created when these two raster are used as inputs to the Export Training Data for Deep Learning tool)
I tried running the Segment Mean Shift tool. It creates a raster with an added background surrounding the buildings that seems to work with the Export tool. However, that raster seems to treat the buildings as the no data values and the background as the raster feature. When I run the Export Training Data tool it only creates classified tile chips of the portions of my aerial that contain no buildings. It doesn't seem like that output will do me any good for classifying pixels as buildings.

(Segment Mean Shift Tool output based on Polygon to Raster input)

(Training Image Chips are created by the Export Training Data for Deep Learning Tool when I use the Segment Mean Shift raster as the classified raster, but none of the chips have buildings in them. They only cover portions of the aerial that had no buildings at all within the chip. The Output No Feature Tiles option made no difference)
I have no idea what I should expect from these tools, because the documentation and examples are no help. I have tried at least 50 workflow variants to try to get classified tile chips that show buildings and nothing has worked. Outputs have ranged from the Export tool creating nothing, to creating only chips without buildings, to errors stating that the raster is incompatible with the Export Training Data tool. The Segment Mean Shift tool output shown above is the best result I have had so far.
My trial and error definitely seems to just be error at this point. I am sure Esri support will be useless for this task, since at this point it is clear to me that they know less than I do. Sandeep I really, really need someone to provide more details about your building footprints workflow than what your blog says
- Mark as New
- Bookmark
- Subscribe
- Mute
- Subscribe to RSS Feed
- Permalink
- Report Inappropriate Content
Sandeep:
Your blog makes it seem like it is a simple task to create a classified raster from building footprint polygons that the Export Training Data tool will accept.
Extracting building footprints
We used the existing building footprints as training data to train another deep learning model for extracting building footprints. This time, the model that we had to train was a pixel classification model, wherein each pixel belonging to a building needed to be labelled as such.
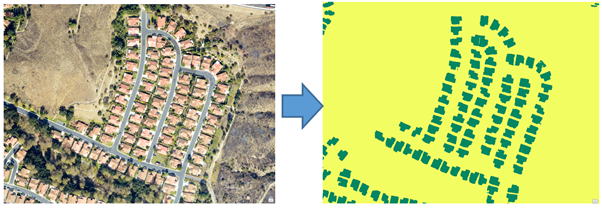
Pixel classification for extracting buildings
Exporting training data
ArcGIS Pro has support for exporting training samples in the Classified Tiles format for training such models. All we had to do was convert the existing building footprint layer to a classified raster and feed it into the tool.
So it is clear that I need to create a classified raster and use the Classified Tiles output from the Export Training Data tool to Extract Building Footprints. Your blog makes it sound like you and your team think it should be obvious to everyone what steps they need to follow to create a classified raster from a building footprint layer, but I assure you that it is not. There is nothing obvious about it and I have wasted days searching the ArcGIS Pro and ArcMap help documents for anything that creates an identical output that works with the Export Training Data tool. All of my outputs that resemble yours are rejected by the tool as not being Thematic. Is there any user out there who has a clue what actually needs to be done to complete this step?
- Mark as New
- Bookmark
- Subscribe
- Mute
- Subscribe to RSS Feed
- Permalink
- Report Inappropriate Content
Hi sorry I was traveling so could not reply, you need to export the raster to an 8-bit unsigned raster. Also, make sure that the raster is thematic, for that you need to go to the catalog and then properties of raster and change the source type to thematic. Also one more thing there should be no NODATA pixels convert all of them to 0 Value, otherwise you will get an error.
I am trying to release that sample notebook, it contains end to end documentation for this exercise. It is still work in the progress, it is not complete and the link is arcgis-python-api/Extracting Building Footprints From Drone Data.ipynb at f1183261b6cea0a3d98bbe462c... .
- Mark as New
- Bookmark
- Subscribe
- Mute
- Subscribe to RSS Feed
- Permalink
- Report Inappropriate Content
Sandeep:
I tried to follow your instructions. I am using ArcGIS PRo 2.4.1. First I used the Identity tool to create a background polygon surrounding my building footprint polygons so that I could classify the entire feature extent. I assigned a classValue of 1 to the building footprint polygons and a classValue of 2 to the background polygon. I used the Polygon to Raster tool to output a raster of the buildings and background. I changed the raster format from Generic to Thematic in the output and the NODATA value from 3 to 0, but noticed the output was a 2-bit pixel-depth output, not an 8-bit unsigned pixel depth output. So I used the Copy Raster tool to make a copy that was 8-bit unsigned, and verified that the layer format was Thematic and the NODATA value was 0. I verified that both my aerial image and my label raster have identical Extents and Spatial References and that all of the pixels are assigned a value in the label raster.
Here is a picture of how the aerial image and the label image appear in the map Table of Contents legend of ArcGIS Pro 2.4.1:

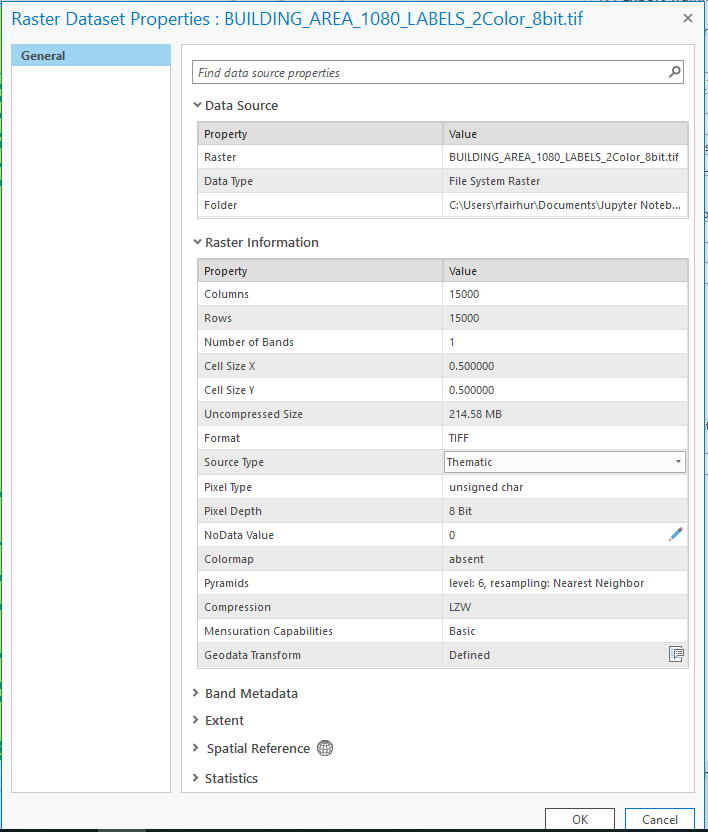
Here is a picture of the label raster and the raster properties of the label raster in Catalog:

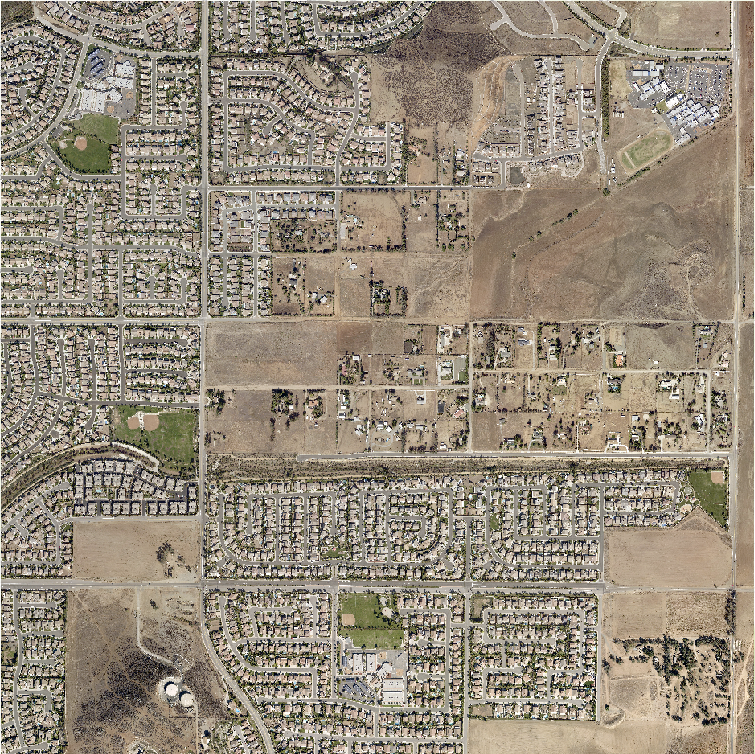
Here is a picture of the aerial and its Catalog properties:

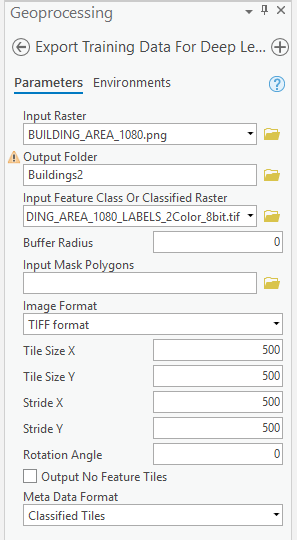
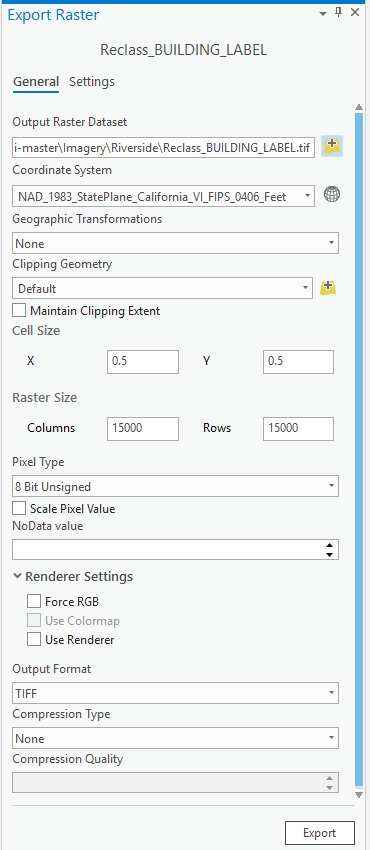
Here are the Export Training Data for Deep Learning tool settings:
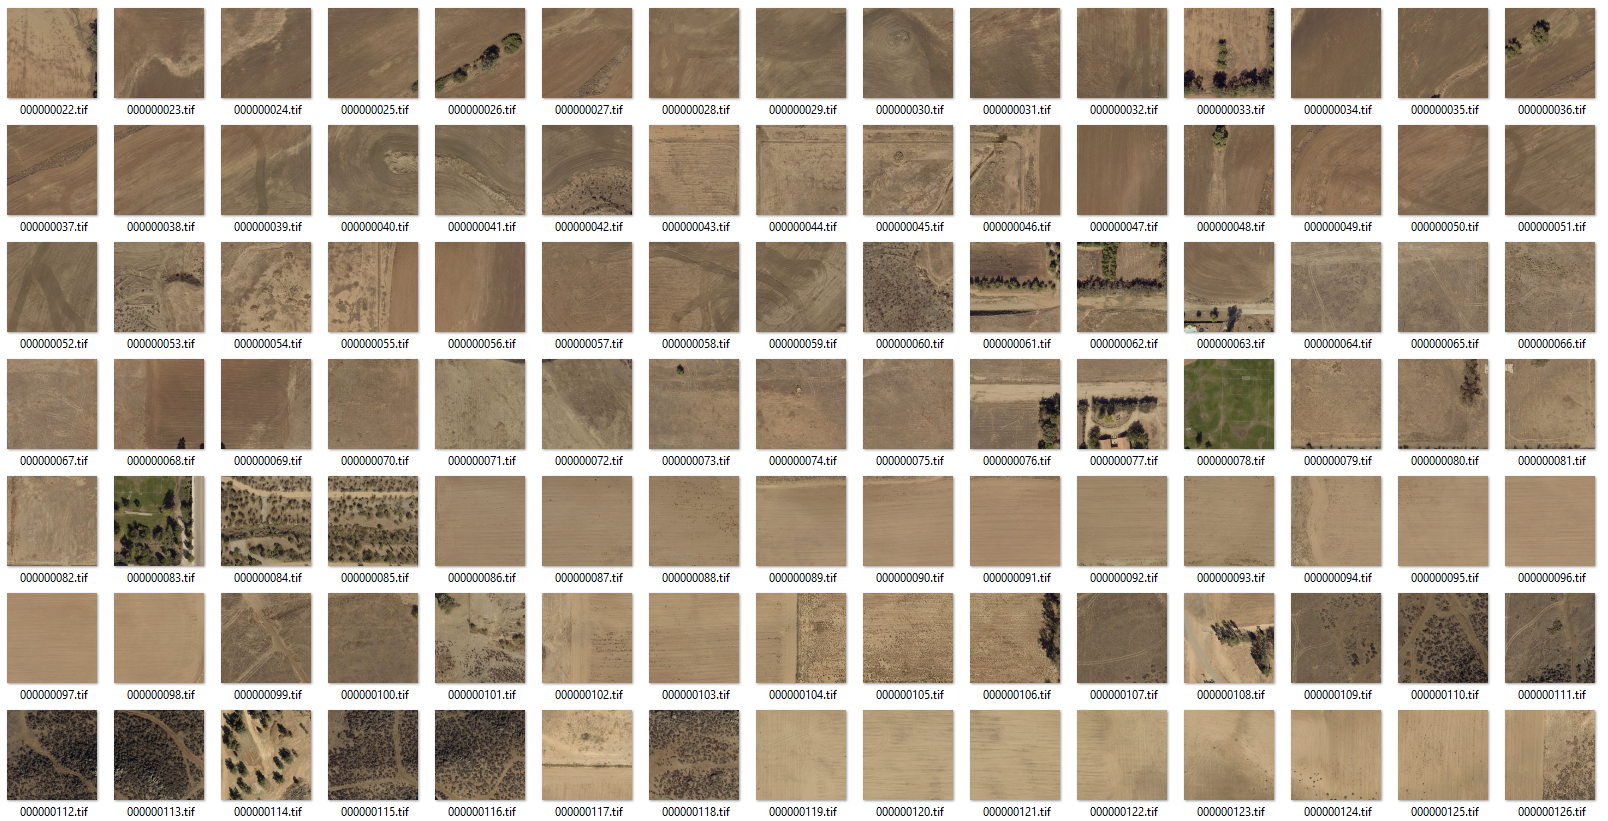
The output of the tool has no image chips with buildings, only image chips without any buildings:

Here are the label tiles:

The output is identical when I check the Output No Feature Tiles option on the Export tool. The output is also identical if I copy the aerial and label rasters into the ArcGIS Pro project File Geodatabase and use those rasters as inputs for the tool.
Why is the Export tool failing to output any image chips with buildings in them? Is this output what I should expect? What do the output tiles look like for the rasters shown in your notebook?
- Mark as New
- Bookmark
- Subscribe
- Mute
- Subscribe to RSS Feed
- Permalink
- Report Inappropriate Content
I tried again to follow your notebook example more exactly. I used ObjectID rather than the classValue field as input to the Polygon To Raster tool:

I then used the Reclassify tool to assign all buildings to 1 and NODATA to 0 (I had deleted the background feature so my ObjectIDs started at 2 rather than 1).
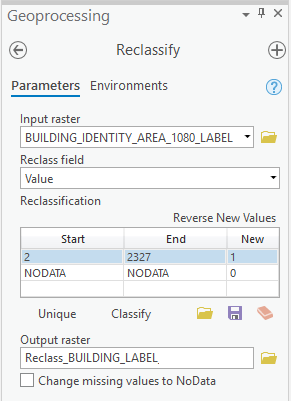
I ran the Export Data tool based on the settings you showed.
I changed the layer to Thematic.

The Raster and its properties look like this:


When I ran the Export Training Data using that label raster I get the same set of tiles that have no buildings in them like I did in the previous post:
If I change the NODATA property of the label raster to 0 in Catalog then the background disappears when I bring the raster into ArcGIS Pro, but when I use that as my input the Export Training Data tool doesn't output any classified tiles at all.
So is this the best output I am going to get with the Export Training Data tool and will these tiles work if I tried to do the other steps in the notebook?
- Mark as New
- Bookmark
- Subscribe
- Mute
- Subscribe to RSS Feed
- Permalink
- Report Inappropriate Content
Based on the classified tile samples shown in the notebook, it seems clear that you are getting tiles that have buildings in them. It seems like the tiles I am getting are not at all what I should expect. In fact it looks like the tiles I am getting are exactly the opposite of the set of tiles that I want. I don't need any of those tiles, but I need all of the tiles that were not generated.
At this point I am thinking of developing my own script to replace the Export Training Data for Deep Learning tool to output the set of tiles that I believe I need. I am thinking that I would need to use the RasterToNumPyArray and NumPyArrayToRaster to be able to achieve an acceptable level of performance, since I know the Clip Raster tool is very slow. Dan, can you comment on the possibility and practicality of using NumPy to take the raster inputs shown above and output a set of 500 x 500 classified tiles that includes buildings rather than excludes them? The tool won't need to handle every possible input and output like the Esri tool. It just needs to work for the raster inputs outlined in my previous post based on Sandeep's procedure (pixel depth, cell size, bands, etc).
- Mark as New
- Bookmark
- Subscribe
- Mute
- Subscribe to RSS Feed
- Permalink
- Report Inappropriate Content
I have started investigating developing my own tool.to replace the Export Training Data for Deep Learning. Example 2 in the NumpyArrayToRaster help is very close to what I want to do and it works well for my classified raster. In fact I can modify the code to only output chips that contain a code of 1 for buildings to get only the set of chips that contain a building, which is the exact opposite output from the one I am getting from the Esri tool and what I really want. The performance is also great and can extract 900 tiles with 500 x 500 pixels from a 15,000 x 15,000 pixel classified raster in under 2 minutes. I am also confident I can create the json, emd, map.txt and stats.txt files that the Esri tool also creates using the numpy array to generate the necessary statistics.
import arcpy
import numpy
filein = r"C:\Users\rfairhur\Documents\Jupyter Notebooks\arcgis-python-api-master\Imagery\Riverside\Reclass_BUILDING_LABEL.tif"
fileout = r"C:\Users\rfairhur\Documents\Jupyter Notebooks\arcgis-python-api-master\Imagery\Riverside\output\labels\BUILDING_AREA_1080.tif"
blocksize = 500
arcpy.env.outputCoordinateSystem = filein
arcpy.env.cellSize = filein
myRaster = arcpy.Raster(filein)
blockno = 0
for x in range(0, myRaster.width, blocksize):
for y in range(0, myRaster.height, blocksize):
# Lower left coordinate of block (in map units)
mx = myRaster.extent.XMin + x * myRaster.meanCellWidth
my = myRaster.extent.YMin + y * myRaster.meanCellHeight
# Upper right coordinate of block (in cells)
lx = min([x + blocksize, myRaster.width])
ly = min([y + blocksize, myRaster.height])
# noting that (x, y) is the lower left coordinate (in cells)
# Extract data block
myData = arcpy.RasterToNumPyArray(myRaster, arcpy.Point(mx, my),
lx-x, ly-y)
if 1 in myData:
# Convert data block back to raster
myRasterBlock = arcpy.NumPyArrayToRaster(myData, arcpy.Point(mx, my),
myRaster.meanCellWidth,
myRaster.meanCellHeight)
# Save on disk as 'filename_#.ext'
filetemp = ('_%i.' % blockno).join(fileout.rsplit('.',1))
myRasterBlock.save(filetemp)
# Maintain a list of saved temporary files
blockno += 1
print("Made " + str(blockno) + " images")
# Release raster objects from memory
del myRasterBlock
del myRaster
print("done")The output of the classified raster chip is shown below overlaying the original aerial using 30% transparency and it looks great (the raster matches the original building footprint polygon outlines):

I would like to use the same code with my aerials, since the performance is great. However, the same code does not work well for processing my aerial image. Even though the code runs and is very fast, the output of the NumpyArrayToRaster looks bad. Even though it is in the correct location and has the correct cell size, it looks nothing like a photo anymore. I made sure the input and output format were both tif, but the output looks bad as shown below where the output chip is overlaying the original aerial at 20% transparency:

The output raster retains just a suggestion of outlines of the features contained in the original aerial that are aligned correctly with the original aerial, but clearly this output is no longer formatted as a aerial. I could use the Clip Raster tool as an alternative to do this step in the process and that would allow me to create a tool that could replace the Esri tool, but I believe the performance of that tool would definitely suffer relative to the performance of the Esri tool.
Dan, do you have any ideas on processes that would quickly clip aerials to generate a set of aerial image chip files and their world files at a minimum? Are there any alternative python modules I should look into, or is there some way to use RasterToNumpyArray and NumpyArrayToRaster to input and output an aerial that ends up with a usable aerial image? I didn't see any Google search results or discussions on GeoNet or stackExchange about using these numpy methods with aerials or satellite images without transforming them. Any ideas on alternate topics I could search? Thanks..
- Mark as New
- Bookmark
- Subscribe
- Mute
- Subscribe to RSS Feed
- Permalink
- Report Inappropriate Content
I went ahead and tried using the Clip tool in my script and the performance actually pretty good. To create a set of 900 image tiles and 900 label tiles with 500 x 500 pixels per tile from two original 15,000 x 15,000 pixel rasters took 5 minutes and 11 seconds. That is a rate of about 5.79 tiles per second. That seems acceptable. If I limit the output to only tiles that contain buildings that can speed up the process even more. For example, for the sample image I have been using I would only need 582 image tiles and 582 label tiles to cover all of the tiles that contain buildings, which is only about 64.7% of all of the possible images. I can generate that set of tiles in 3 minutes and 16 seconds (a rate of about 5.94 tiles per second).
So, here is the code I currently have that will generate the set of image and label tiles that contain buildings from my sample rasters:
from time import strftime
print( "Start script: " + strftime("%Y-%m-%d %H:%M:%S"))
import arcpy
import numpy
filein = r"C:\Users\rfairhur\Documents\Jupyter Notebooks\arcgis-python-api-master\Imagery\Riverside\Reclass_BUILDING_LABEL.tif"
imagein = r"C:\Users\rfairhur\Documents\Jupyter Notebooks\arcgis-python-api-master\Imagery\Riverside\BUILDING_AREA_1080.tif"
fileout = r"C:\Users\rfairhur\Documents\Jupyter Notebooks\arcgis-python-api-master\Imagery\Riverside\output\labels\BUILDING_AREA_1080.tif"
imageout = r"C:\Users\rfairhur\Documents\Jupyter Notebooks\arcgis-python-api-master\Imagery\Riverside\output\images\BUILDING_AREA_1080.tif"
blocksize = 500
arcpy.env.outputCoordinateSystem = filein
arcpy.env.cellSize = filein
myRaster = arcpy.Raster(filein)
blockno = 0
for x in range(0, myRaster.width, blocksize):
for y in range(0, myRaster.height, blocksize):
# Lower left coordinate of block (in map units)
mx = myRaster.extent.XMin + x * myRaster.meanCellWidth
my = myRaster.extent.YMin + y * myRaster.meanCellHeight
# Upper right coordinate of block (in cells)
lx = min([x + blocksize, myRaster.width])
ly = min([y + blocksize, myRaster.height])
# noting that (x, y) is the lower left coordinate (in cells)
# Extract data block
myData = arcpy.RasterToNumPyArray(myRaster, arcpy.Point(mx, my),
lx-x, ly-y)
if 1 in myData:
# Convert data block back to raster
myRasterBlock = arcpy.NumPyArrayToRaster(myData, arcpy.Point(mx, my),
myRaster.meanCellWidth,
myRaster.meanCellHeight)
# Save on disk temporarily as 'filename_#.ext'
filetemp = ('_%i.' % blockno).join(fileout.rsplit('.',1))
imagetemp = ('_%i.' % blockno).join(imageout.rsplit('.',1))
myRasterBlock.save(filetemp)
myextent = '{} {} {} {}'.format(mx, my, mx + blocksize * myRaster.meanCellWidth, my + blocksize * myRaster.meanCellHeight)
arcpy.Clip_management(imagein, myextent, imagetemp)
# Maintain a list of saved temporary files
blockno += 1
print("Made " + str(blockno) + " images")
# Release raster objects from memory
del myRasterBlock
del myRaster
print( "Finished script: " + strftime("%Y-%m-%d %H:%M:%S"))
All that remains is to write code for tracking the statistics I need to generate the json, emd, map.txt and stats.txt files and make revisions that would replace all of the hard-coded values with parameters that could be set at run time.
Below is a comparison of the tiles that the Esri Export Training Data for Deep Learning tool was producing vs. the tiles my tool is producing:

The Esri Export Training Data for Deep Learning Tool output. None of the buildings in the original image are contained in any of the tiles. Also, the colors in the tiles have changed slightly compared to the original image.
.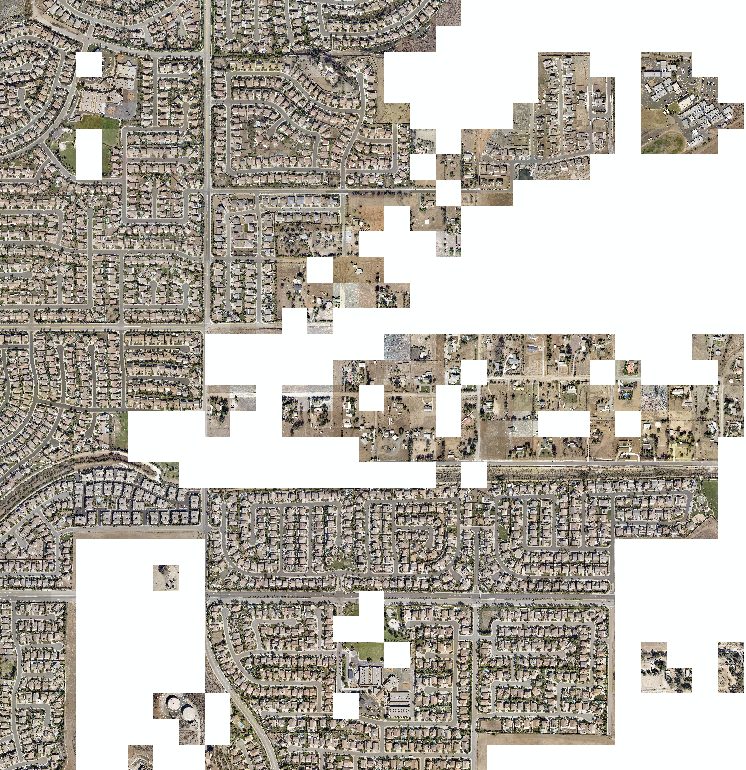
My version of the Export Training Data for Deep Learning Tool output. The image colors match the original and all buildings or portions of buildings in the original image are covered by a tile.
- Mark as New
- Bookmark
- Subscribe
- Mute
- Subscribe to RSS Feed
- Permalink
- Report Inappropriate Content
Hey Richard,
To limit the tiles only for the areas with building, I created a grid of 200m by 200m and used the 'Select by Location' tool to filter out the grids without any buildings. Then there is an option `Input Mask Polygons` where we can use this grid in the `Export Training Data for Deep Learning` tool. Also, the data is exported in 8bit unsigned format, so you may not be able to see anything in those tiles, you can use `data.show_batch()` to visualize your training data once you have got data variable by `data = preparing_data()` in your notebook.
Thanks