- Home
- :
- All Communities
- :
- Developers
- :
- Python
- :
- Python Documents
- :
- ArcGIS Notebooks in ArcGIS Pro (2.6)
- Subscribe to RSS Feed
- Mark as New
- Mark as Read
- Bookmark
- Subscribe
- Printer Friendly Page
ArcGIS Notebooks in ArcGIS Pro (2.6)
ArcGIS Notebooks in ArcGIS Pro (2.6)
ArcGIS Notebooks are based on the open-source Jupyter notebook, which has been included in the ArcGIS Pro Python distribution since ArcGIS Pro 2.1. Since Pro 2.5, notebooks can run directly in ArcGIS Pro allowing a side-by-side view of your map and notebook and for direct interactions with the data on your map. Jupyter notebooks combine cells of live Python code with narrative text and visualizations in a single document. They have become widely adopted by the data science community because they support iteratively and interactively documenting, processing, analyzing, and visualizing data in a notebook format that can be saved, shared, and used to report results. See the ArcGIS Notebooks landing page to learn more about notebooks across Esri products.
With ArcGIS Pro 2.6, there are several updates that improve your experience, including the following:
- Many magic ( % ) and shell ( ! ) commands are now supported.
- Rich representations for arcpy SpatialReference and Result objects.
- Creating a notebook from the Analysis ribbon will now immediately open it.
- The syntax highlighting of notebooks in dark mode has been improved.
To learn more about notebooks in Pro, see the following:
Get Started
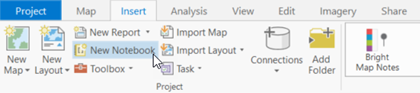
1. To get started with notebooks in Pro, open a new project and from the Insert ribbon click New Notebook. Updated in 2.6, creating a new notebook will immediately open it, allowing you to jump right into entering code.
You can arrange the notebook view so that you can see your map and notebook side-by-side.
Notebook Tutorial
This tutorial explores the 2010 census population data for New England states, and provides an example of how ArcGIS Notebooks and ArcGIS Pro can interact. You may download the sample project package if you'd like to skip this tutorial and just explore the result.
Before getting started, make sure you are signed into ArcGIS Online or your organization's Portal.
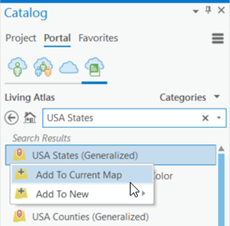
2. Navigate to the Portal tab on the Catalog pane, click the Living Atlas tab and type USA States into the search box and hit the enter key. Right-click the item named USA States (Generalized) and select Add To Current Map.
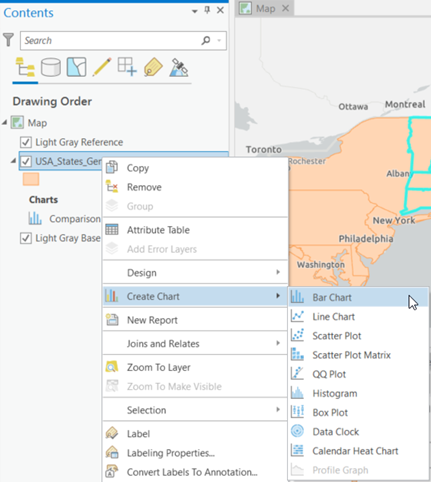
3. Before we work on our notebook, we will visualize the population of US states with a chart to get an understanding of our data. Right-click the USA_States_Generalized layer in the Contents pane and select Create Chart > Bar Chart.
4. In the Chart Properties pane, under Category or Date, choose the Name field from the drop-down list. Under Numeric field(s) check POP2010. Leave all remaining options as default and click Apply.
5. Arrange the chart, map, and notebook views so they are all visible.
6. From the Map ribbon click the Select button and select the states Maine, Massachusetts, New Hampshire, Rhode Island, and Vermont.
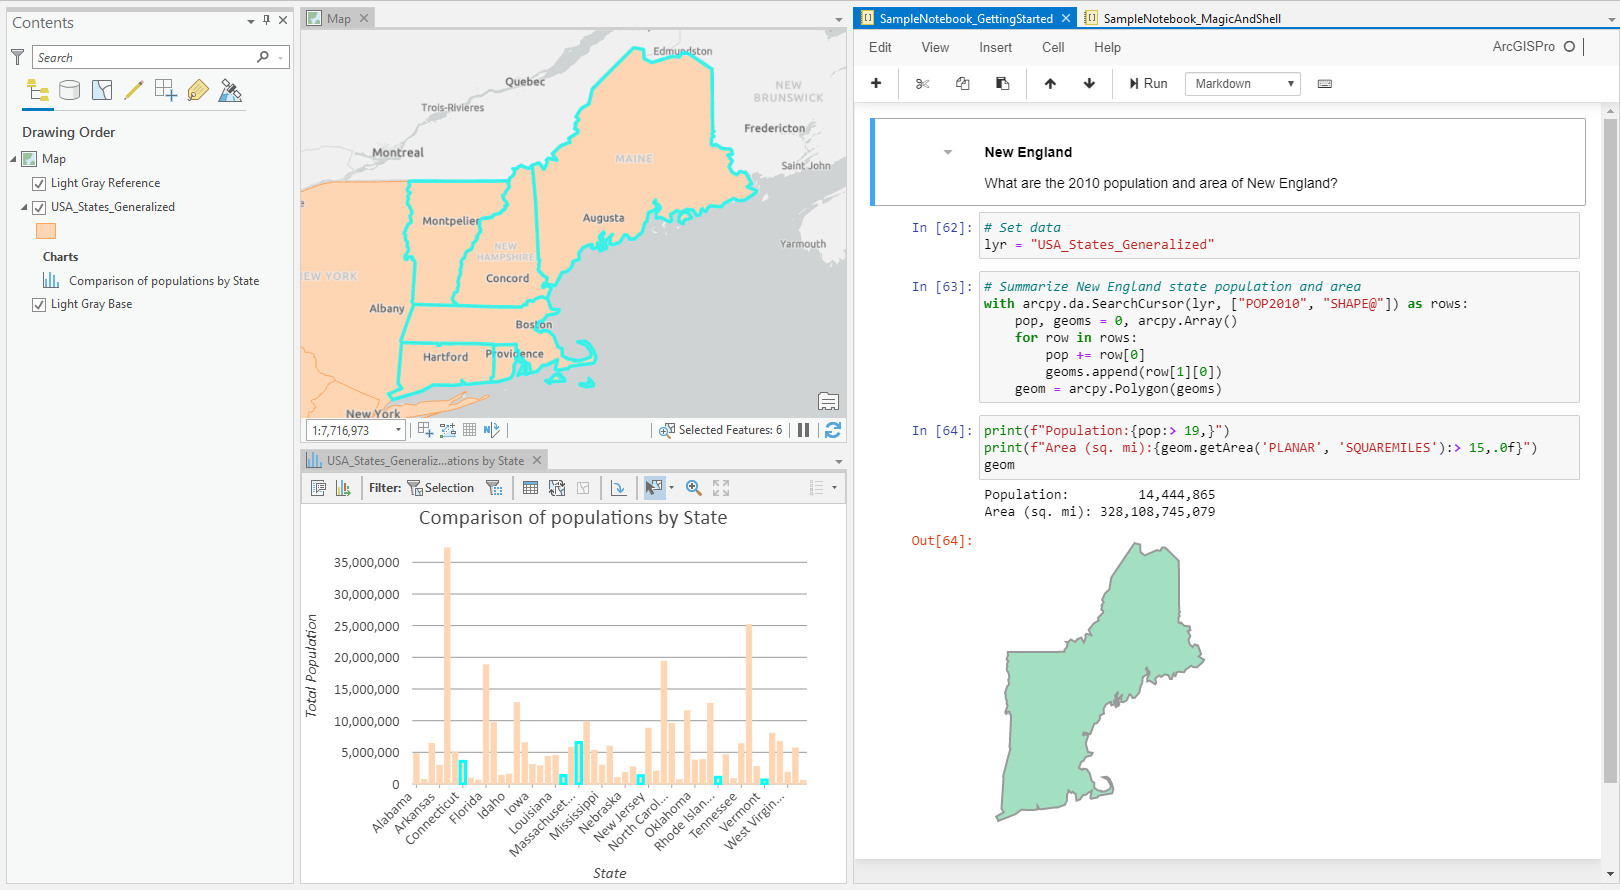
Notice that selecting features in the map also highlights the corresponding data in the Chart. We can see the relative size of the populations of these individual states compared to other states. We would like to report the total population and area of these five states. To do that, we will use the notebook.
7. In the Notebook view created earlier, enter the following text into the first cell.
### New England Population and Area What are the 2010 population and area of New England?
8. Select Markdown from the drop-down list above the cell, and then press Shift+Enter to run the current cell and simultaneously create a new cell below.
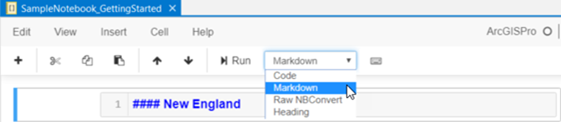
The text becomes a header and description for your notebook. Markdown allows you to narrate a notebook and break it into sections.
Geoprocessing operations performed in the notebook will honor selections made in Pro. Complete steps 9-11 with the five states (Maine, Massachusetts, New Hampshire, Rhode Island, and Vermont) selected.
9. Enter the following code into the next cell of your notebook and press Shift+Enter to run the cell.
# Set data lyr = "USA_States_Generalized"
10. In the next cell, enter the following code and from the Cell menu of the notebook view select Run Cells And Select Below.
# Summarize New England state population and area
with arcpy.da.SearchCursor(lyr, ["POP2010", "SHAPE@"]) as rows:
pop, geoms = 0, arcpy.Array()
for row in rows:
pop += row[0]
geoms.append(row[1][0])
geom = arcpy.Polygon(geoms)
The code iterates through the selected population and geometry records of the USA_States_Generalized dataset. It totals the population and stores the result in the pop variable. While iterating, it also combines the geometries of the individual states into a single arcpy.Polygon object stored in the geom variable.
11. In the next cell, enter the following code and press Control+Enter, this will run the cell without creating a new cell below.
print(f"Population:{pop:> 19,}")
print(f"Area (sq. mi):{geom.getArea('PLANAR', 'SQUAREMILES'):> 15,.0f}")
geom
The code prints out the population and area of the five selected states. Thanks to rich representations in notebooks, the geometry of the five states is also displayed directly in the notebook. The result is a document that reports the population and area of New England states, and shows a visual representation of the five state's combined shape.
With the tutorial, you have seen how you can use ArcGIS Notebooks interactively in ArcGIS Pro by bringing 2010 State Census data into your map, exploring population attributes with a chart, and then referring to the data by layer name in your notebook and operating on a selected subset of the data to obtain a summary of the total population and area of New England states.
Questions and Answers
Q: How does the experience of running an ArcGIS Notebook in ArcGIS Pro compare with running a Jupyter Notebook outside of Pro?
A: With notebooks in ArcGIS Pro, you can open a map view and a notebook view side-by-side, allowing you to visualize and directly interact with the data.
- Layers and other contents of your map can be accessed in your notebook by name. You can access data that is not currently in your table of contents using the full path to thedata. Note that dragging and dropping an item from the contents pane into the notebook is currently not supported.
- If you have selected data in the map view, geoprocessing tools running from the notebook honor the selections.
- Global geoprocessing environment settings are respected and can be overridden by environment settings set from the notebook.
- The output of geoprocessing tools is added to the active map by default.
- When a notebook view is active, the Notebook ribbon will appear. From here, you can create a new notebook, save the current notebook, or interrupt the kernel.
- The result of running a geoprocessing tool from the notebook will be logged in the geoprocessing history.
- Geoprocessing workflows can occur during an ongoing editing session. If a geoprocessing tool modifies a feature being edited in an edit session (it does not save the result of geoprocessing as another feature class), you can save or discard the modifications from the Edit ribbon.
Q: Can I use the standard Jupyter Notebook keyboard shortcuts?
A: Keyboard shortcuts work just like they do in Jupyter Notebook.
Q: Can I use magic ( % ) and shell ( ! ) commands in my notebook?
A: Yes! In ArcGIS Pro 2.6, many magic and shell commands are supported. Magic and shell commands are a convenience that enhance data analysis and offer a bridge for executing shell commands without leaving your notebook. The following are examples of magic and shell commands you can use:
# Get info on magic functions
%magic
# How fast can we generate a random polygon geometry object?
import random
def generate_geometry(n):
""" Generate random geometry with n vertices """
vertices = [[random.randint(-190, 190), random.randint(-190, 190)] for _ in range(n)]
feature = arcpy.Polyline(
arcpy.Array([arcpy.Point(*coords) for coords in vertices]))
return feature
# Time the generate_geometry function
%timeit generate_geometry(10)For more information regarding magic and shell commands, see magic commands and shell commands.
Q: Why are figures from matplotlib not showing up in the cell output of my notebook?
A: As of ArcGIS Pro 2.6, inline visualizations from matplotlib are supported. You will need to use the show() method to view these. For example:
%matplotlib inline
# Imports
import matplotlib.pyplot as plt
import pandas as pd
import arcgis
# Create spatially enabled data frame (SEDF)
sedf = pd.DataFrame.spatial.from_featureclass("USA_States_Generalized")
# Create plot
plt.bar(sedf.STATE_NAME, sedf.POP2010)
# Update plot elements
plt.suptitle("Population of New England States", fontsize=16)
plt.ylabel("Population (in millions)")
plt.xticks(rotation=45)
# Draw the plot
plt.show()
Q: Can I create ArcGIS Pro Charts and show them in my notebook?
A: Yes, as of ArcGIS Pro 2.6, charts can be displayed in notebooks. To add a chart to a layer or notebook, first create a Chart object, then configure its properties, and finally associate the Chart with an arcpy.mp.Layer from an arcpy.mp.ArcGISProject. For example, if following along with the extended tutorial from above, the following code adds a chart to the map layer and prints the result in the notebook cell output area:
# Get layer object from current project
aprx = arcpy.mp.ArcGISProject('Current')
us_states = aprx.listMaps()[0].listLayers("USA_States_Generalized")[0]
# Create a Chart object
chart = arcpy.Chart("Chart")
chart.type = "bar"
chart.title = "Comparison of populations by State"
chart.xAxis.field = "STATE_NAME"
chart.xAxis.title = "State"
chart.yAxis.field = "POP2010"
chart.yAxis.title = "Total Population"
# Add the chart to the layer
chart.addToLayer(us_states)
# Show the chart in the cell output
chart.dataSource = us_states
chart
Q: Where can I find the option for restarting the kernel?
A: You currently cannot restart the kernel unless you close and reopen ArcGIS Pro. You can, however, interrupt the kernel using the Interrupt Kernel button on the Notebook ribbon.
Q: Can I use R or C# in my notebook instead of Python?
A: You can only open a Python kernel in notebooks running in ArcGIS Pro, other languages are not supported.
Q: I'd like to export my notebook (.ipynb) to a Python script (.py), is that possible?
A: Yes, you can use the jupyter command nbconvert from the command prompt, or you can run the command directly from your notebook by preceding the command with an exclamation mark ( ! 😞
jupyter nbconvert --to script "Path\To\Your_Notebook.ipynb"
The resulting Your_Notebook.py file will be in the same directory as Your_Notebook.ipynb.
Q: Can I open a Jupyter notebook in ArcGIS Pro that I have previously created outside of Pro?
A: Yes, ArcGIS Notebooks are simply Jupyter notebooks and any notebook can be run in ArcGIS Pro. However, it is your responsibility to ensure any libraries used in these other environments are available in the active environment of ArcGIS Pro.
Q: Can I use my ArcGIS Notebook created in Pro across other platforms?
A: ArcGIS Notebooks are simply Jupyter Notebooks (.ipynb) and can be run in any Jupyter environment or as hosted ArcGIS Notebooks in ArcGIS Enterprise or ArcGIS Online. However, it is your responsibility to make sure that any libraries used in the notebook are available in these other environments.
- Using Notebooks hosted on Enterprise Portal in ArcGIS Pro: There are several options for moving a hosted notebook to your local machine.
- Make sure you are signed into a portal. From the Catalog pane in ArcGIS Pro, go to Portal > My Content, right-click a notebook item, and select Download.

- Signed into Portal on the web browser. From the Notebook Editor in Portal, on notebook menu ribbon, click File> Download as > notebook (.ipynb).

- Signed into Portal on the web browser. From the notebook's Item Details page (accessible from the Content tab by clicking on a notebook item), click Download to download the notebook in .ipynb format.

- Using Notebooks created in Pro on my Enterprise Portal:
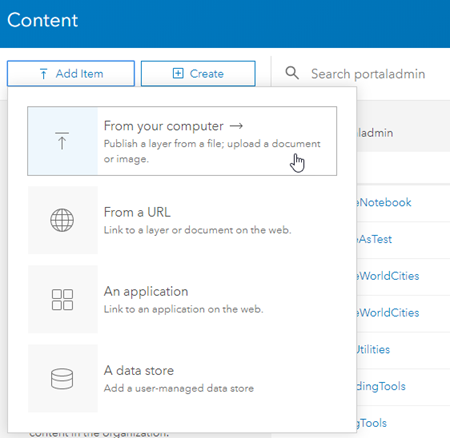
- You can upload any notebook file (.ipynb) to your portal. Sign into your organization's Portal from the browser, go to the Content tab of the contents page, click Add Item > From your computer and choose From my computer. From the Add an item from my computer dialog, click Choose File and browse to a notebook file on your computer, provide a title and tags, and then click Add Item.
Q: From an ArcGIS Notebook hosted on portal I can authenticate my credentials using arcgis.GIS("home") instead of entering my username and password, why doesn't this work from my notebook in Pro?
A: In ArcGIS Pro 2.5, you had to use arcgis.GIS("pro") instead of arcgis.GIS("home"). At ArcGIS Pro 2.6, as long as you are connected to your ArcGIS Online organization or Enterprise Deployment in your current ArcGIS Pro session, you can use arcgis.GIS("home"). Learn more about working with different authentication schemes different authentication schemes.
Q: I have seen collapsible headings in ArcGIS Notebooks on Notebook Server. Can I use collapsible headings with notebooks in Pro?
A: Yes, collapsible headings are an extension that can be installed separately. Collapsible headings enable markdown cells with headings (any markdown cell that begins with 1 to 6 "#" characters) to be collapsed. To install and enable the extension for your ArcGIS Pro Python environment, follow these general steps:
1. In ArcGIS Pro, click the Project tab, and then Python to open the Python Package Manager.
2. Under Project Environment, check that the active environment is not the default environment, arcgispro-py3. If it is, clone the environment before continuing. Learn more about the Python Package Manager.
3. Once you have confirmed that you are using a cloned Python environment, close ArcGIS Pro and open the command prompt from Windows Start > ArcGIS > Python Command Prompt, then run the following commands one at a time:
pip install jupyter_contrib_nbextensions
jupyter contrib nbextension install –user
jupyter nbextension enable collapsible_headings/main
4. Re-open ArcGIS Pro, and collapsible headings will now work. Out-of-the box collapsible headings are planned for a future release.
Q: When opening a notebook in ArcGIS Pro, why did I receive a "Failed to load notebook" error?
A: If you have made any changes to the jupyter configuration file jupyter_notebook_config.py, make sure you haven't modified the c.NotebookApp.ip or c.NotebookApp.port configuration options, as modifying these will prevent ArcGIS Pro from launching the notebook.
Q: Why can't I install geopandas into the ArcGIS Pro Python environment?
A: This is a bug that will be resolved in a future release of ArcGIS Pro. In the meantime, please follow these to work around the issue:
1. In ArcGIS Pro, click the Project tab, and then Python to open the Python Package Manager.
2. Under Project Environment, check that the active environment is not the default environment, arcgispro-py3. If it is, clone the environment before continuing. Learn more about the Python Package Manager.
3. Once you have confirmed that you are using a cloned Python environment, close ArcGIS Pro and open the command prompt from Windows Start > ArcGIS > Python Command Prompt, then run the following command:
conda install geopandas libtiff=4.0.10
That's it! You should now be able to import geopandas from a Python interpreter in your ArcGIS Pro environment.
Q:Why can't I open a notebook in Pro from a UNC path?
A: Opening notebooks in Pro from a UNC path is currently not supported, we recommend mapping the UNC path to a drive or alternatively creating a symbolic link.
Q: Why aren't arcgis API map widgets displaying in my notebook?
A: The map widget loads the ArcGIS API for JavaScript from js.arcgis.com, which has recently enforced HSTS standards (HTTPS only). For a time, the Python API redirected to an HTTP URL that no longer functions after the update. Installing the arcgis API version 1.8.4 and greater will resolve this issue. From the Python command prompt, run:
conda install arcgis
Map widgets should now work after restarting Pro.
The installed version of the arcgis API can found with the following command:
conda list arcgis
If your map widgets still won't show, read on:
Prior to updating the arcgis API, we suggested a couple of workarounds to make sure widgets draw. If you used one of the previous workarounds, make sure to undo these.
- If you were using the arcgis API at version 1.8.1 or greater, and set the environment variable JSAPI_CDN to https://js.arcgis.com/4.15/, make sure you remove this variable.
- If you set the environment variable at the head of your notebook with the below code, make sure to delete it.
import os
os.environ['JSAPI_CDN'] = 'https://js.arcgis.com/4.15/'
- If you added a JSAPI_CDN variable to your system or user Environment Variables using windows System Properties, delete the variable.
- If you were using the arcgis API at version 1.5.0 through 1.8.0, and set the MapView js_cdn property to https://js.arcgis.com/4.15/ with the code below, make sure to delete it.
from arcgis.widgets import MapView
MapView.set_js_cdn('https://js.arcgis.com/4.15/')
Note that your link to the JS API may be different depending on the versions of the arcgis API you installed. On an older version of the arcgis API, the JS API CDN had to be set to target the correct version using the table below as a reference:
| Python API Version | JS API Version |
| 1.8.3 | 4.15 |
| 1.8.2 | 4.15 |
| 1.8.1 | 4.15 |
| 1.8.0 | 4.14 |
| 1.7.1 | 4.13 |
| 1.7.0 | 4.13 |
| 1.6.2 | 4.11 |
| 1.6.1 | 4.11 |
| 1.6.0 | 4.10 |
| 1.5.2 | 4.9 |
| 1.5.1 | 4.8 |
| 1.5.0 | 4.8 |
Ex: My version of the arcgis API is 1.7.0, so the JS API url should be https://js.arcgis.com/4.13/.
Q: I keep clobbering variables when I have multiple notebooks open in Pro. Why are variables names being shared across multiple notebooks?
A: ArcGIS Pro runs a single Python instance. This execution context is shared by each notebook opened in a single instance of ArcGIS Pro. Depending on the contents of concurrently open notebooks, this could potentially result in variable name collisions. To avoid potential issues you may consider:
- Opening one notebook at a time
- Using unique variable names across all concurrently running notebooks
- Running the %reset -f magic command as needed to delete all the variables in the namespace