- Home
- :
- All Communities
- :
- Developers
- :
- Python
- :
- Python Blog
- :
- Japanese visual multiplication with lines using ar...
Japanese visual multiplication with lines using arcpy
- Subscribe to RSS Feed
- Mark as New
- Mark as Read
- Bookmark
- Subscribe
- Printer Friendly Page
- Report Inappropriate Content
Today I stumbled upon a tweet showing how children in Japan are using line intersections to calculate the multiplication of two numbers. I was amazed by the beauty of the method which can be extended to larger numbers too. Just take a look at the example below:

Source: http://www.pinpopular.com/japanese-multiplication-trick-pinterest-education/
It is basically counting intersections of lines. Wait ... intersections of lines ... sounds to me that arcpy could do that too. So, why not write some arcpy / python code to multiply 2 numbers?
I know, what you're thinking ... why? Because it's fun and completely useless!
So this is what I came up with:
# Japanese visual multiplication with arcpy
import arcpy
import os

ws = r"C:\Forum\JapaneseMultiply\fgdb\test.gdb"
arcpy.env.workspace = ws
arcpy.env.overwriteOutput = True

sr = arcpy.SpatialReference(3857)
arcpy.env.outputCoordinateSystem = sr

# values to multiply:
value1 = 47 # (1 -99)
value2 = 63 # (1 -99)

fc_points = "points"
fc_lines_h = "lines_h"
fc_lines_v = "lines_v"
fc_polygones = "polygons"
fc_result = "result"
size = 10
fld_factor = "factor"

val_h1 = value1 / 10
val_h2 = value1 % 10
val_v1 = value2 / 10
val_v2 = value2 % 10

# create horizontal lines
arcpy.CreateFeatureclass_management(ws, fc_lines_h, "POLYLINE", "#", "DISABLED", "DISABLED", sr)
with arcpy.da.InsertCursor(fc_lines_h, ("SHAPE@")) as rows:
    for y in range(1, val_h1 + 1):
        x1 = -1 * size
        x2 = size
        array = arcpy.Array([arcpy.Point(x1, y),
                     arcpy.Point(x2, y)])
        polyline = arcpy.Polyline(array)
        rows.insertRow([polyline])

    for y in range(1, val_h2 + 1):
        x1 = -1 * size
        x2 = size
        array = arcpy.Array([arcpy.Point(x1, -1 * y),
                     arcpy.Point(x2, -1 * y)])
        polyline = arcpy.Polyline(array)
        rows.insertRow([polyline])


# create vertical lines
arcpy.CreateFeatureclass_management(ws, fc_lines_v, "POLYLINE", "#", "DISABLED", "DISABLED", sr)
with arcpy.da.InsertCursor(fc_lines_v, ("SHAPE@")) as rows:
    for x in range(1, val_v1 + 1):
        y1 = -1 * size
        y2 = size
        array = arcpy.Array([arcpy.Point(-1 * x, y1),
                     arcpy.Point(-1 * x, y2)])
        polyline = arcpy.Polyline(array)
        rows.insertRow([polyline])

    for x in range(1, val_v2 + 1):
        y1 = -1 * size
        y2 = size
        array = arcpy.Array([arcpy.Point(x, y1),
                     arcpy.Point(x, y2)])
        polyline = arcpy.Polyline(array)
        rows.insertRow([polyline])


# Create polygon cuadrants
arcpy.CreateFeatureclass_management(ws, fc_polygones, "POLYGON", "#", "DISABLED", "DISABLED", sr)
arcpy.AddField_management(fc_polygones, fld_factor, "DOUBLE")
with arcpy.da.InsertCursor(fc_polygones, ("SHAPE@", fld_factor)) as rows:
    # left top factor 100
    factor = 100
    array = arcpy.Array([arcpy.Point(-1 * size, 0),
                         arcpy.Point(-1 * size, size),
                         arcpy.Point(0, size),
                         arcpy.Point(0, 0),
                         arcpy.Point(-1 * size, 0)])
    polygon = arcpy.Polygon(array)
    rows.insertRow([polygon, factor])

    # right top factor 10
    factor = 10
    array = arcpy.Array([arcpy.Point(0, 0),
                         arcpy.Point(0, size),
                         arcpy.Point(size, size),
                         arcpy.Point(size, 0),
                         arcpy.Point(0, 0)])
    polygon = arcpy.Polygon(array)
    rows.insertRow([polygon, factor])

    # left bottom factor 10
    factor = 10
    array = arcpy.Array([arcpy.Point(-1 * size, -1 * size),
                         arcpy.Point(-1 * size, 0),
                         arcpy.Point(0, 0),
                         arcpy.Point(0, -1 * size),
                         arcpy.Point(-1 * size, -1 * size)])
    polygon = arcpy.Polygon(array)
    rows.insertRow([polygon, factor])

    # right bottom factor 1
    factor = 1
    array = arcpy.Array([arcpy.Point(0, 0),
                         arcpy.Point(0, -1 * size),
                         arcpy.Point(size, -1 * size),
                         arcpy.Point(size, 0),
                         arcpy.Point(0, 0)])
    polygon = arcpy.Polygon(array)
    rows.insertRow([polygon, factor])


# start analysis: intersect horizontal and vertical lines
arcpy.Intersect_analysis([fc_lines_h, fc_lines_v], fc_points, "ALL", "", "POINT")

# Next intersect the polygon with the points (intersection of lines)
arcpy.Intersect_analysis([fc_polygones, fc_points], fc_result)

# now use Search cursor to get result
res = 0
with arcpy.da.SearchCursor(fc_result, (fld_factor)) as rows:
    for row in rows:
        factor = row[0]
        res += factor


print "{0} * {1} = {2}".format(value1, value2, res)
print "verify: {0} * {1} = {2}".format(value1, value2, value1 * value2)
In the example above the following result is printed:
47 * 63 = 2961.0
verify: 47 * 63 = 2961
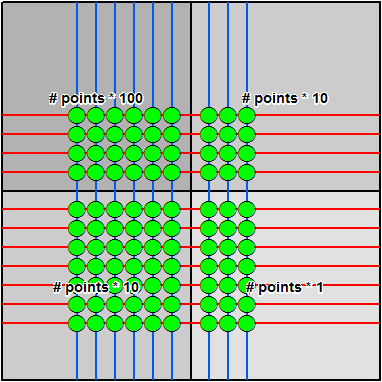
Displaying the featureclasses gives the following result:
I hope my next blog post will be of more use. 
Xander
You must be a registered user to add a comment. If you've already registered, sign in. Otherwise, register and sign in.