- Home
- :
- All Communities
- :
- Industries
- :
- Public Safety
- :
- Public Safety Questions
- :
- Is it possible to divide a raster into equal parts...
- Subscribe to RSS Feed
- Mark Topic as New
- Mark Topic as Read
- Float this Topic for Current User
- Bookmark
- Subscribe
- Mute
- Printer Friendly Page
Is it possible to divide a raster into equal parts based off the sum of its cells?
- Mark as New
- Bookmark
- Subscribe
- Mute
- Subscribe to RSS Feed
- Permalink
- Report Inappropriate Content
I'm working on a project to redraw district boundaries for our police department to help spread the work load more evenly among officers.
I created a raster layer showing overall time spent on calls across the city and was wondering if there is a way to divide the layer into equal value amounts rather than equal areas.
We have 4 districts and I'd like to divide my raster so that the amount of time (sum of the cells) is equally split. The boundaries have been arbitrarily drawn throughout the years as new areas where annexed so completely redrawing the district lines is not a problem.
Any ideas on how to approach this or am I hoping for too much?
- Mark as New
- Bookmark
- Subscribe
- Mute
- Subscribe to RSS Feed
- Permalink
- Report Inappropriate Content
Totally untried... but what about Cost Allocation which would be different than
Euclidean Allocation .... suggesting that a cost surface might apportion the space differently than purely distance based.
- Mark as New
- Bookmark
- Subscribe
- Mute
- Subscribe to RSS Feed
- Permalink
- Report Inappropriate Content
Interesting thought to use Cost Distance for this purpose. Will probably not result in areas with an equal sum of the value, but might come close and requires the user to define the starting points.
I have done something (remotely) related to this (vector based) where the objective was to select as many parcels as possible based on a minimum distance between them. A similar approach could be used. Would be interesting to take a look. Brandon Jumonville , would you be able to share (a part of) the time raster or other input data to have a look at what is possible?
- Mark as New
- Bookmark
- Subscribe
- Mute
- Subscribe to RSS Feed
- Permalink
- Report Inappropriate Content
- Mark as New
- Bookmark
- Subscribe
- Mute
- Subscribe to RSS Feed
- Permalink
- Report Inappropriate Content
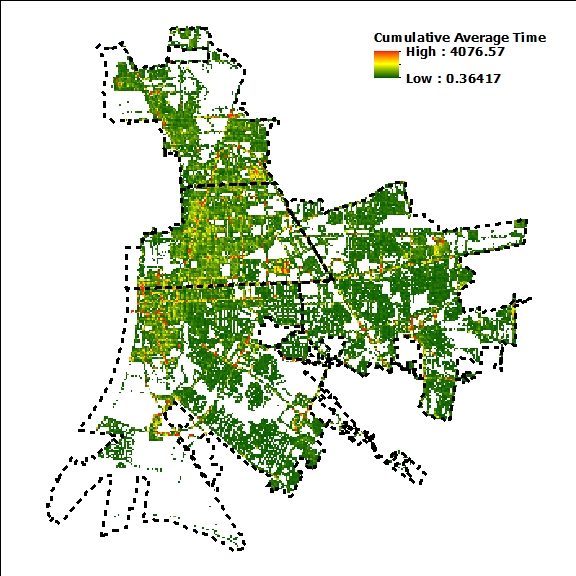
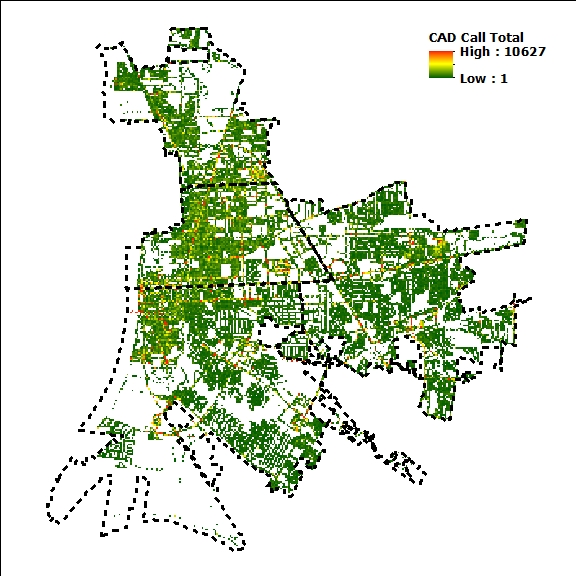
So this is where I'm at right now. I took the total calls for a 5.75 year period, determined the average time officers spent per incident type, applied that value to the calls and created a 250'X250' raster from the points (1.25 million if you were wondering). So now I have these time values ranging from .36 to 4076.57 hours per cell but they aren't evenly divided between the current district boundaries... that's where I'd like to redraw the boundaries to evenly spread, at least reasonably close, the time spent between four districts.
- Mark as New
- Bookmark
- Subscribe
- Mute
- Subscribe to RSS Feed
- Permalink
- Report Inappropriate Content
The image provide some more information on what you have, but is it possible to share some of the actual data?
- Mark as New
- Bookmark
- Subscribe
- Mute
- Subscribe to RSS Feed
- Permalink
- Report Inappropriate Content
Here's a link to a tile service on our portal
- Mark as New
- Bookmark
- Subscribe
- Mute
- Subscribe to RSS Feed
- Permalink
- Report Inappropriate Content
Hi Brandon Jumonville ,
This is what I came up with...
For starters, having the REST url did not give me access to the actual data, so you might have to rethink part of what I am going to share.
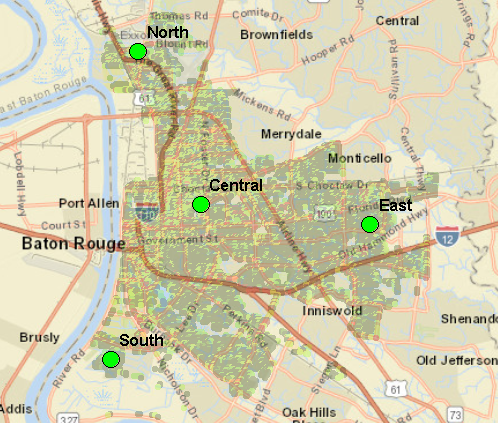
So I captures a screenshot, georeferenced with using the base map at Baton Rouge 
Then I have to do some post processing and resampled values ranging from 1 to 10 corresponding (not the range of values self) to your original screenshots.
What I did was converting the raster to points, so each point will have the "time" value:
Then I picked 4 locations to start the zones:
The next step was to use Generate Near Table—Help | ArcGIS Desktop to generate a table that has the distance between each zone point and all the raster point (time values).
I used this in the following script as input:
def main():
import arcpy
# points (converted from raster, each cell is a point)
fc_pnt = r'C:\GeoNet\ZonasTimeCalls\data.gdb\points'
fld_oid = 'OID@'
fld_value = "grid_code"
fld_zone = "Zone"
dct_pnts = {r[0]: r[1] for r in arcpy.da.SearchCursor(fc_pnt, (fld_oid, fld_value))}
max_val = max(dct_pnts.values())
print max_val
zone_score = sum(dct_pnts.values()) / 4 + max_val
print zone_score
# near table (created with generate near table, using 4 points and the raster points)
tbl = r'C:\GeoNet\ZonasTimeCalls\data.gdb\NearTable'
fld_id_zone = "IN_FID"
fld_id_pnt = "NEAR_FID"
fld_dist = "NEAR_DIST"
# create a list of zones
zones = list(set([r[0] for r in arcpy.da.SearchCursor(tbl, (fld_id_zone))]))
print zones
# create list of id pnt for each zone, store in nested list, sorted by near dist
dct_zone_value = {}
for zone in zones:
flds = (fld_id_pnt, fld_dist)
where = "{0} = {1}".format(fld_id_zone, zone)
lst = [[r[0], r[1]] for r in arcpy.da.SearchCursor(in_table=tbl,
field_names=flds,
where_clause=where,
sql_clause=(None, 'ORDER BY {0} ASC'.format(fld_dist)))]
dct_zone_value[zone] = lst
dct_scores = {zone: 0 for zone in zones}
## for zone, lst in dct_zone_value.items():
## print zone, len(lst)
dct_pnt_zone = {}
print dct_scores
items = len(dct_zone_value[zones[0]])
print items
for i in range(items):
if i % 1000 == 0:
print "Processing:", i
for zone in zones:
lst = dct_zone_value[zone][i]
id_pnt = lst[0]
if not id_pnt in dct_pnt_zone:
# dist = lst[1]
val = dct_pnts[id_pnt]
score = dct_scores[zone]
if score + val < zone_score:
dct_pnt_zone[id_pnt] = zone
dct_scores[zone] += val
# print dct_pnt_zone
print dct_scores
# add field to points:
arcpy.AddField_management(fc_pnt, fld_zone, "SHORT")
flds = ('OID@', fld_zone)
cnt = 0
with arcpy.da.UpdateCursor(fc_pnt, flds) as curs:
for row in curs:
cnt += 1
if cnt % 1000 == 0:
print "Updating point:", cnt
oid = row[0]
if oid in dct_pnt_zone:
row[1] = dct_pnt_zone[oid]
curs.updateRow(row)
if __name__ == '__main__':
main()... and this was the result in the console window:
10
10236
[1, 2, 3, 4]
{1: 0, 2: 0, 3: 0, 4: 0}
15991
Processing: 0
Processing: 1000
Processing: 2000
...
Processing: 14000
Processing: 15000
{1: 10202, 2: 10235, 3: 10235, 4: 10235}
Updating point: 1000
Updating point: 2000
...
Updating point: 14000
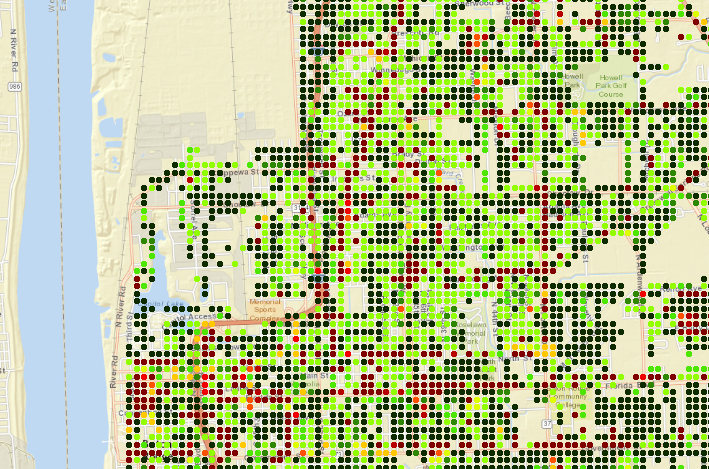
Updating point: 15000So the scores of each zone (sum of the point values) are quite similar. And when you draw the points you will see this:

As you can see the red zone extends to the south and that is not very useful. Perhaps a score should be included that weighs the distance to get a better result.
More later...
- Mark as New
- Bookmark
- Subscribe
- Mute
- Subscribe to RSS Feed
- Permalink
- Report Inappropriate Content
Let's tag Dan_Patterson and see if he knows of some numpy or other python magic that he can toss in.
- Mark as New
- Bookmark
- Subscribe
- Mute
- Subscribe to RSS Feed
- Permalink
- Report Inappropriate Content
Only to add, that if they don't have the license to use Near or its table equivalent,
generate-near-table-for-points
can be used, with a bit of upfront work particularly for a large . There is no license restriction on it, but some coding familiarity