Have you ever seen green algal swirls in surface waters or dozens of dead fish washed up on the shoreline? Do you know what likely was the cause? These phenomena are typically related to the amount of chlorophyll in our oceans. Mapping chlorophyll concentrations in the ocean can be accomplished through remote sensing. Chlorophyll in water changes the way it reflects and absorbs sunlight, allowing scientists to map the amount and location of phytoplankton using optics. These measurements give valuable insights into the health of the ocean environment, and help researchers study the ocean carbon cycle.
The same critters that cause red tides and harmful algal blooms are also the reason for success of aquaculture and fisheries. Tiny microscopic organisms called Phytoplankton contain chlorophyll and conduct photosynthesis (using light at the surface of the ocean) to produce energy, this is how they survive. These phytoplankton are at the base of the food chain for marine life and play a vital role in the carbon cycle by converting carbon dioxide to organic matter.
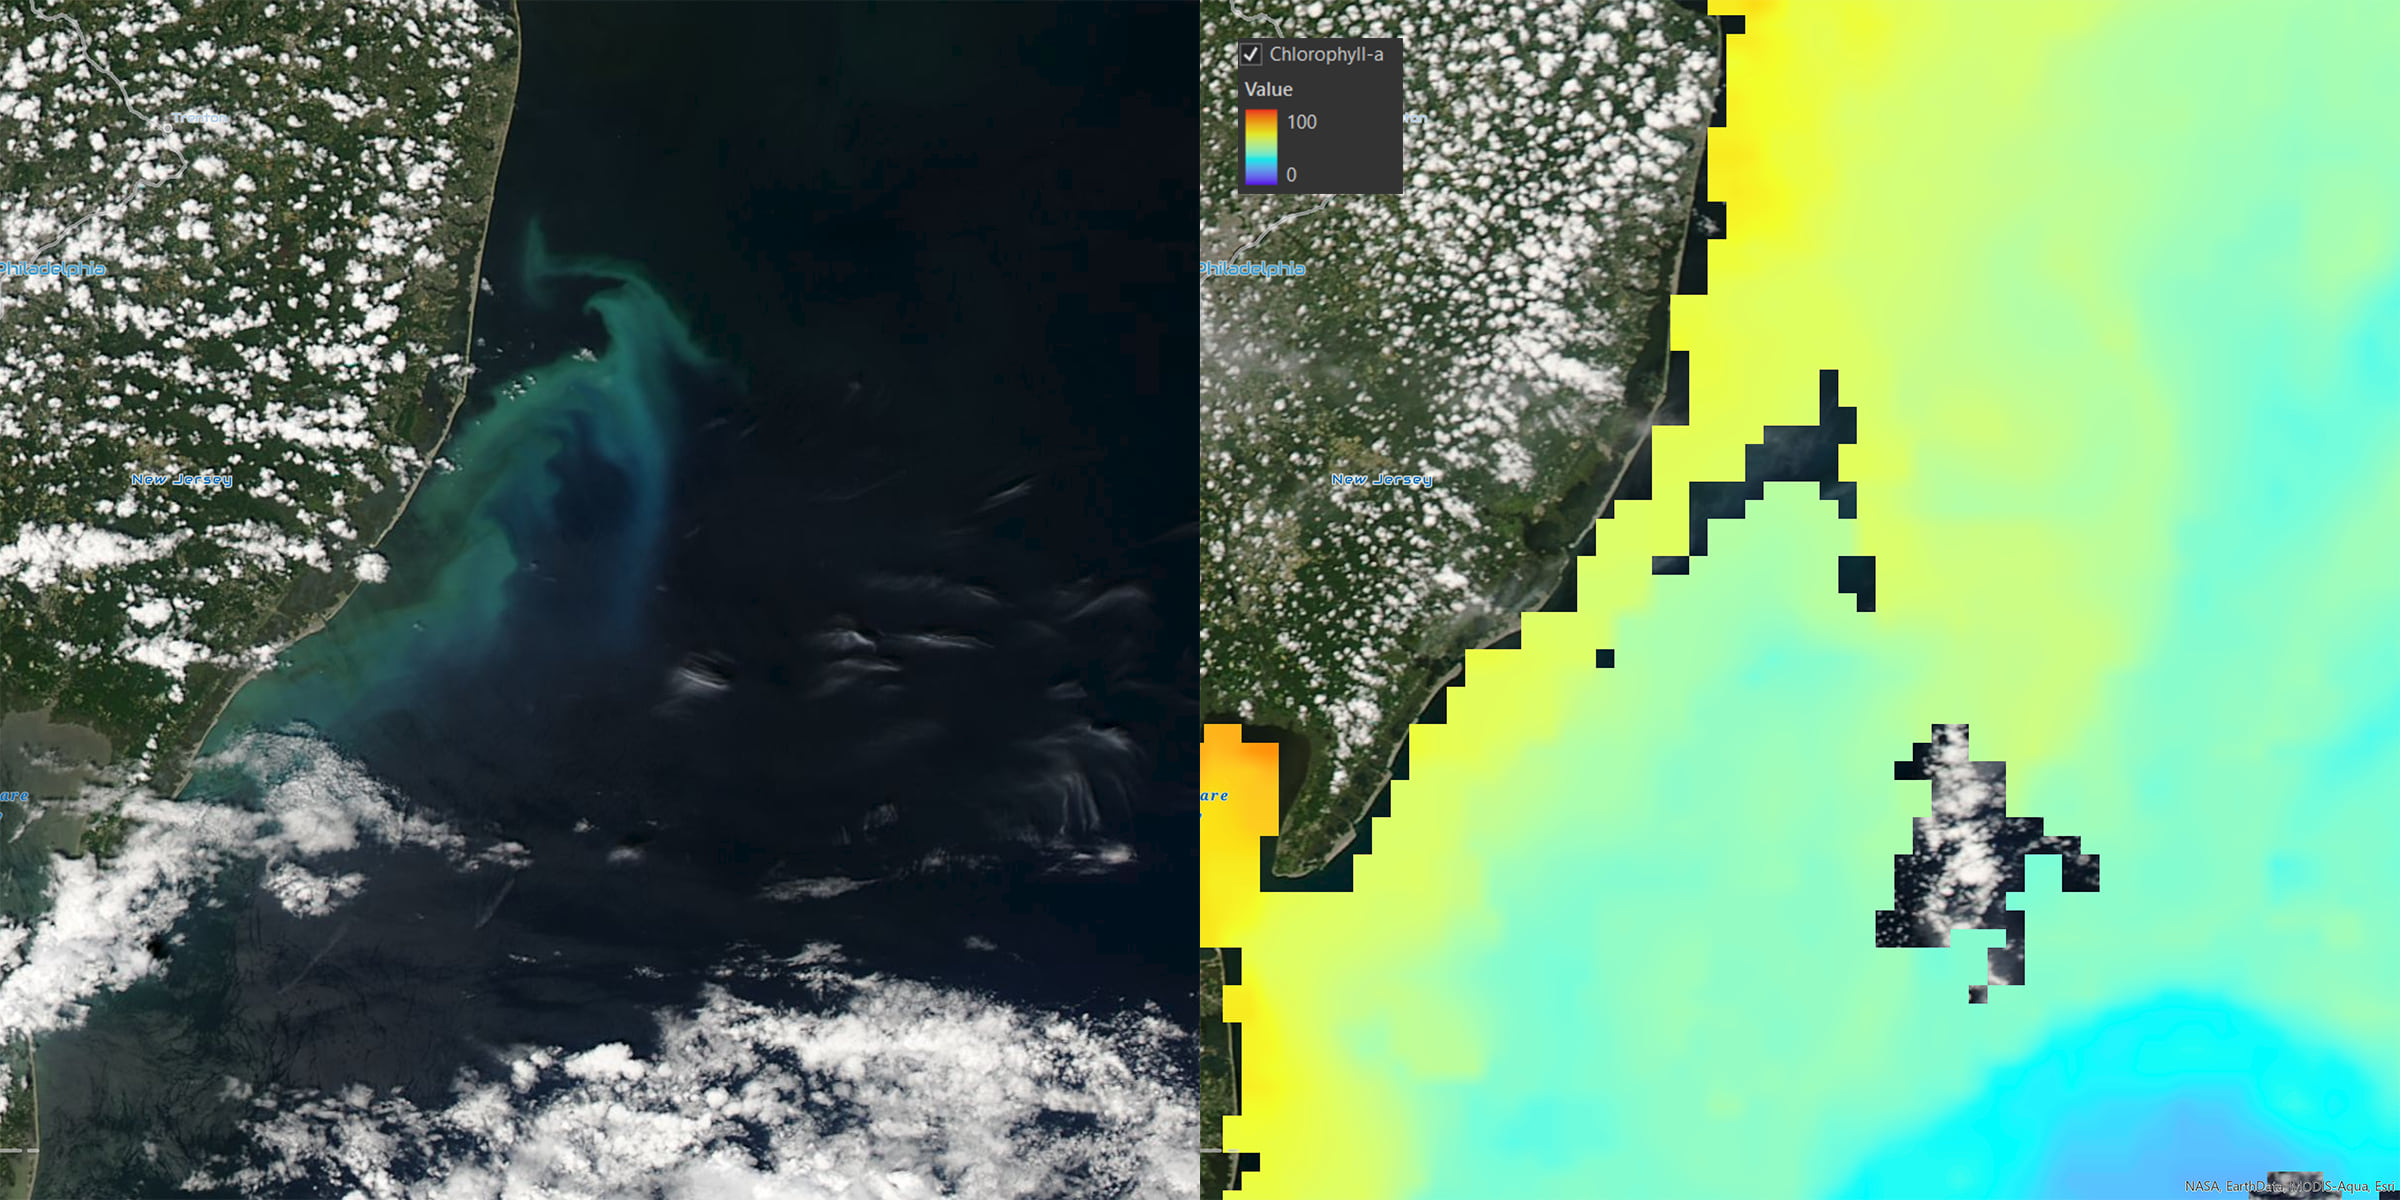
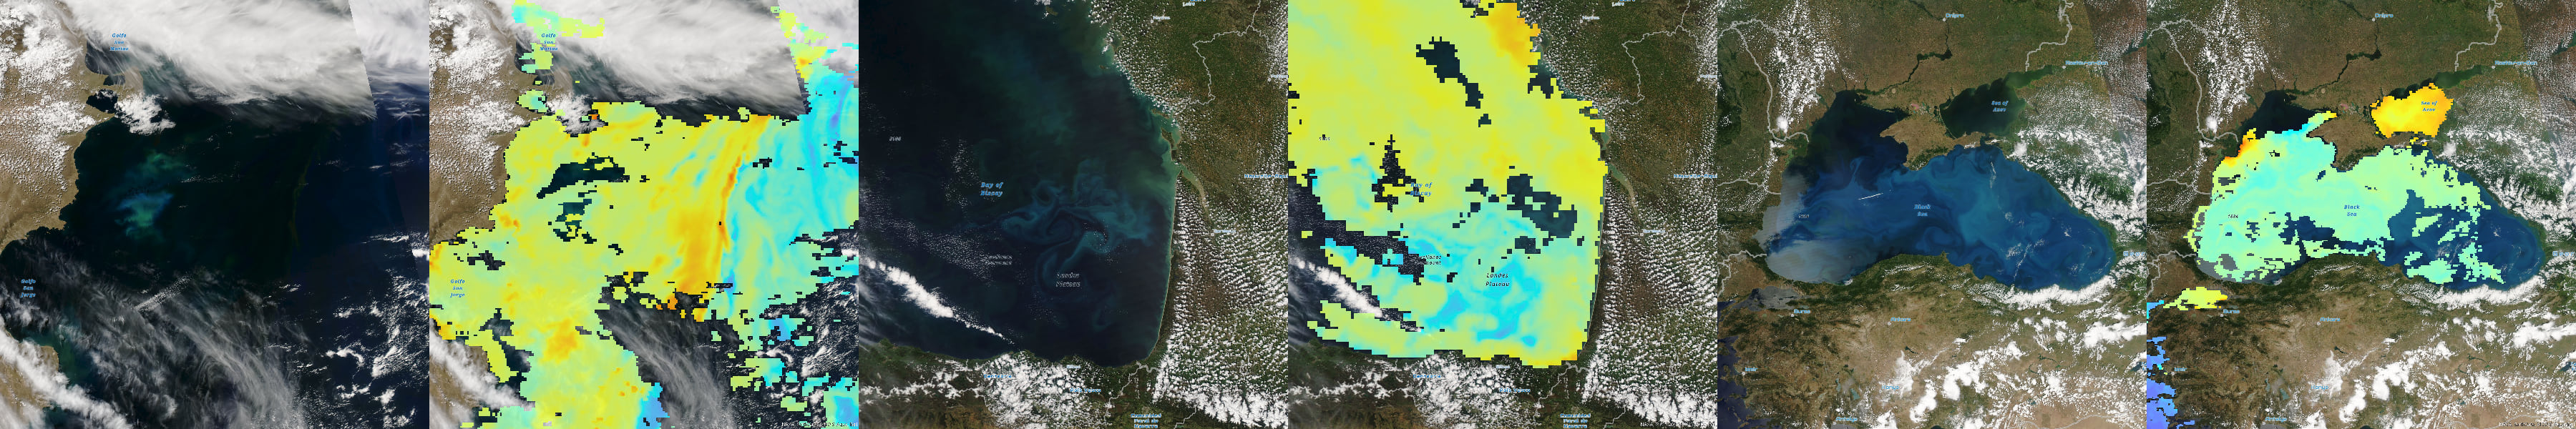
Chlorophyll concentration data shown here are obtained from global satellite measurements by the MODIS-Aqua projects of the National Aeronautics and Space Administration (NASA). The image on the left shows the true-color satellite view and the image on the right shows the chlorophyll concentrations.
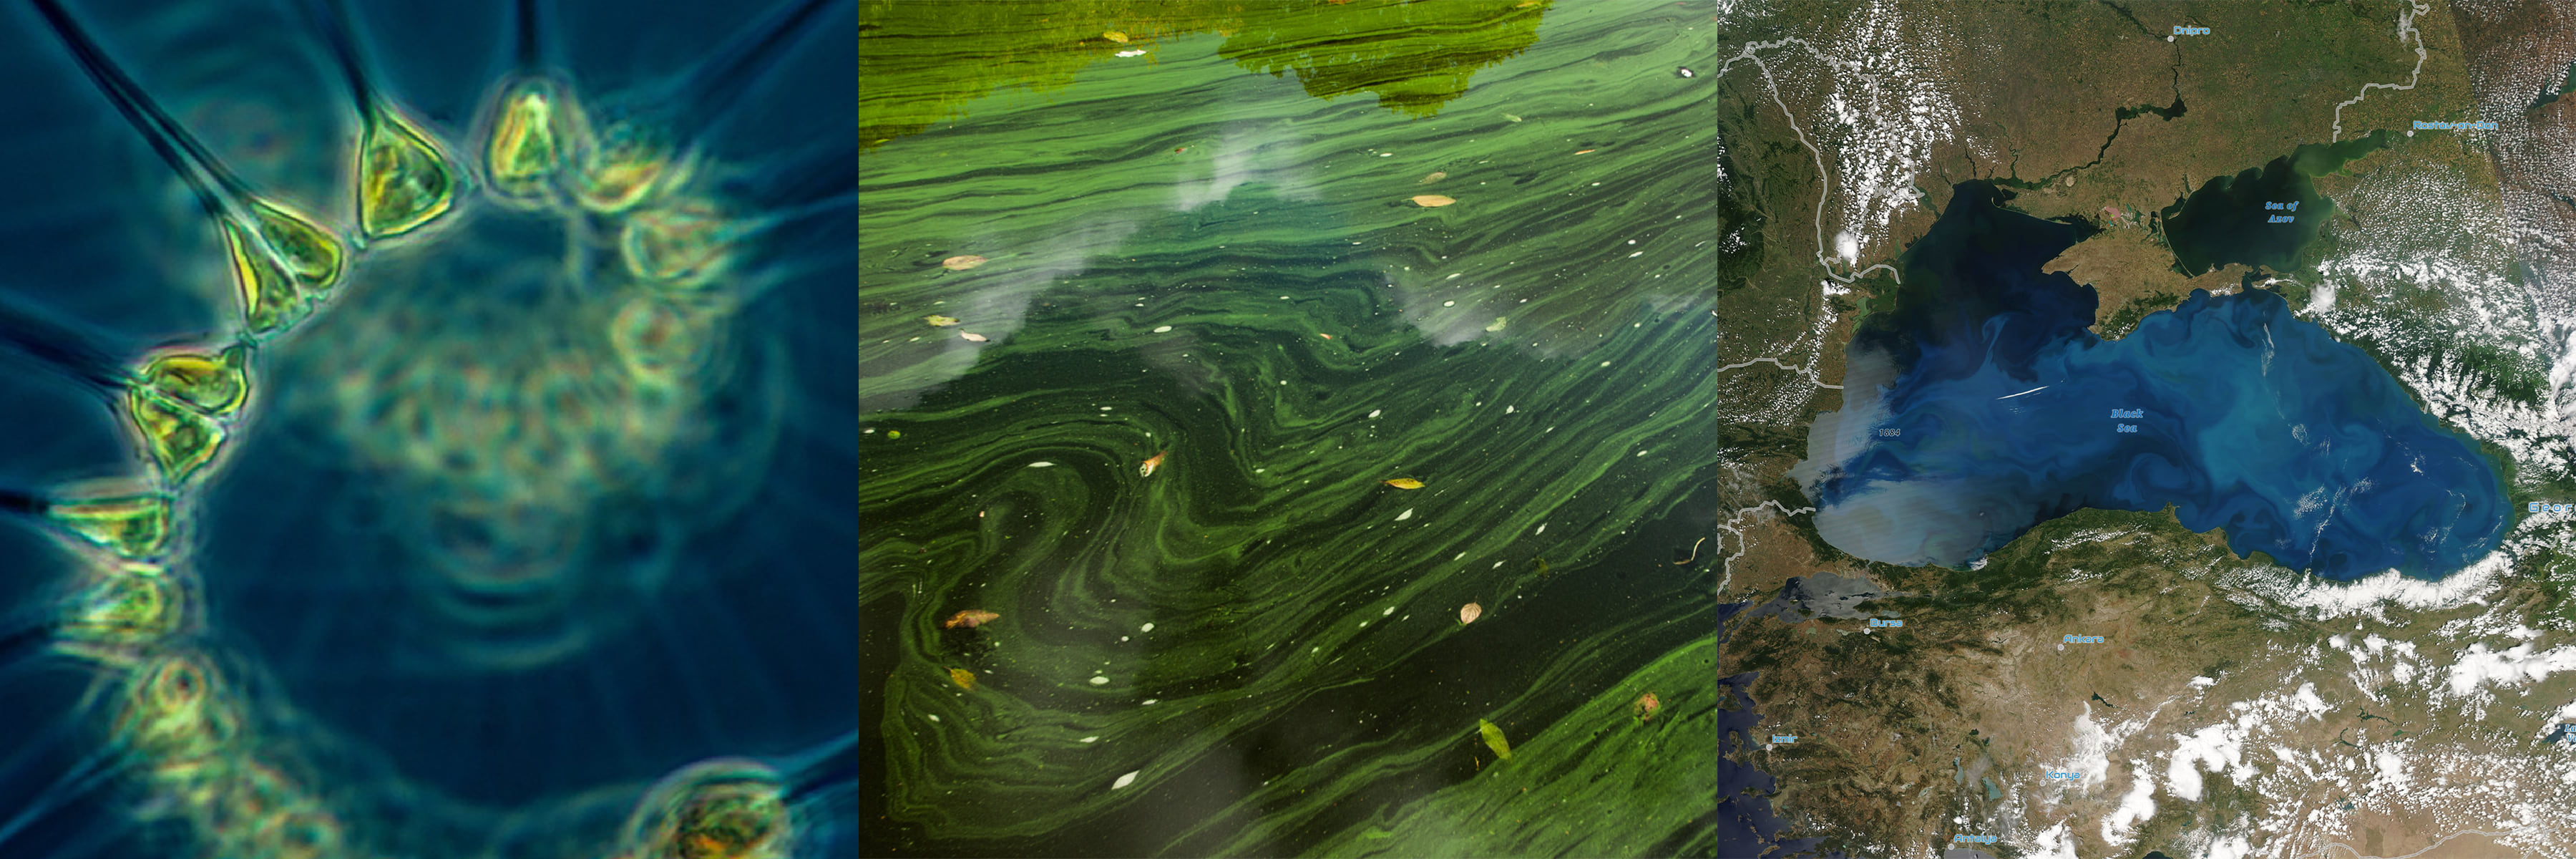
Phytoplankton are tiny microscopic organisms that survive by converting photosynthetic pigments such as chlorophyll into organic matter. The amount of phytoplankton in the ocean can be quantified by measuring chlorophyll concentrations. In the occurrence of a phytoplankton bloom, when populations are large, phytoplankton congregate, feed on the nutrients and form layers at the surface of the ocean. This causes the water to visually appear greener because of high concentrations of chlorophyll being observed from the phytoplankton.
The name Phytoplankton comes from the Greek words phyton, meaning “plant”, and planktos, meaning “wanderer” or “drifter”.
Why is this important?
Changes in phytoplankton populations can impact fish and other marine life, which can in turn affect food availability. Scientist use phytoplankton as an indicator to understand the health and productivity of ecosystems both in the ocean and on land.
Chlorophyll is a new layer added by Esri to the Living Atlas of the World. It’s one of the many layers that is available within the Environmental collection of content. A few things that make this layer unique: it’s updated daily (automated) to reflect the previous days collection, the collection includes the entire archive spanning back to 2002, you can view the common time intervals (daily, 8 day, monthly) for the entire span of the archive, and the data are fully capable for analytics.
The layer is updated routinely using the Aggregated Live Feed tool.
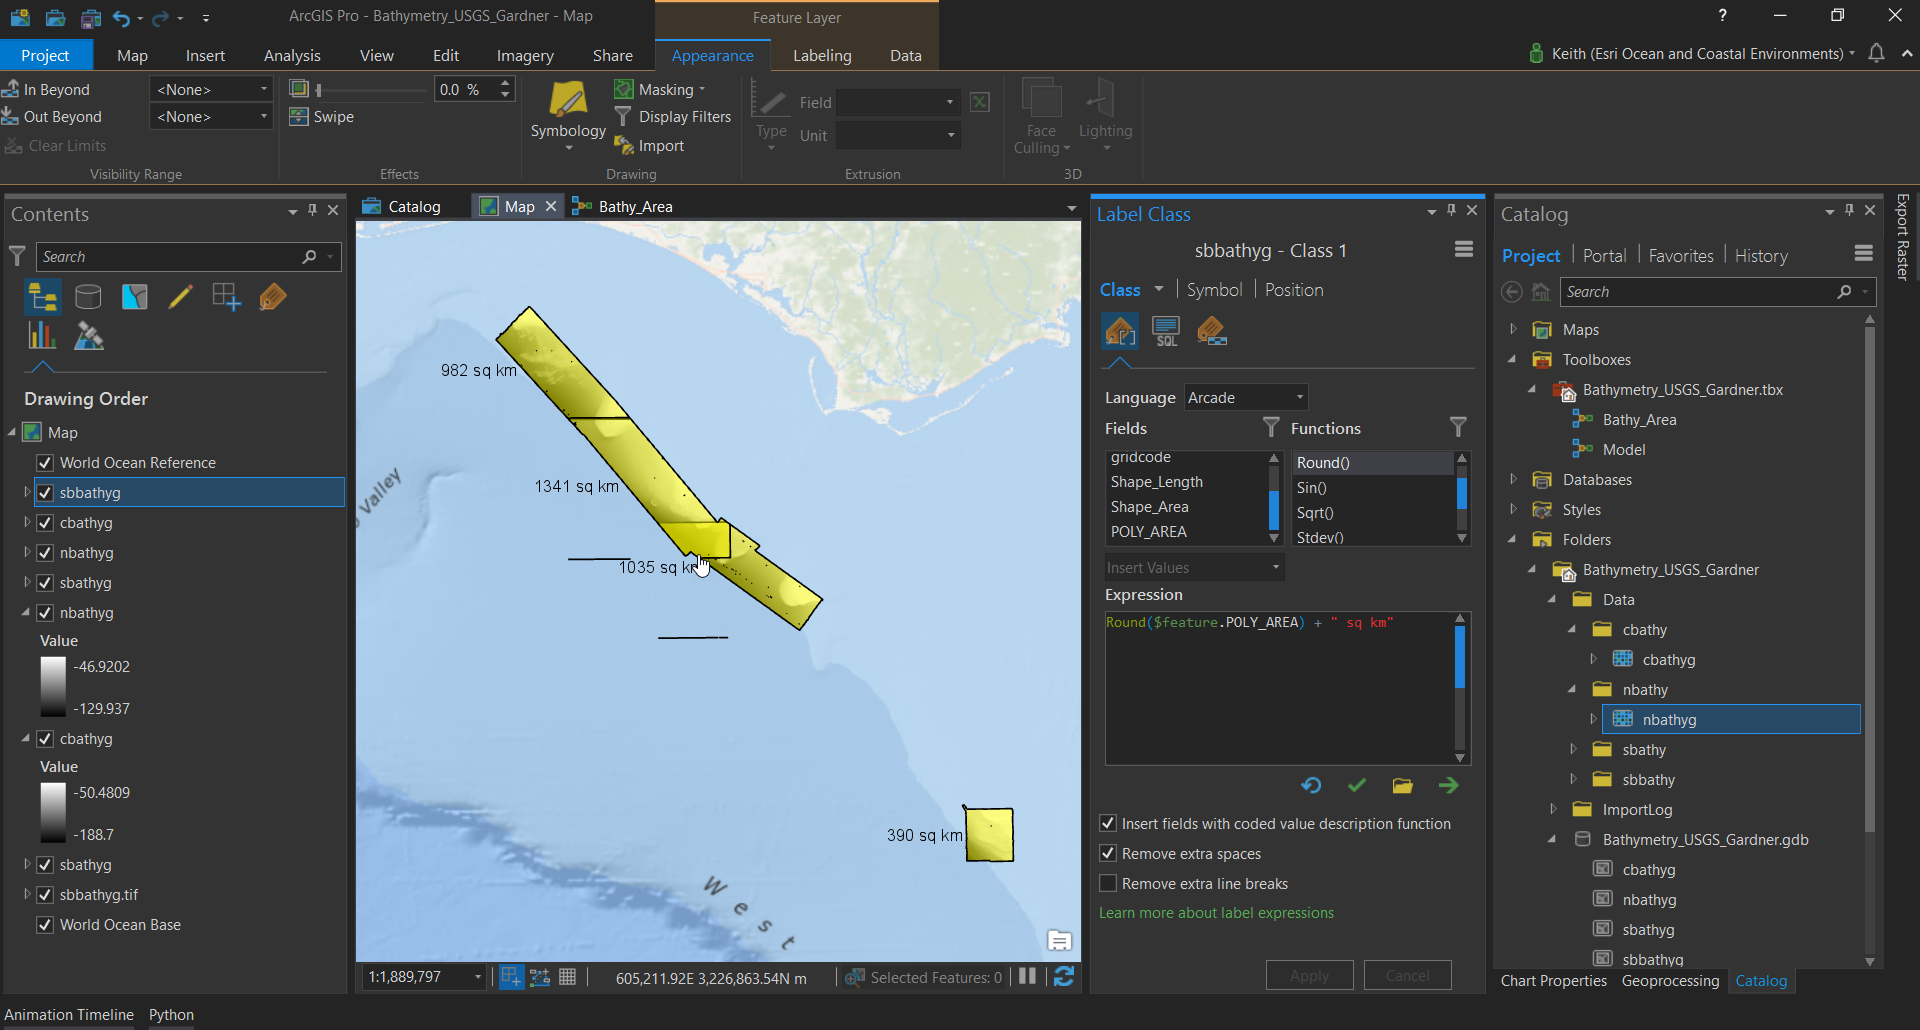
Visualization: This layer can be used for visualization online in web maps and in ArcGIS Desktop.
Analysis: This layer can be used as an input to geoprocessing tools and model builder. Units are in mg/m-2. See this Esri blog post for more information on how to use this layer in your analysis. Do not use this layer for analysis while the Cartographic Renderer processing templates are applied.
Time: This is a time-enabled layer. It shows the average chlorophyll-a concentration during the map’s time extent, or if time animation is disabled, a time range can be set using the layer’s multidimensional settings. The map shows the average of all days in the time extent. Minimum temporal resolution is one day; maximum is one month.
Supporting images generated in ArcGIS Pro using Chlorophyll concentrations combined with the MODIS True Color Imagery available from Esri’s Living Atlas of the World.
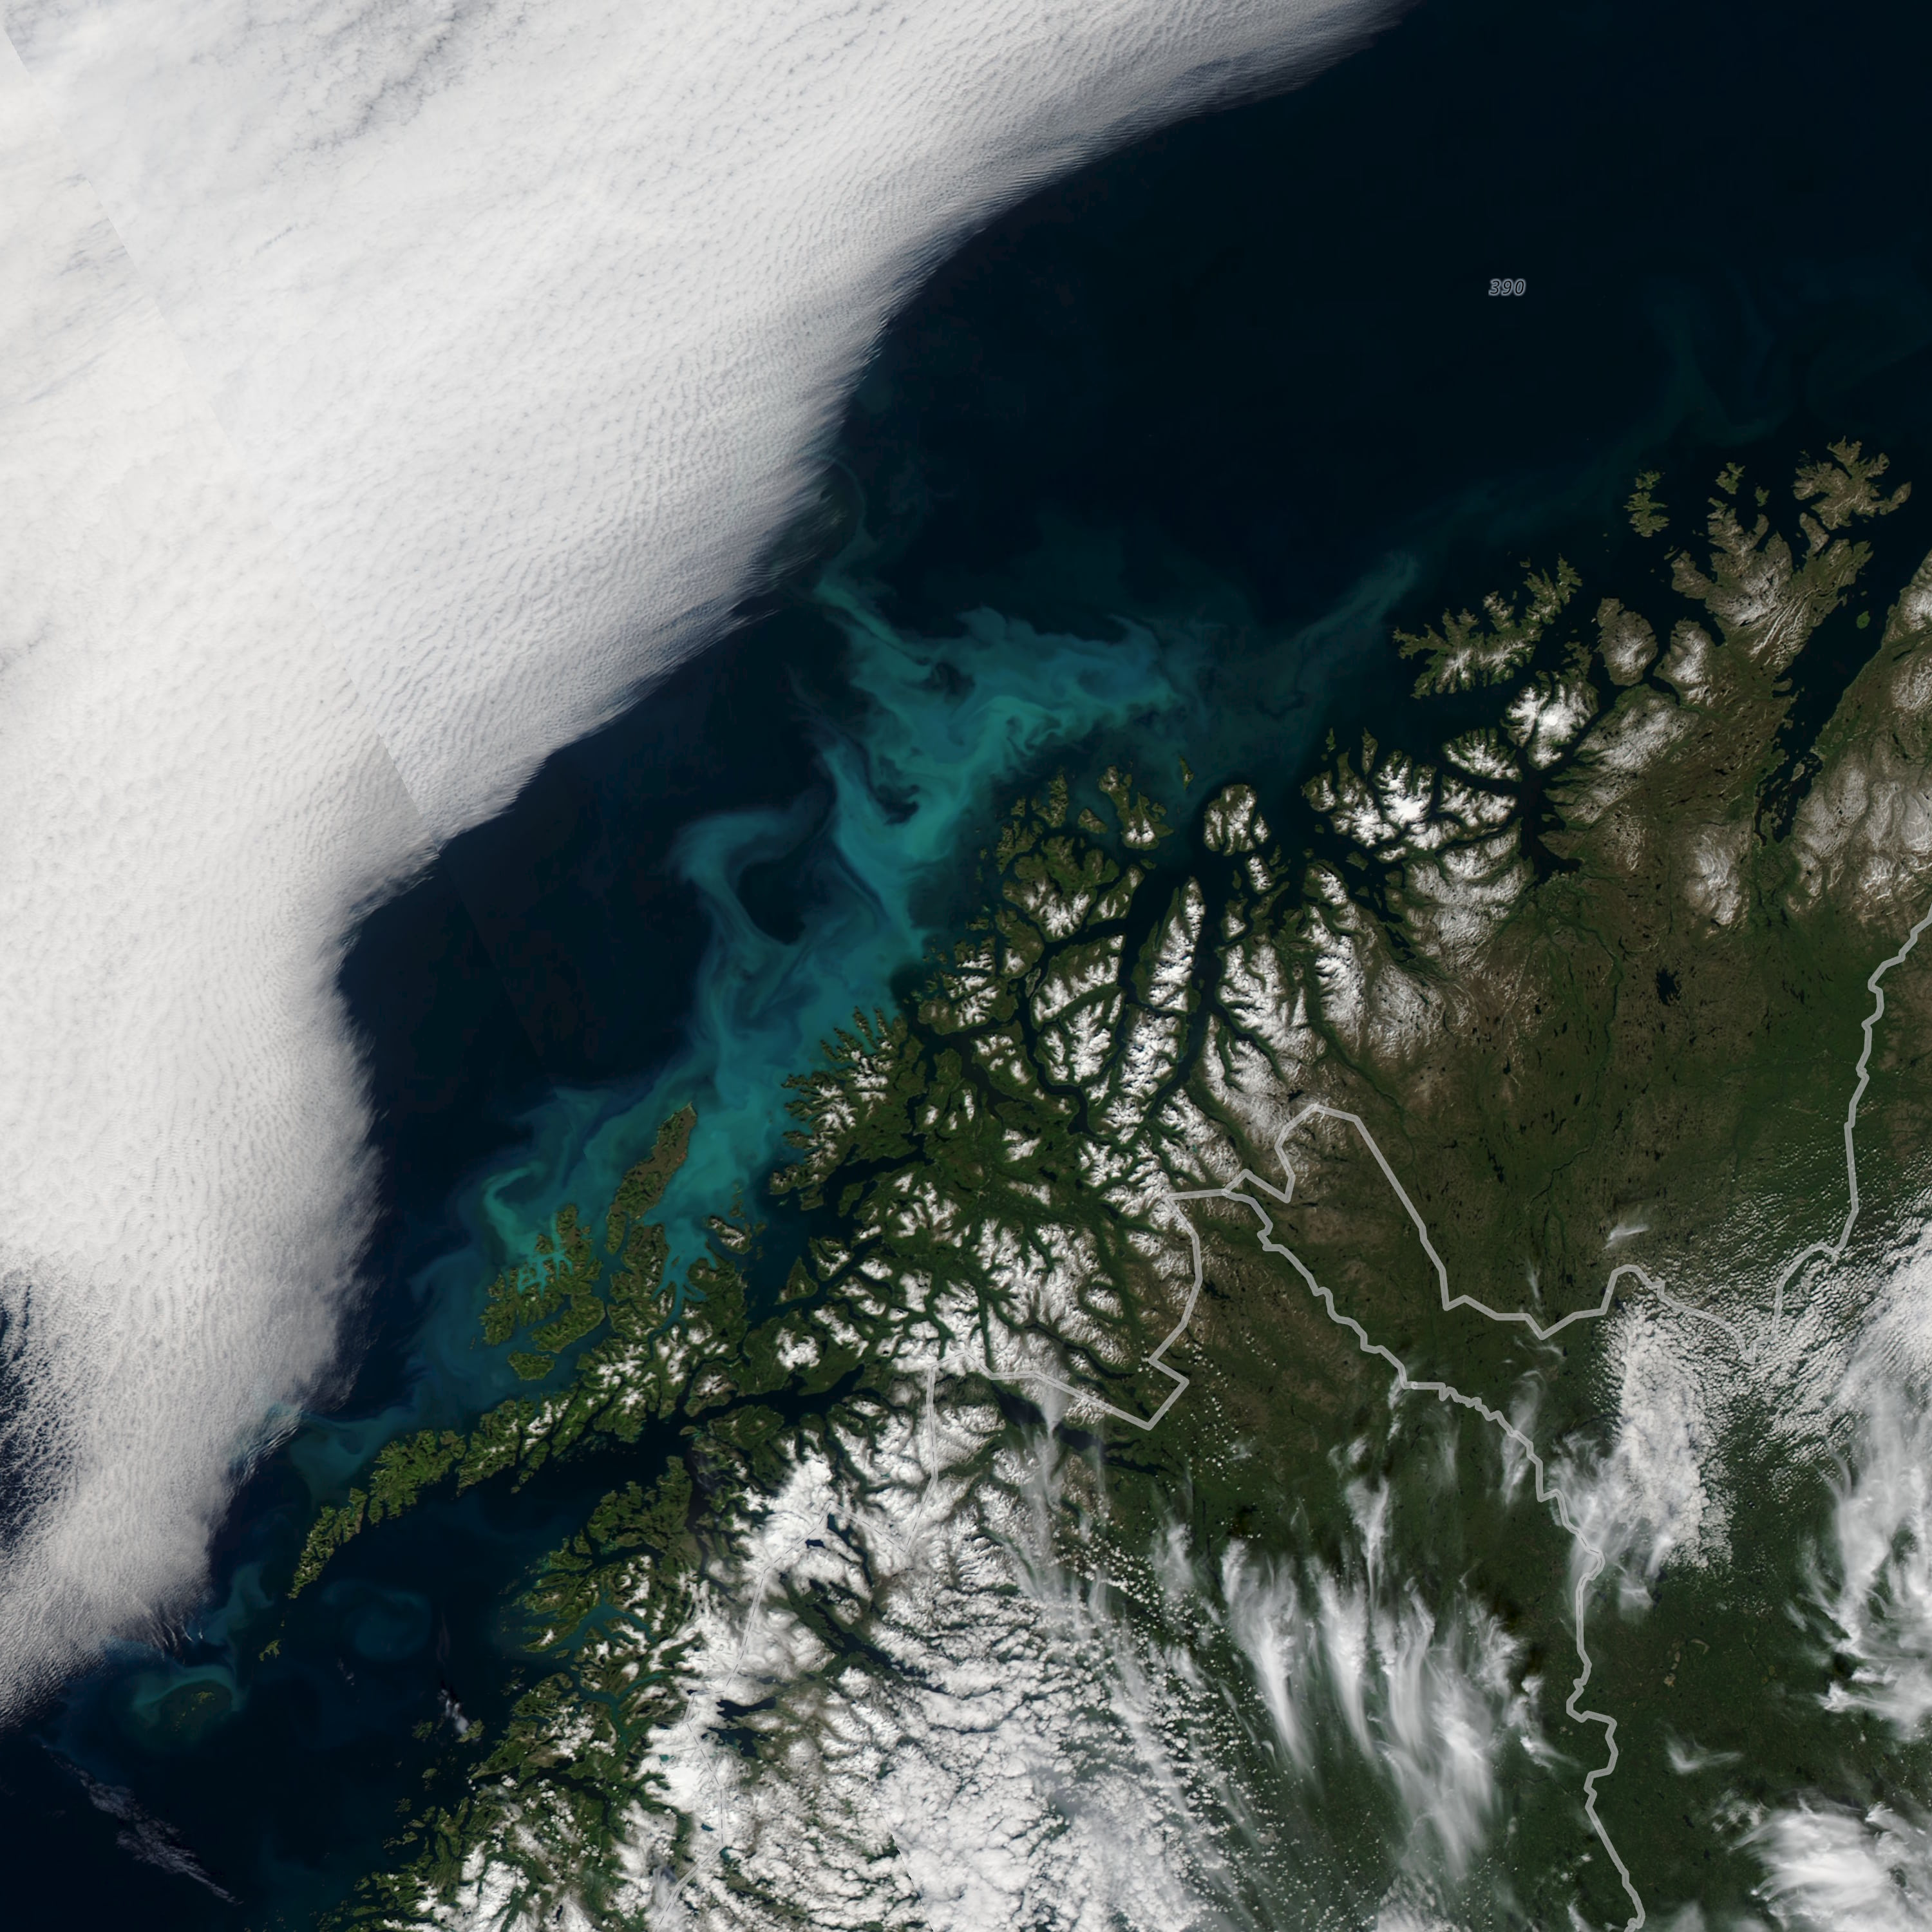
North Sea Bloom | Phytoplankton Bloom off the north coast of Norway - July 23, 2017. MODIS
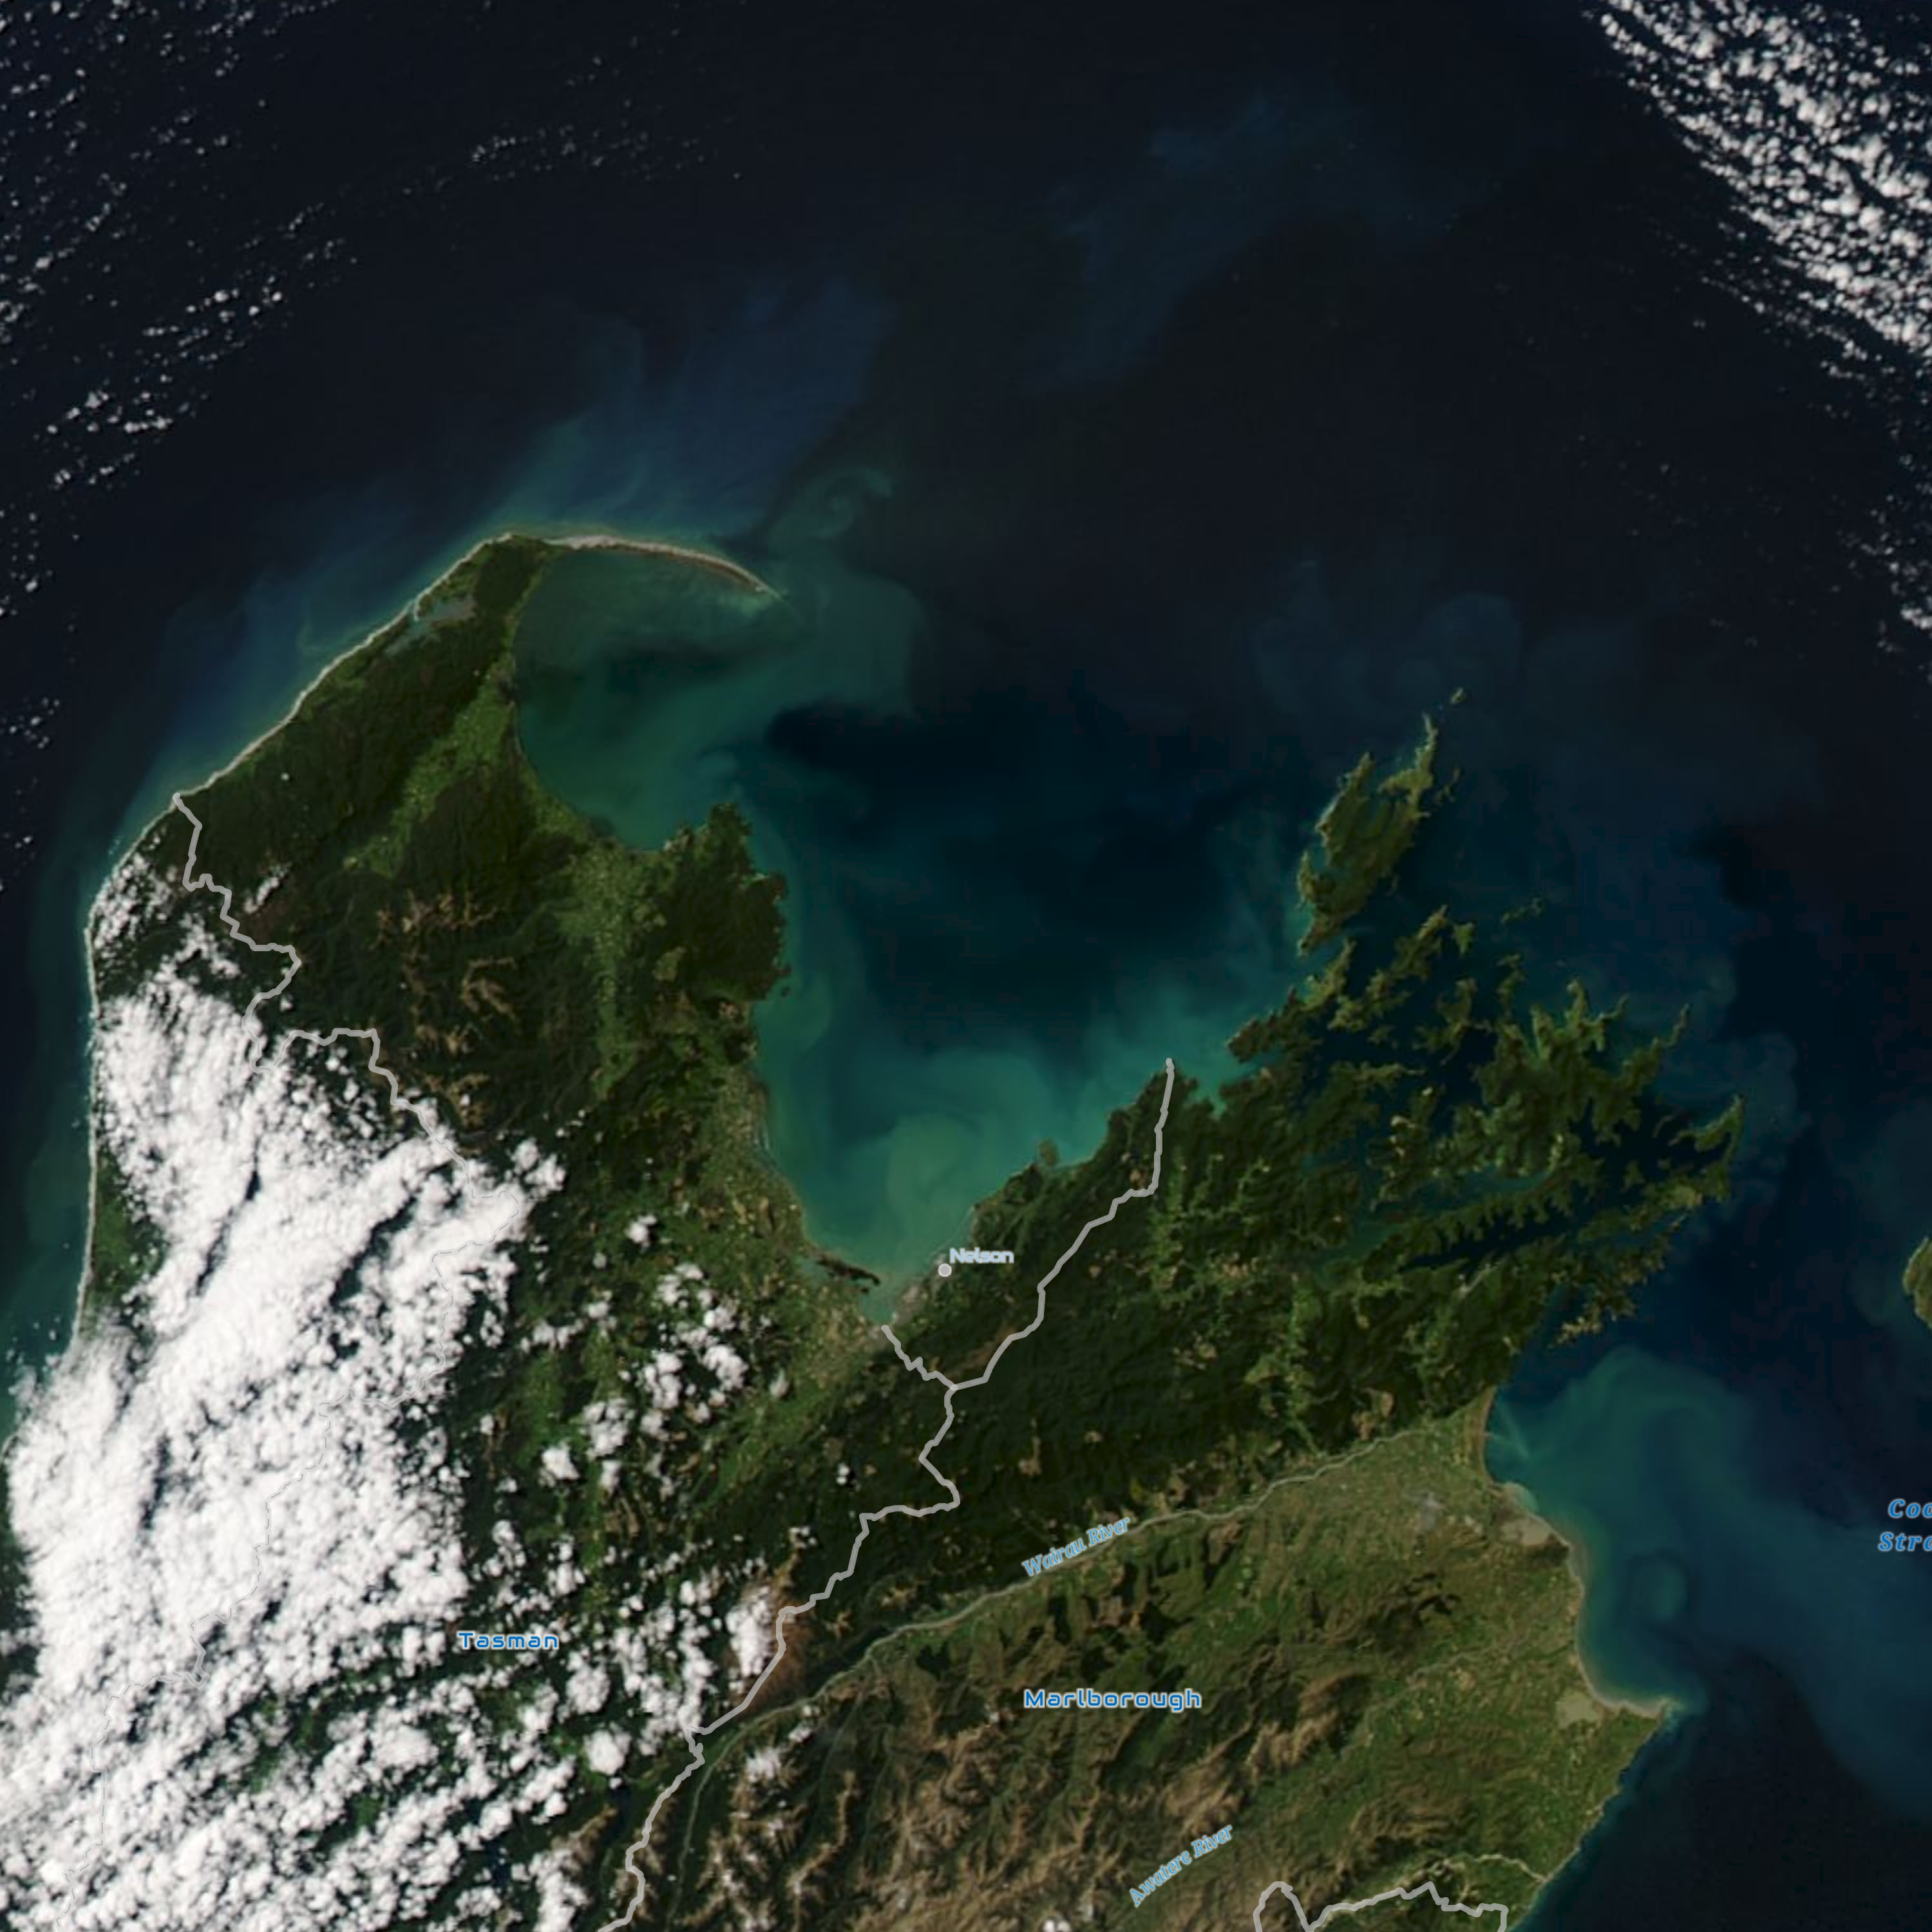
Tasman Bay Bloom | November 9th, 2017 - Tasman Bay phytoplankton Bloom
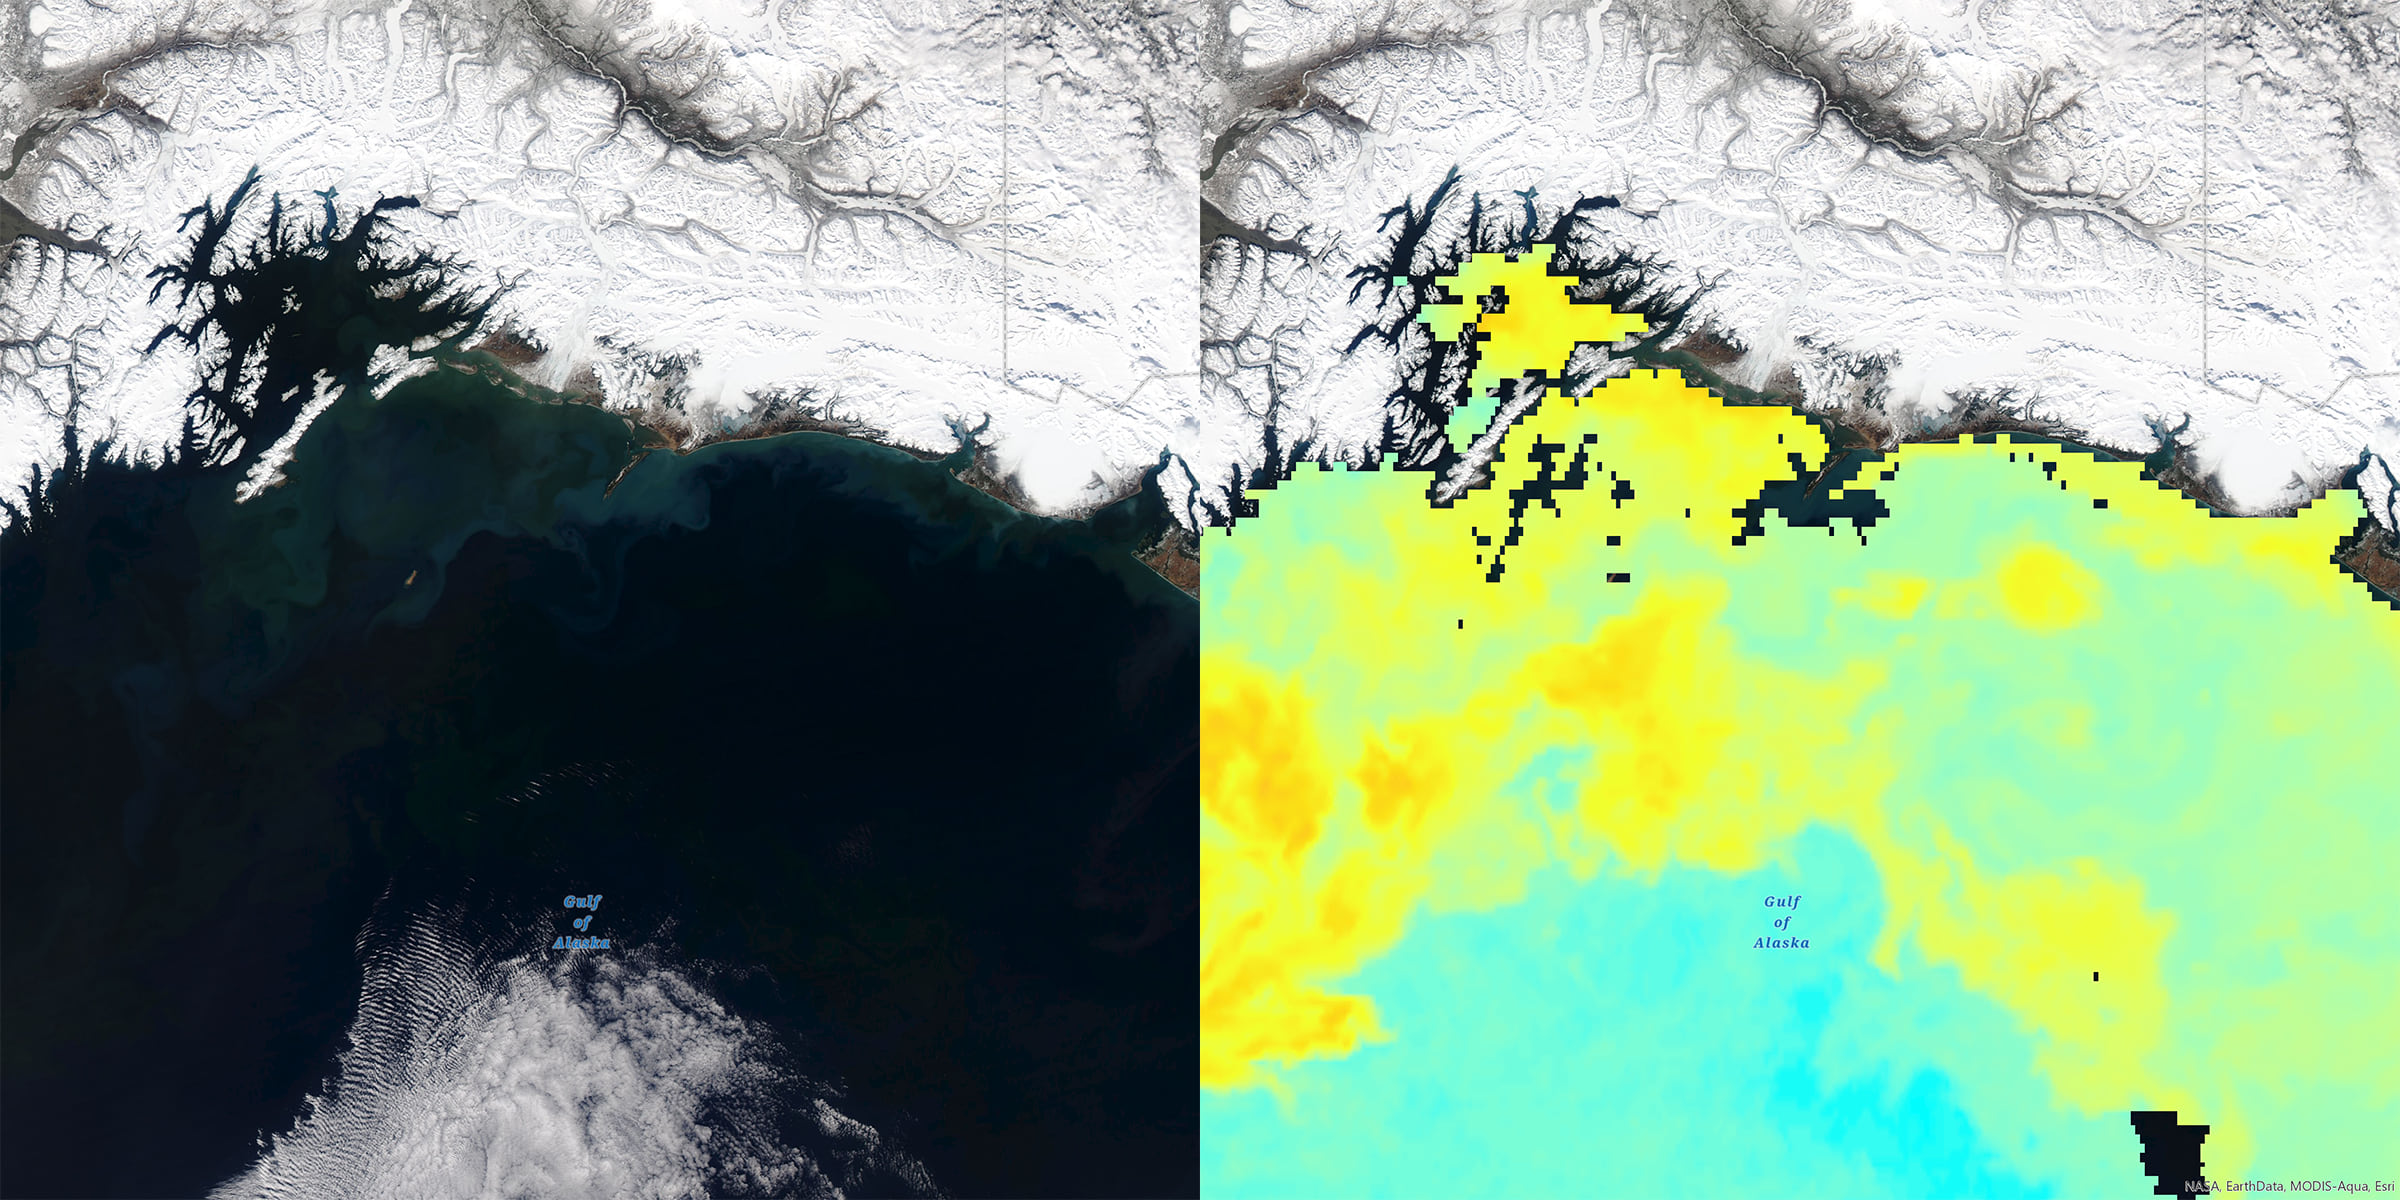
Gulf of Alaska | Phytoplankton Bloom in the Gulf of Alaska on May 12, 2017. MODIS.
If you’re interested in learning more about Chlorophyll, Phytoplankton and the Ocean here are some additional resources:
NASA | Earth Science Week: The Ocean’s Green Machines
https://www.nasa.gov/content/goddard/nasa-ocean-data-shows-climate-dance-of-plankton/
https://oceanservice.noaa.gov/facts/habharm.html
https://www.globalchange.gov/browse/indicators/indicator-ocean-chlorophyll-concentrations
References:
Thurman, H. V. (2007). Introductory Oceanography. Academic Internet Publishers. ISBN 978-1-4288-3314-2.
NASA Earth Observatory (2010). Importance of phytoplankton. Web Article.
the living atlas living atlas layers esri ocean ocean science

 The day will continue with Lightning Talks, and more concurrent sessions of Ocean and Atmospheric from you.