Turn on suggestions
Auto-suggest helps you quickly narrow down your search results by suggesting possible matches as you type.
Cancel
Ocean Science Blog - Page 2
Turn on suggestions
Auto-suggest helps you quickly narrow down your search results by suggesting possible matches as you type.
- Home
- :
- All Communities
- :
- Industries
- :
- Science
- :
- Ocean Science
- :
- Ocean Science Blog
- :
- Ocean Science Blog - Page 2
Options
- Mark all as New
- Mark all as Read
- Float this item to the top
- Subscribe to This Board
- Bookmark
- Subscribe to RSS Feed
Subscribe to This Board
Showing articles with label Ecological Marine Units.
Show all articles
Latest Activity
(81 Posts)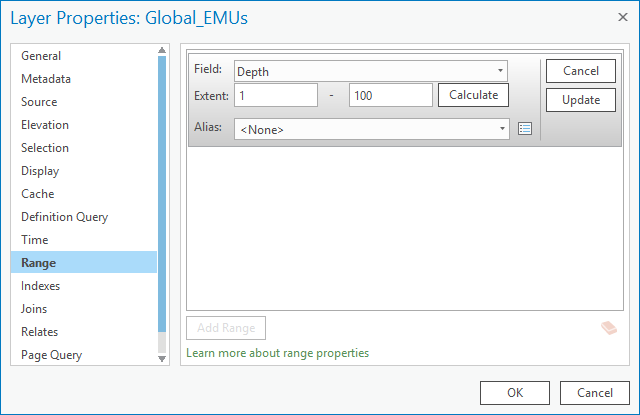
Esri Contributor
01-11-2017
04:44 PM

5
0
1,144
Esri Contributor
01-03-2017
02:16 PM
0
0
1,460
44 Subscribers
Labels
-
Ecological Marine Units
15
Popular Articles
Announcing the WINNERS of Esri's New Global Content Challenge
DawnWright
Esri Regular Contributor
9 Kudos
0 Comments
What to expect at the 2019 Ocean and Atmospheric Forum
DrewStephens
New Contributor III
6 Kudos
1 Comments
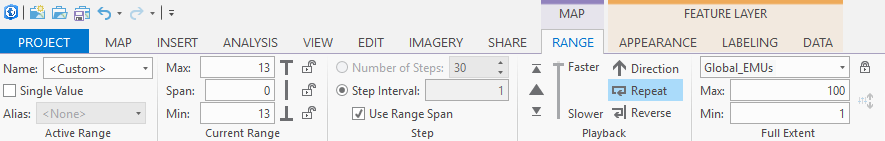
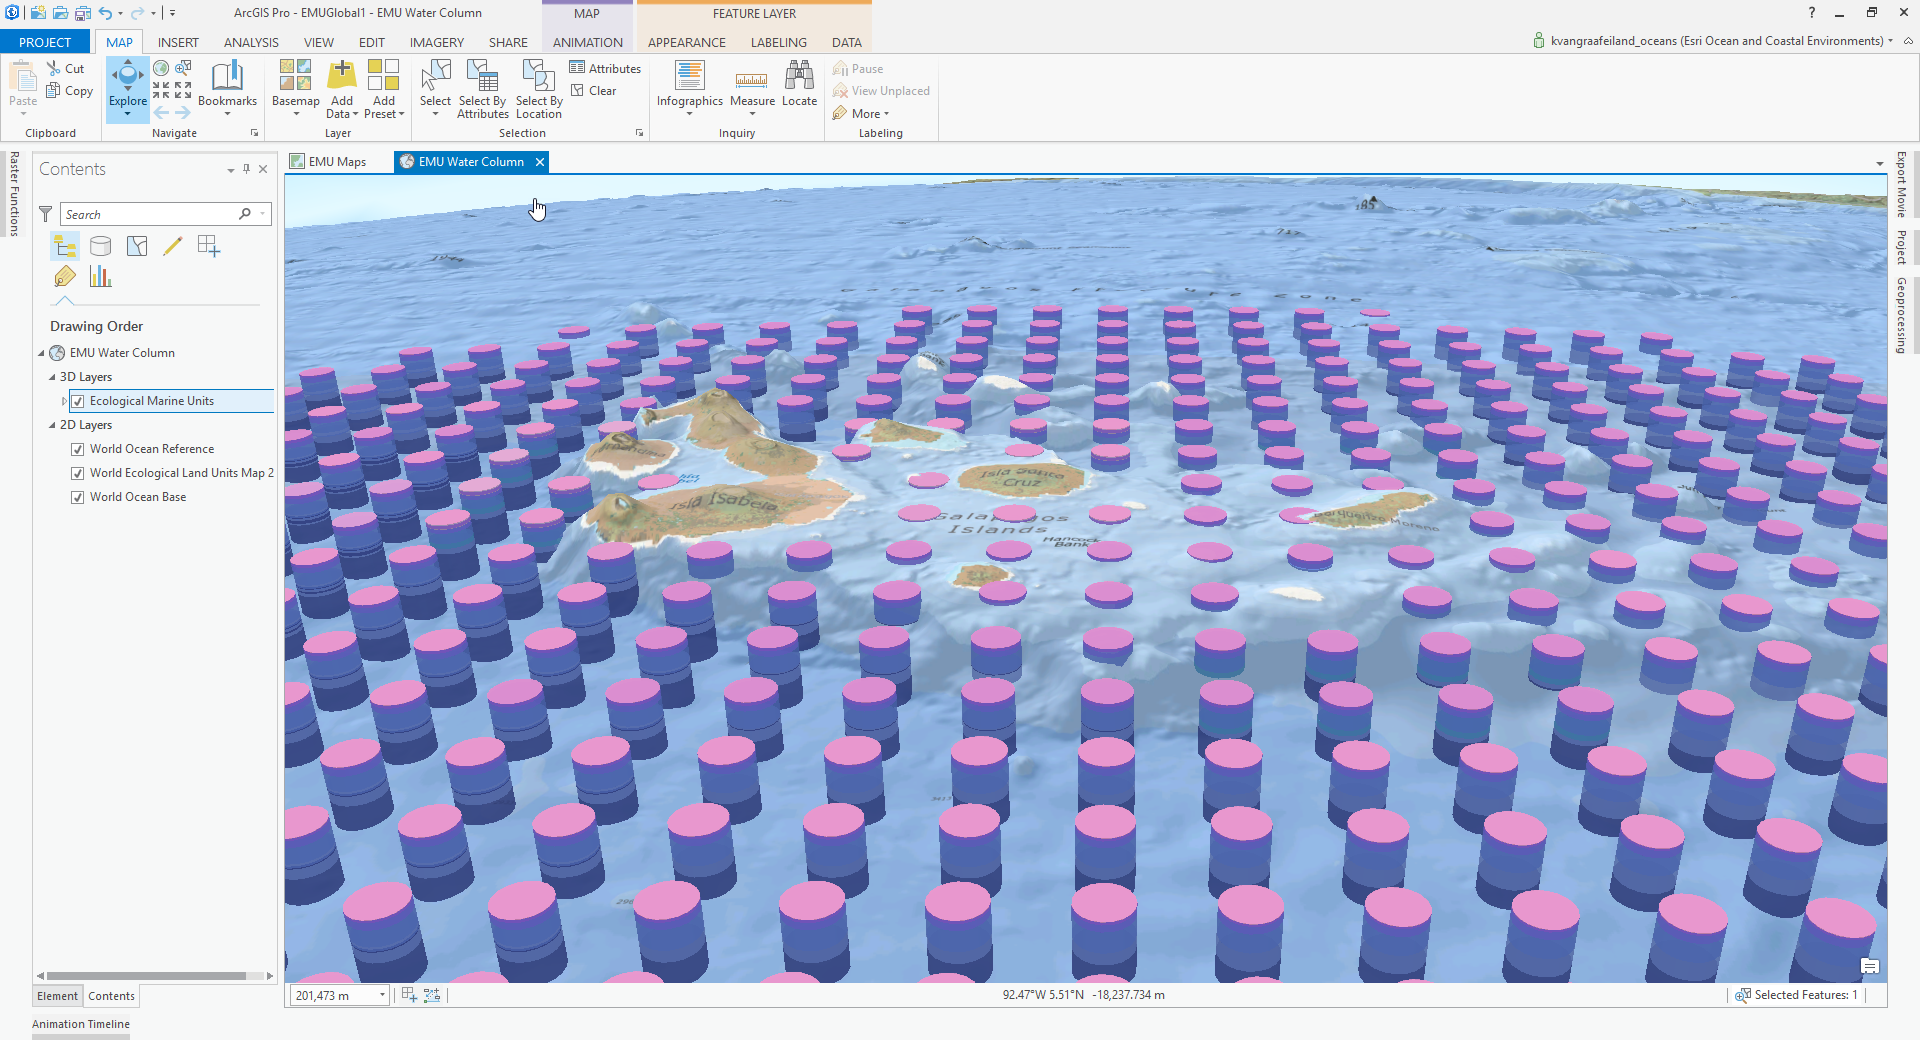
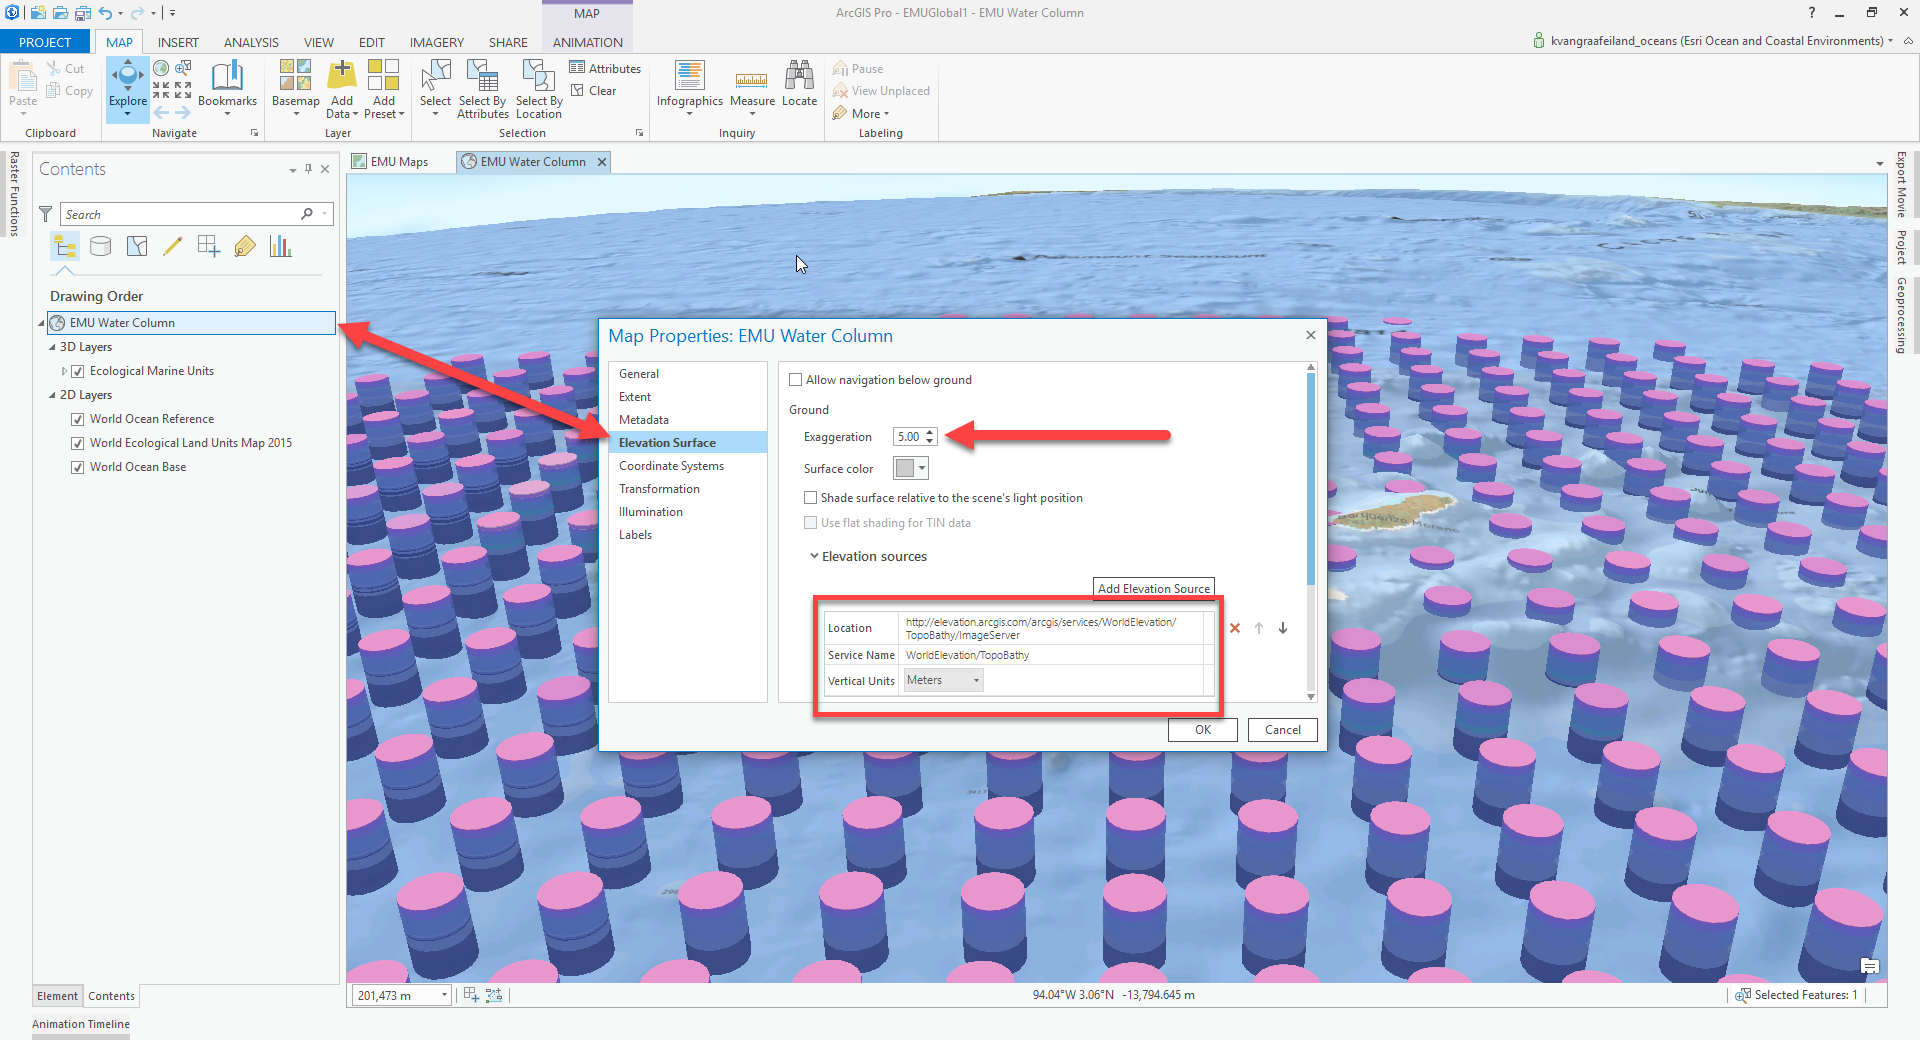
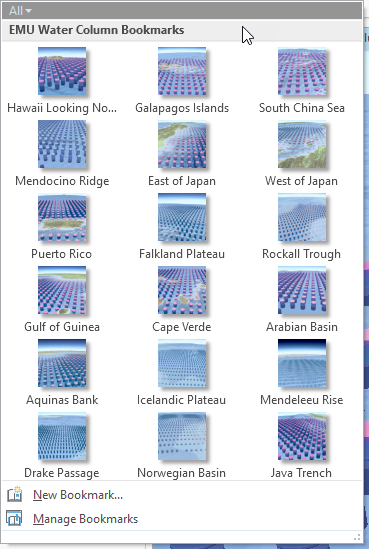
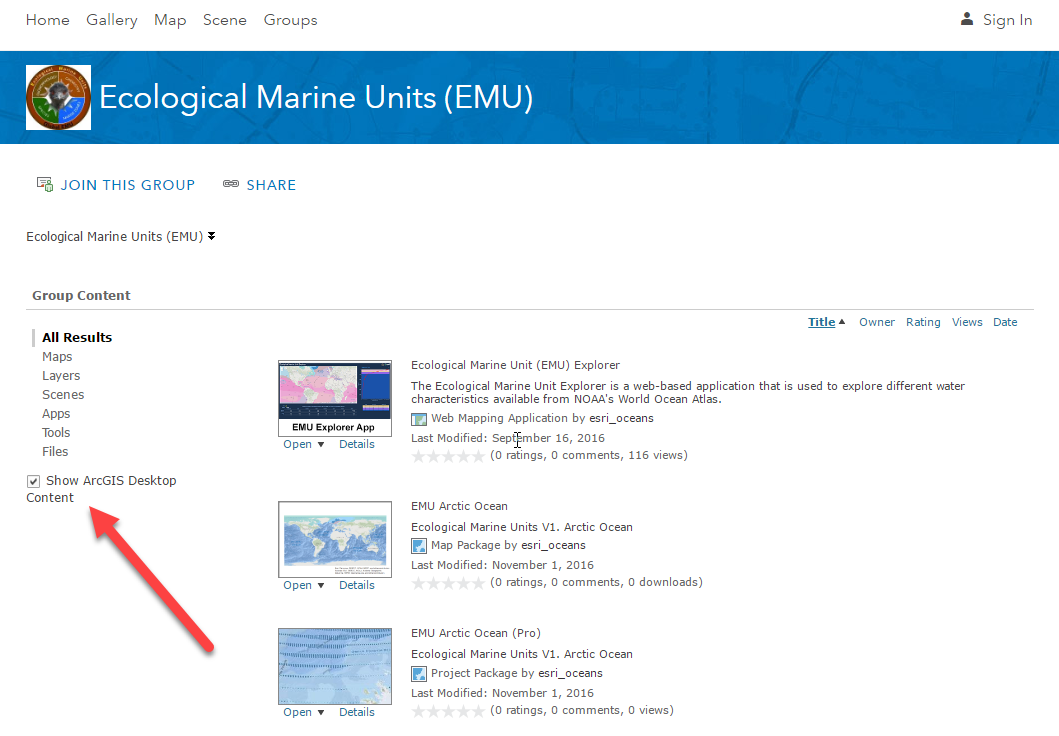
Familiarizing Yourself with EMU’s in ArcGIS Pro
Keith-VanGraafeiland
Esri Contributor
5 Kudos
0 Comments