- Home
- :
- All Communities
- :
- Industries
- :
- Natural Resources
- :
- Mining
- :
- Mining Blog
- :
- Imago and ArcGIS Integration Quick Overview
Imago and ArcGIS Integration Quick Overview
- Subscribe to RSS Feed
- Mark as New
- Mark as Read
- Bookmark
- Subscribe
- Printer Friendly Page
- Report Inappropriate Content
Imago offers a platform for capturing and cataloging geoscientific imagery for outcrops, hand samples, cores, chips, and much more. These all have a location and being able to visualize them on a map helps to gain a better understanding of your data. Part of Imago’s platform is providing an API that you can use to access their imagery from other applications, such as an ArcGIS map. By doing this, you can search for data geographically and add more reference data such as faults, claims, leases, geologic units, and more.
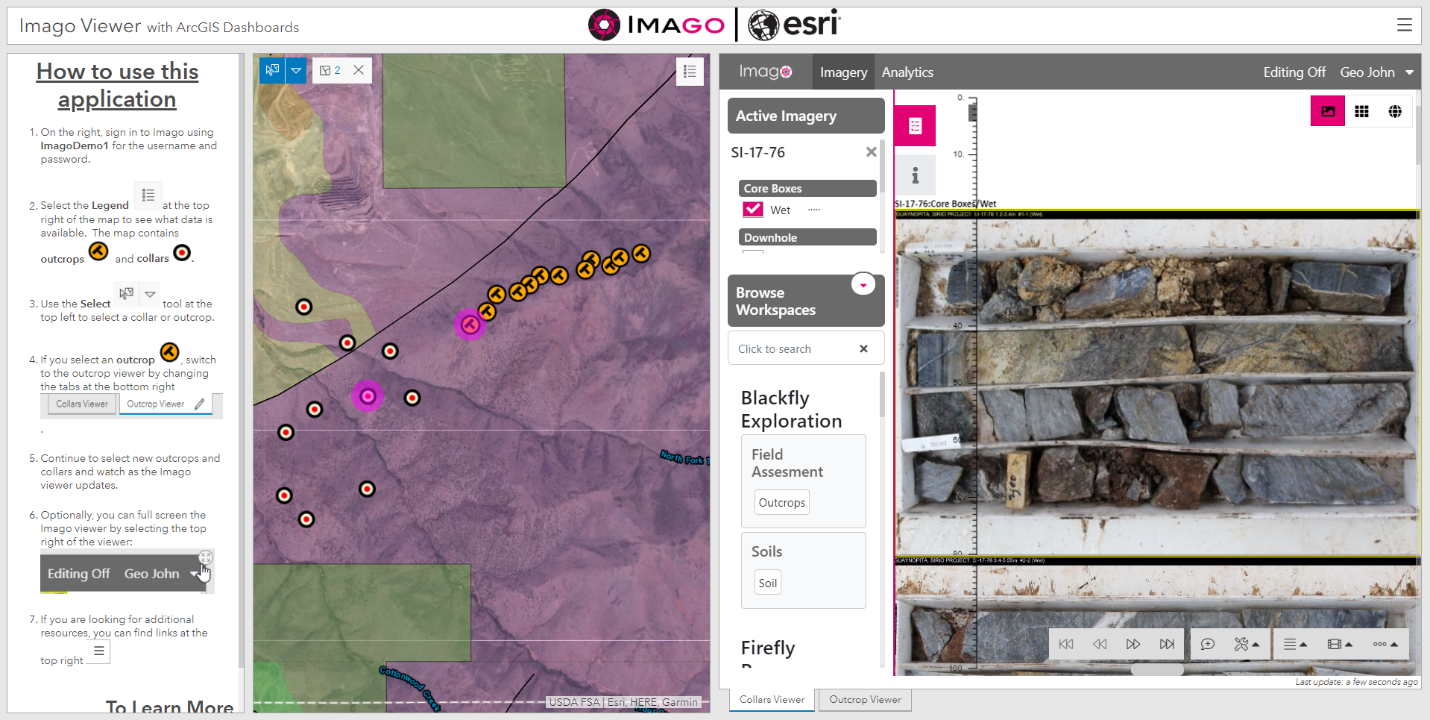
In this blog, I am going to show you how to access Imago images from an ArcGIS Dashboard (like the below image) so that you can dynamically select outcrops and collars on the map to view in Imago.
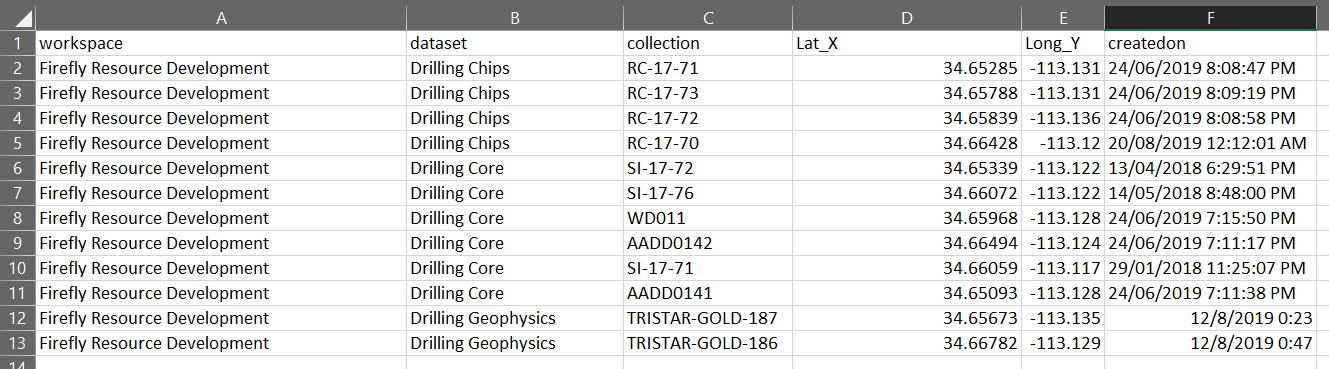
First, it starts with creating data in ArcGIS Pro. To do this, I had spreadsheets (attached to blog) for collars and outcrops which had latitude and longitude as well as a collection identifier field from the source data. The collection ID field will be used to query the Imago API. I used Excel to Table and XY Table to Point to plot the locations on a map in ArcGIS Pro.
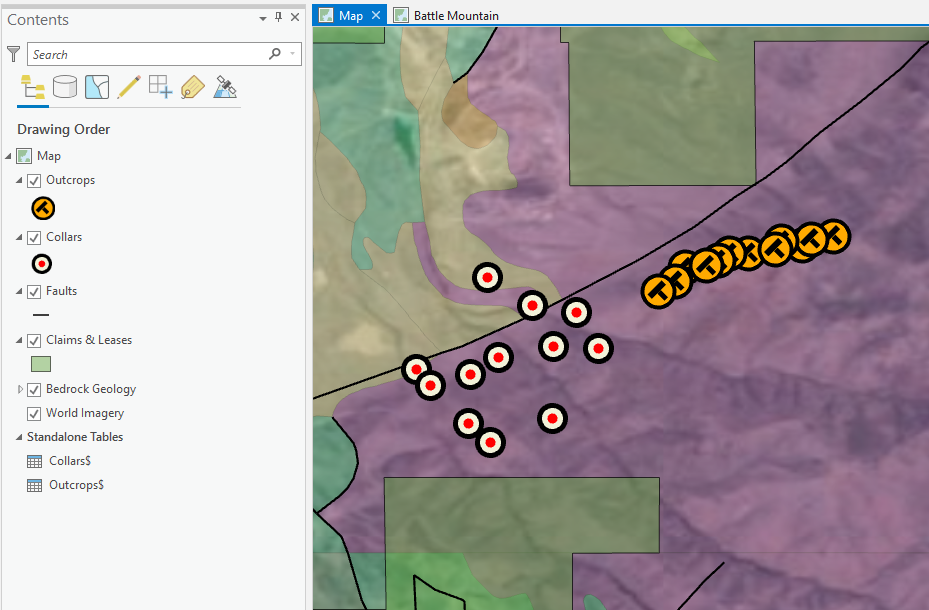
I then applied symbology for the outcrops and collars and added additional data layers to give extra context. With my map created, I shared it with my ArcGIS Online/ArcGIS Enterprise organization. For more information on how to do this, see this tutorial: Share a web map.
For this application, I used ArcGIS Dashboards because of its ability to support embedded content such as websites. To first create a dashboard, you can follow these instructions: create a dashboard. When creating your dashboard, select the map you just published and continue with the below steps.
- Create an “Embedded Content” element
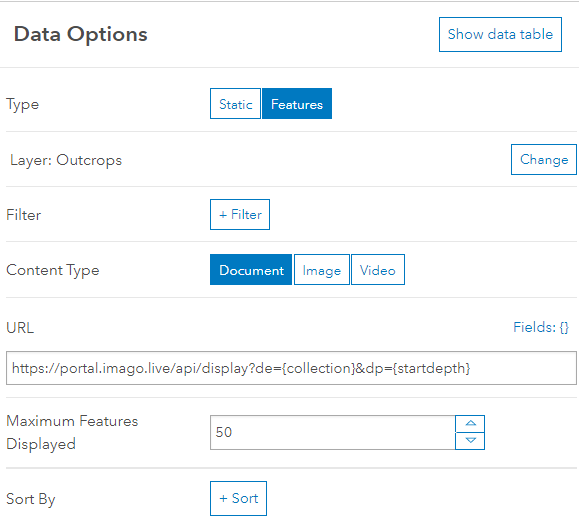
- For “Type”, choose “Features” and select either your outcrops or collars feature layer.
- In the “URL” section, construct a URL using the fields. All of the URL’s have the same structure and contain two parameters, one for the collection identifier and one for the depth, which are both fields in our feature layer. Here is a sample URL with the parameters highlighted: https://portal.imago.live/api/display?de=20180717&dp=3
To build your URL, start with “https://portal.imago.live/api/display?de=” and then select from the field's drop-down the “collection” field. Follow this with “&dp=” and finally the “start depth” field, or just the number “0” for collars, which do not have a depth.
You can read more about this from this blog by Imago: Creating a URL Link to an Imago Image.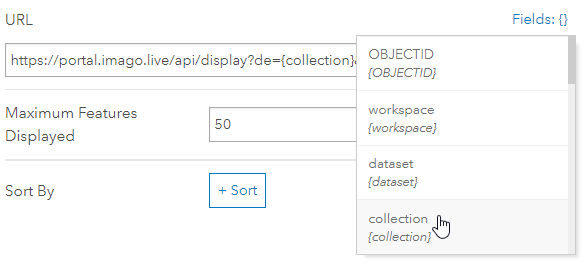
- At the bottom left, select “Done”.
- Hover over the top left of your map element and select “Configure”. Go to the “Layer Actions” tab, find your collars or outcrops layer, and choose “Add Action”, “Add Target”, and select your embedded content element. Now when you select a feature on the map, the web page will update based on the feature you select.
You now have integrated ArcGIS and Imago! There is much more you can build with ArcGIS Dashboards, if you are looking more resources, you can find some here:
You must be a registered user to add a comment. If you've already registered, sign in. Otherwise, register and sign in.