Mining Blog

cancel
Showing results for 
Show  only  | Search instead for 
Did you mean: 

Other Boards in This Place

Latest Activity

(11 Posts)
ShareUser
Esri Community Manager

Intended for database administrators as recommendations for establishing the product workspaces in an Enterprise Geodatabase (Oracle®, SQL Server®, PostgreSQL®).

Read more...

more
0 0 80
ShareUser
Esri Community Manager

Mapping & Charting Solutions (MCS) Enterprise Databases Best Practices

Intended for database administrators as recommendations for establishing the product workspaces in an Enterprise Geodatabase (Oracle®, SQL Server®, PostgreSQL®).

Read more...

more
0 0 72
Lo-RuhamaWestbrook
Esri Contributor

A highlighted summary of the 2022 User Conference Mining Activities.

Read more...

more
1 0 859
Lo-RuhamaWestbrook
Esri Contributor

Summary of the Mining Special Interest Group (SIG) from the UC Conference 2021. Including poll results recap. 

Read more...

more
4 0 1,330
SarahPowell1
Esri Contributor

https://www.esri.com/en-us/about/events/partner-conference/overview

Join us for the exclusive and now, a virtual event for partners and distributors. 

Read more...

more
0 0 1,144
by Anonymous User
Not applicable

The Mining User Group and Esri recently hosted a webinar on "Building a Web Mapping Platform".  In this webinar, we looked at publishing workflows from ArcGIS Pro and creating web maps and web-mapping applications. 

Rachel Micander and Lucia Patterson also presented on their work leveraging ArcGIS Open Data at their organizations.  You can view their different Open Data Sites using the below links and you can view their joint Nevada Mineral Explorer application here.

  1. Nevada Bureau of Mines and Geology Open Data
  2. Nevada Division of Minerals Open Data

Attached at the bottom of this post is the presentations slides from the webinar.  You can find a video recording of this webinar here: Building a Web Mapping Platform.

Below is a summary highlighting the applications and workflows that we looked at in the webinar.

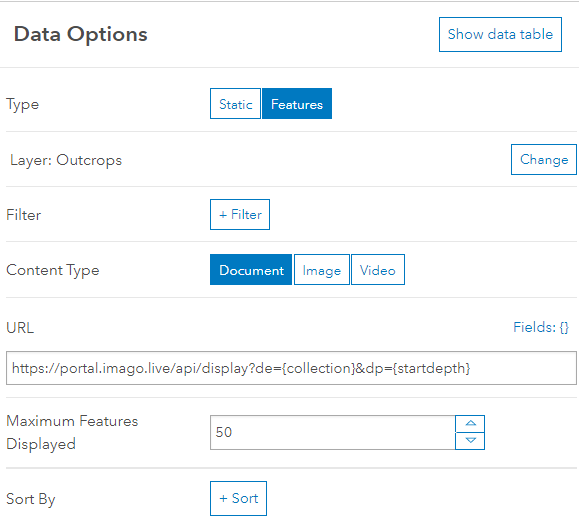
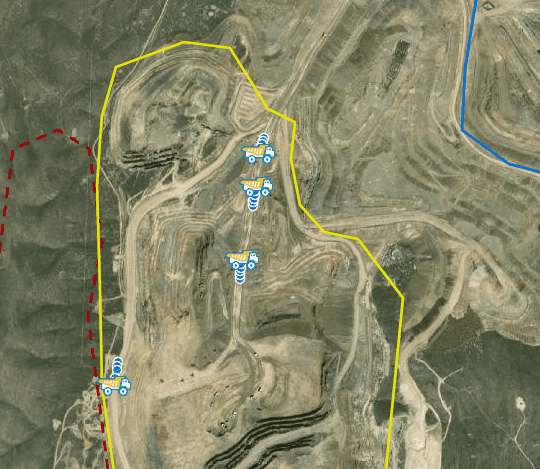
Pre-planned Offline Maps Areas for Explorer for ArcGIS

Offline Maps

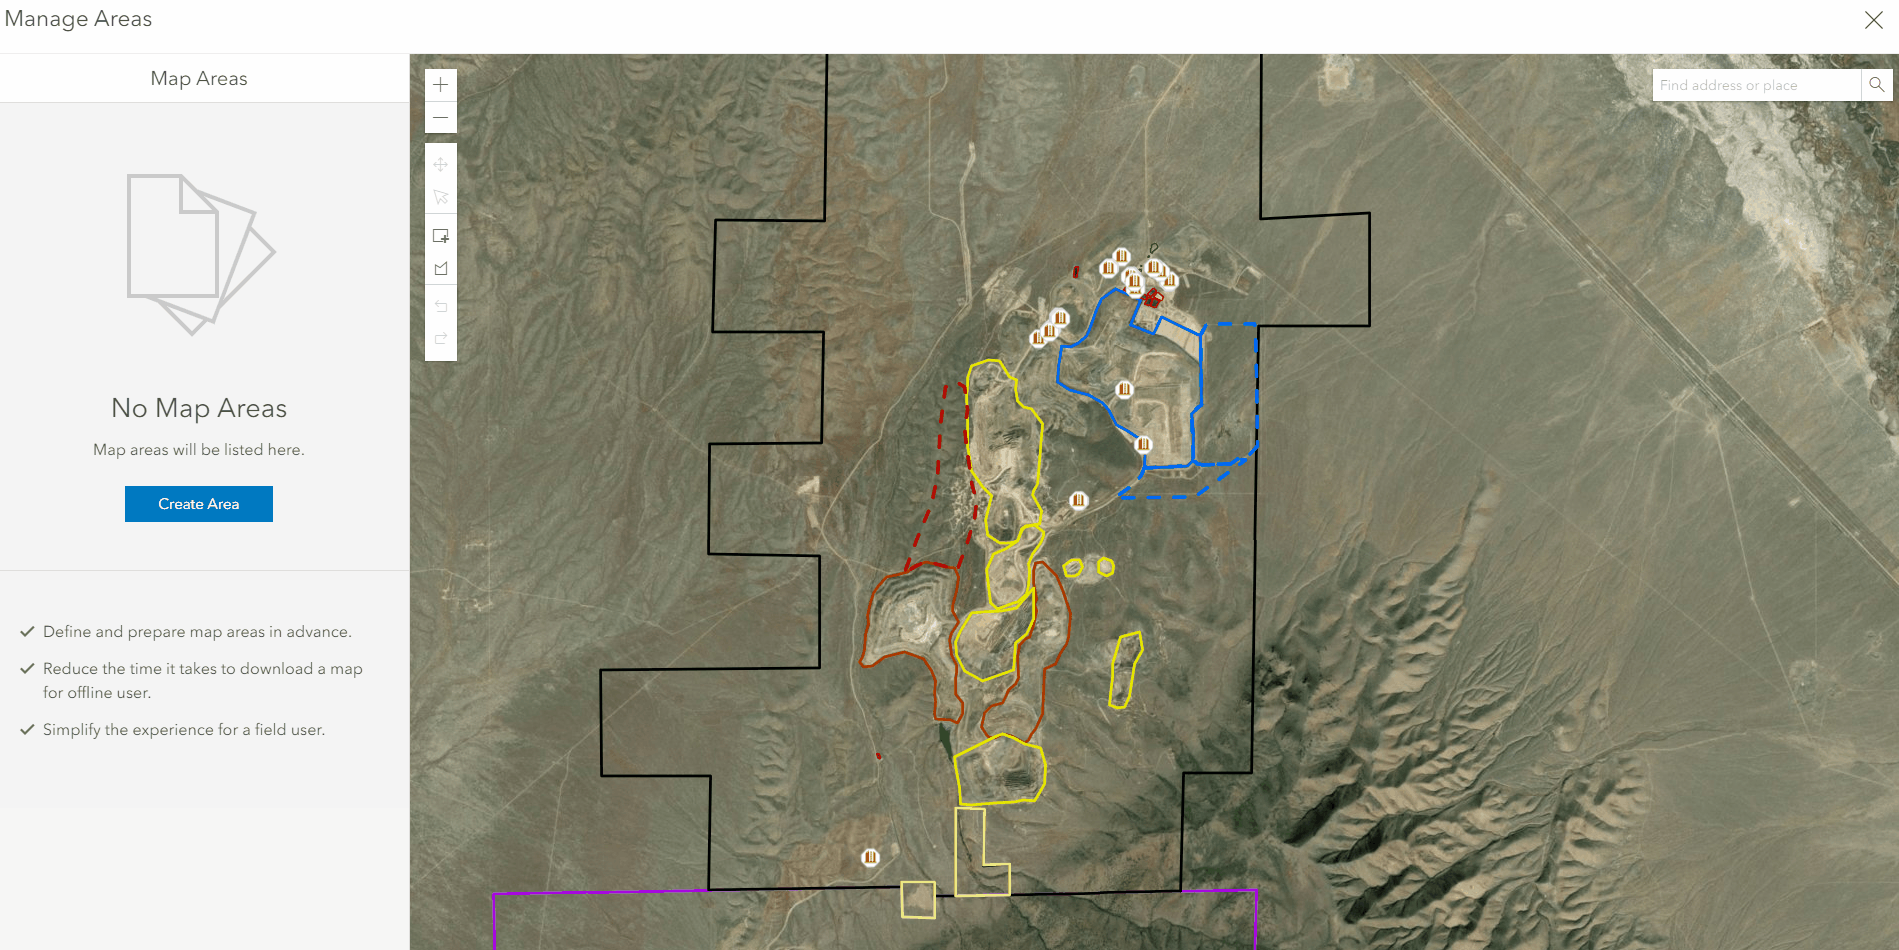
         You can now create offline map areas using a polygon outline.  These areas will create mobile map packages that users can download to their device and use in Explorer for ArcGIS.  By using a polygon outline, you can tightly conform to your area of interest, minimizing the file size.  You can also schedule these map packages to update on a regular interval, such as every day.  Now users will always have the most up to date offline map when they go into the field or mine. 

SPCC Inspections with Survey123

SPCC Inpsection Workflow

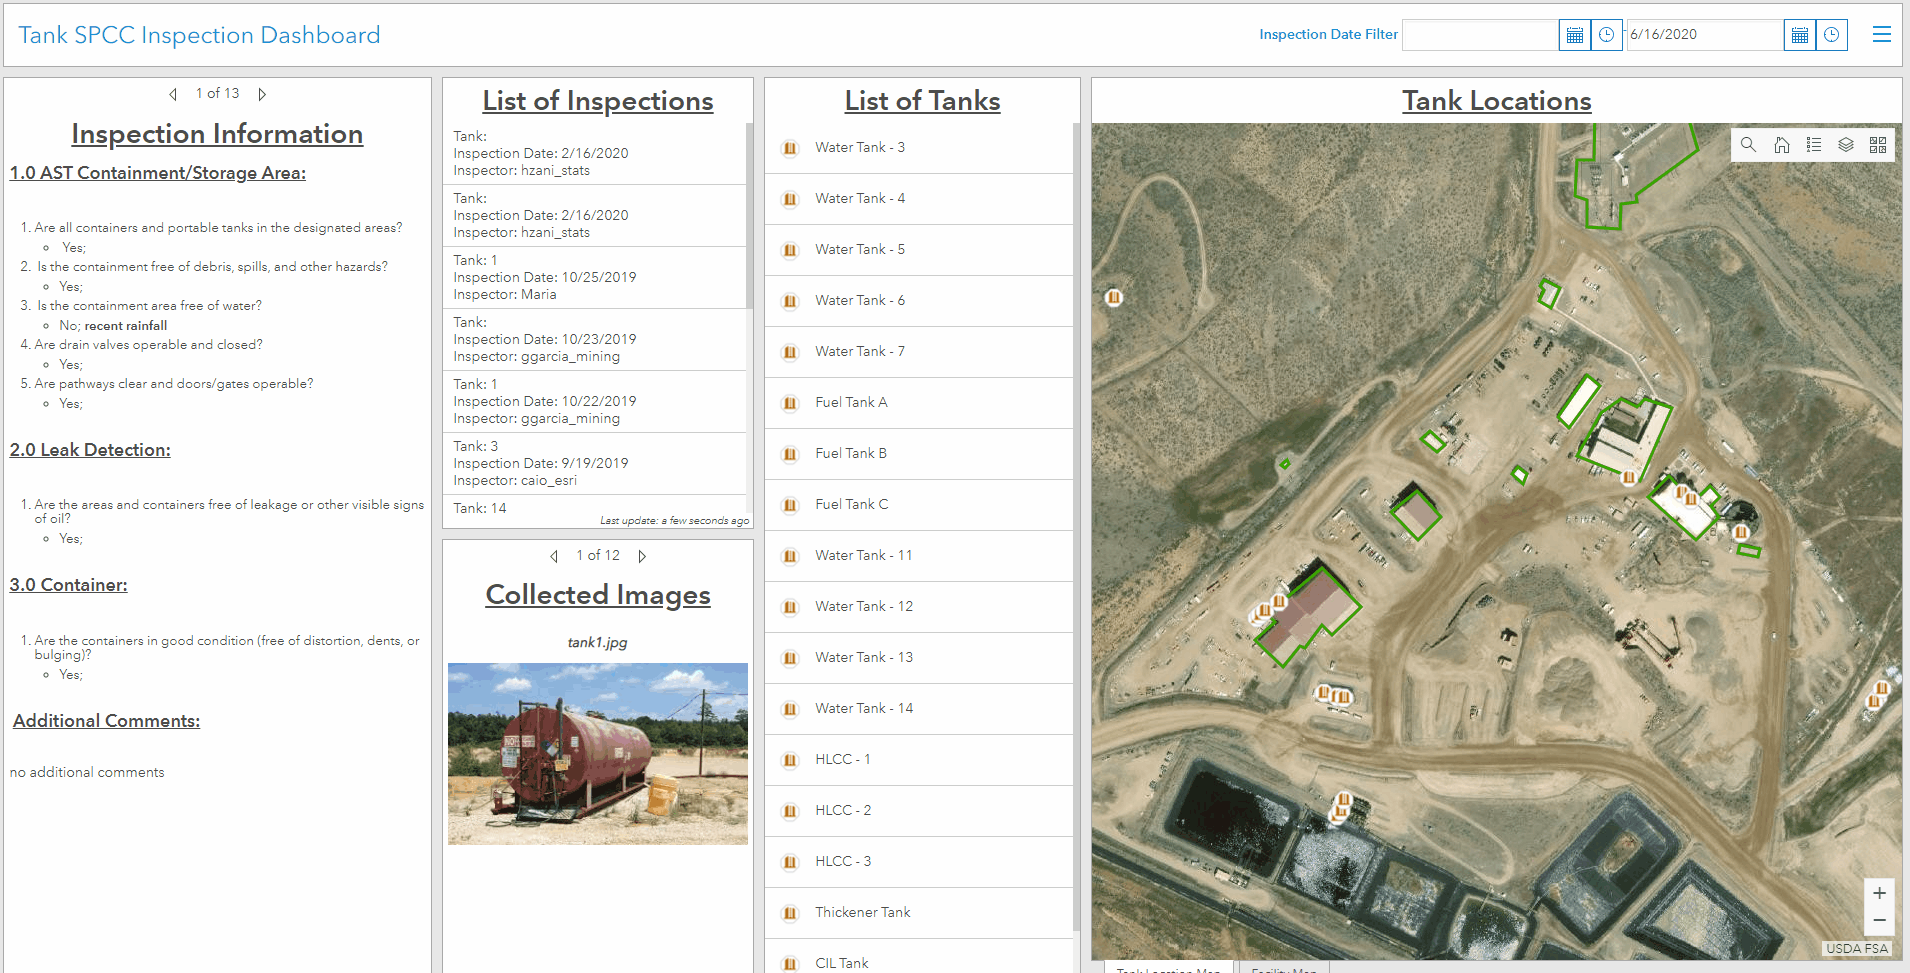
         Survey123 for ArcGIS can be used to transform pen and paper inspection workflows into digital workflows conducted using a phone or tablet.  For these Spill Prevention, Containment, and Countermeasure (SPCC) inspections, surveys are streamed directly into a dashboard where you can pan and zoom on the map and select a specific asset to see a history of all past inspections as well see the inspection details and any pictures that were captured.

Investor Relations with ArcGIS StoryMaps

Investor Relations

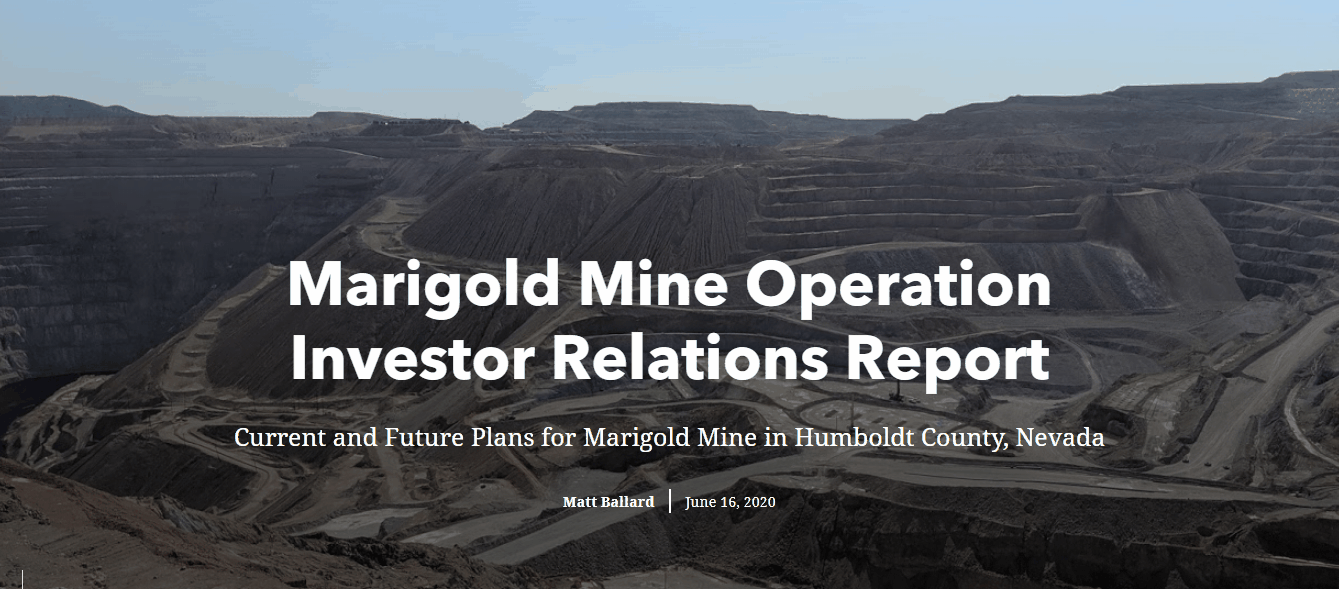
         ArcGIS StoryMaps add narratives to your web maps.  You can use them to create informative applications for investor relations, corporate communications, or for your public website maps.  In this example, we looked at a StoryMap that could be shared with investors to update them on the status of operations and exploration efforts.  You can share these dynamic interactive maps directly with investors, present with them at conferences, or embed them in your public websites.

3D and Imagery with Scene Viewer

3D Mine with Drone Imagery

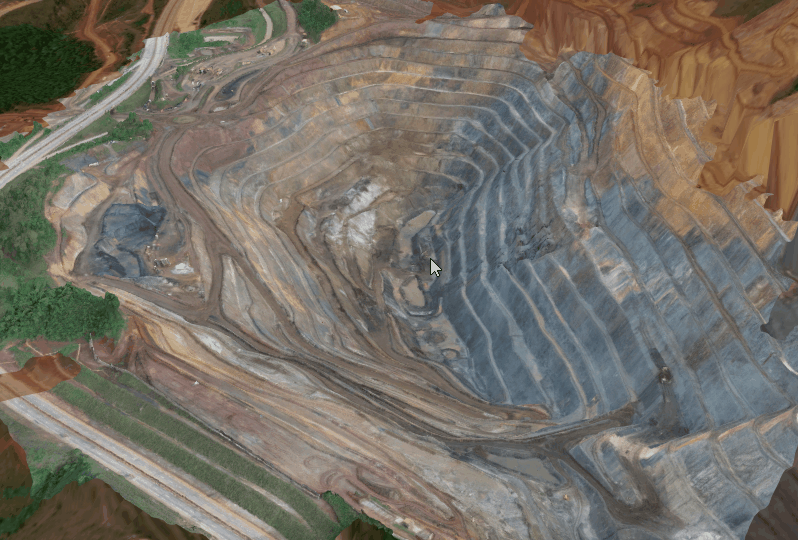
         ArcGIS supports 3D visualizations through the Scene Viewer.  Below is a surface model of an open-pit mine but 3D scenes can also include subsurface data like drill holes and geologic surfaces.  This data was generated using Site Scan for ArcGIS, which is Esri's new cloud-hosted drone imagery platform.  You can use drones to monitor the safety of haul roads, monitor slope stability in open-pit mines, and on tailings storage facilities. For more information, watch our previous webinar on this application.

Real-time Workflows with Analytics for IoT

         We looked at how you can integrate real-time data feeds into your ArcGIS Online maps.  To do this, we used ArcGIS Analytics for IoT, which is a new capability of ArcGIS Online.  The value of this is that you can incorporate many real-time data sources from disparate systems and integrate them into one central dashboard.  On top of that, you can perform real-time and big data analysis.

ArcGIS Hub for Tailored Web Experiences

ArcGIS Hub

        ArcGIS Hub allows you to created tailored web experiences for your end-users.  You can create a custom landing page for your GIS that integrates your corporate branding, most commonly accessed items, and more.  Each business unit or operating area can have its own custom page with the maps and apps that they need.  This will make your system easier to navigate and find exactly what users need.  You can do this with ArcGIS Enterprise Sites if you are using ArcGIS Enterprise.

more
1 0 4,150
by Anonymous User
Not applicable

Imago offers a platform for capturing and cataloging geoscientific imagery for outcrops, hand samples, cores, chips, and much more.  These all have a location and being able to visualize them on a map helps to gain a better understanding of your data.  Part of Imago’s platform is providing an API that you can use to access their imagery from other applications, such as an ArcGIS map.  By doing this, you can search for data geographically and add more reference data such as faults, claims, leases, geologic units, and more.

In this blog, I am going to show you how to access Imago images from an ArcGIS Dashboard (like the below image) so that you can dynamically select outcrops and collars on the map to view in Imago.

Sample Imago Dashboard

(View this dashboard)

First, it starts with creating data in ArcGIS Pro.  To do this, I had spreadsheets (attached to blog) for collars and outcrops which had latitude and longitude as well as a collection identifier field from the source data.  The collection ID field will be used to query the Imago API.  I used Excel to Table and XY Table to Point to plot the locations on a map in ArcGIS Pro.

Sample Excel Spreadsheet

I then applied symbology for the outcrops and collars and added additional data layers to give extra context.  With my map created, I shared it with my ArcGIS Online/ArcGIS Enterprise organization.  For more information on how to do this, see this tutorial: Share a web map.

ArcGIS Pro Map

For this application, I used ArcGIS Dashboards because of its ability to support embedded content such as websites.  To first create a dashboard, you can follow these instructions: create a dashboard.  When creating your dashboard, select the map you just published and continue with the below steps.

  1. Create an “Embedded Content” element

  2. For “Type”, choose “Features” and select either your outcrops or collars feature layer.

  3. In the “URL” section, construct a URL using the fields.  All of the URL’s have the same structure and contain two parameters, one for the collection identifier and one for the depth, which are both fields in our feature layer.  Here is a sample URL with the parameters highlighted: https://portal.imago.live/api/display?de=20180717&dp=3

    To build your URL, start with “https://portal.imago.live/api/display?de=” and then select from the field's drop-down the “collection” field.  Follow this with “&dp=” and finally the “start depth” field, or just the number “0” for collars, which do not have a depth.

    You can read more about this from this blog by Imago: Creating a URL Link to an Imago Image.
  4. At the bottom left, select “Done”.


  5. Hover over the top left of your map element and select “Configure”. Go to the “Layer Actions” tab, find your collars or outcrops layer, and choose “Add Action”, “Add Target”, and select your embedded content element.  Now when you select a feature on the map, the web page will update based on the feature you select.

You now have integrated ArcGIS and Imago!  There is much more you can build with ArcGIS Dashboards, if you are looking more resources, you can find some here:

more
1 1 3,447
by Anonymous User
Not applicable

The Mining User Group (MUG) and Esri recently hosted a webinar on "Driving Efficiencies for Mining - Exploring the Analysis Toolbox and Mining Workflows with ArcGIS Pro".  At this webinar, Chris Franks, MUG Chairman, and Pete Will, Esri Mining Account Manager, gave introductions.  We saw a demo on stockpile inventory management using ArcGIS Pro as well as a demo from Sara Deschamps of Seequent who showed us the soon to be released extension Target for ArcGIS Pro.  Thank you to the MUG for helping to organize this event.  Thank you as well to Sara and Seequent for participating in the webinar.

In the ArcGIS Pro demo, we looked at new tools such as 3D mensuration, new ModelBuilder enhancements (create from geoprocessing history and export to Python), spell check, and much more.  You can find a list of enhancements to ArcGIS Pro 2.4 and other versions here: What's new in ArcGIS Pro.  You can find the roadmap for future releases of ArcGIS Pro here: ArcGIS Pro Roadmap

A recording of the webinar has been made available on YouTube.  At the end we held a Q&A session.  A list of all questions that were asked have been attached to this blog post.  Also attached is an ArcGIS Pro Task file that was used in the first demonstration.

More webinars are planned to come in the near future, look out for more information here, through email, and on the MUG LinkedIn group which you can join.  The next webinar will be focused on mobile workflows.  If you have an idea for a webinar, please share with us in the comments below or reach out directly.

more
4 0 1,795
ValerieCoffin
Esri Contributor

Just over a month ago, we opened the door to a new tool that provides the Mining industry with immeasurable amounts of information and technical support for ArcGIS at all levels of the platform. 

Got a question? Send it to our technical staff by placing it right into the question area on the right-hand side of the home page or on the Content tab.

Looking for a more involved discussion about industry-specific challenges? Start a discussion with the other mining users on the page. Or check out conversations others have already started - you may just find what you're looking for!

You can also find our educational webinars and links to the Esri Mining page right here on GeoNet! 

Need information on specific products? You can find just about everything you need by searching GeoNet. Here's just a few I think you might like:

This Space was designed with you, our users, in mind and we invite you to make it yours through comments, asking questions and suggesting additional content. 

more
0 0 838
GeoffWade
Esri Contributor

The 2018 UC is just around the corner and we are excited to welcome many active members of the Esri Mining GIS community. Throughout the UC week, users from different disciplines and all over the world, will come together to discuss What’s Next in GIS, the theme of the conference.

To kick things off, Esri President and Founder, Jack Dangermond, brings inspiration to the stage and takes the audience on a journey through GIS capability and applicability - through demonstrations by Esri staff and featured guest presenters; such as J.D. Irving’s integrated forestry supply chain, the City of Boston’s urban planning, and James & Deborah Fallows 100,000-mile journey into the heart of America. In the afternoon we are honored to host Juan Enriquez, recognized as one of the world’s leading authorities on the economic and political impacts of life sciences, as he explores of the intersection of how we design our places and ourselves.

Then, throughout the week, attendees can choose from over 1,000 technical and user presentations, learn and expand their knowledge of ArcGIS capabilities with more than 450 hours of offered training, interact with over 300 exhibitors, and network and share ideas within an integrated GIS community that spans the globe. Whether you are attending this year’s conference for the first time or the 20th, you can find a wealth of knowledge to some on the most challenging GIS questions, direct from Jack and senior Esri leadership, on the User Conference Q&A web page. 

As a member of the Mining GIS Community, we have sessions customized around workflows important to you, a special interest group meeting for you to collaborate with your peers, maps designed to share stories, and an evening social for you to network with your peers.

We look forward to seeing everyone next week.

Safe travels,

Geoff Wade

Esri - Mining Community Liaison.

more
2 0 674
60 Subscribers