- Home
- :
- All Communities
- :
- Products
- :
- Mapping
- :
- Mapping Questions
- :
- slope percent symbology
- Subscribe to RSS Feed
- Mark Topic as New
- Mark Topic as Read
- Float this Topic for Current User
- Bookmark
- Subscribe
- Mute
- Printer Friendly Page
- Mark as New
- Bookmark
- Subscribe
- Mute
- Subscribe to RSS Feed
- Permalink
I might be over thinking this but how do I get my slope, created using percent_rise output, to classify by the actual %?
The way I understand using the Classified Symbology it classifies by the percentile of my values range for the raster, NOT the percent slope. So how do I get it to symbolize by the actual percent rise value?
Solved! Go to Solution.
Accepted Solutions
- Mark as New
- Bookmark
- Subscribe
- Mute
- Subscribe to RSS Feed
- Permalink
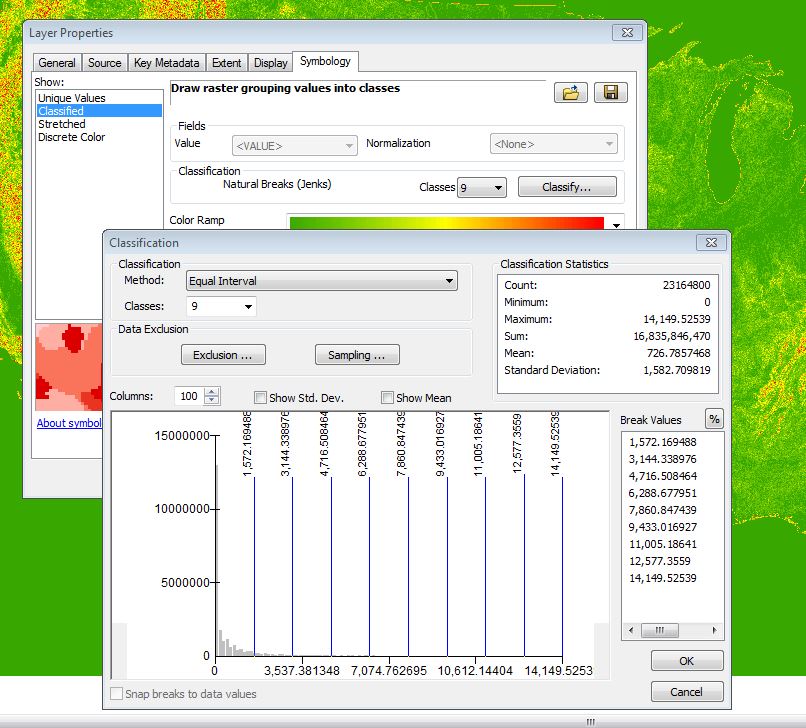
I think if you play with the Symbology settings you can define it the way you want. in the Layer Properties window, click on the Classify button. This will bring up the Classification window. In this Window try altering the Classification and see which method produces what you want. I suspect in your case it will be "Equal Interval". Another option is to choose "Defined Interval" and then type in manually the break values you want in the "Break Values" pane in the lower right.
Chris Donohue, GISP
- Mark as New
- Bookmark
- Subscribe
- Mute
- Subscribe to RSS Feed
- Permalink
I think I was just over thinking it. The reason is because the slope raster does not match up with the topo that was generated using the same raster and I don't know why.
- Mark as New
- Bookmark
- Subscribe
- Mute
- Subscribe to RSS Feed
- Permalink
What do you mean by "not matching up?"
Is this a situation where the extent is set from another dataset or the current display extent without a snap raster specified?
- Mark as New
- Bookmark
- Subscribe
- Mute
- Subscribe to RSS Feed
- Permalink
No the extent was good, the results were ok but you could see it was missing a lot for the range I wanted of steep slopes. When looking at and calculating the slope from the contours and comparing that to the slope calculated using the tool it did not match up. I figured out that the Raster cells were just too big (30m), I got the cell size down to 3m and the results were a lot better.
- Mark as New
- Bookmark
- Subscribe
- Mute
- Subscribe to RSS Feed
- Permalink
Yes, it is important to make sure the environment is doing what you want. Setting the cell size and snap raster can be critical to get correct results, as you discovered.
- Mark as New
- Bookmark
- Subscribe
- Mute
- Subscribe to RSS Feed
- Permalink
Jumping into this conversation here.
Your project may be over now, but...I would suggest checking your sampling technique and pyramids. Both should be set to bilinear or cubic for continuous data like elevation, slope, etc. The nearest neighbor sampling can be used for nominal raster datasets like landcover.
This typically messes with how my data is displayed.