- Home
- :
- All Communities
- :
- Products
- :
- Mapping
- :
- Mapping Questions
- :
- Automate Export of Multiple Map Images by Column
- Subscribe to RSS Feed
- Mark Topic as New
- Mark Topic as Read
- Float this Topic for Current User
- Bookmark
- Subscribe
- Mute
- Printer Friendly Page
Automate Export of Multiple Map Images by Column
- Mark as New
- Bookmark
- Subscribe
- Mute
- Subscribe to RSS Feed
- Permalink
- Report Inappropriate Content
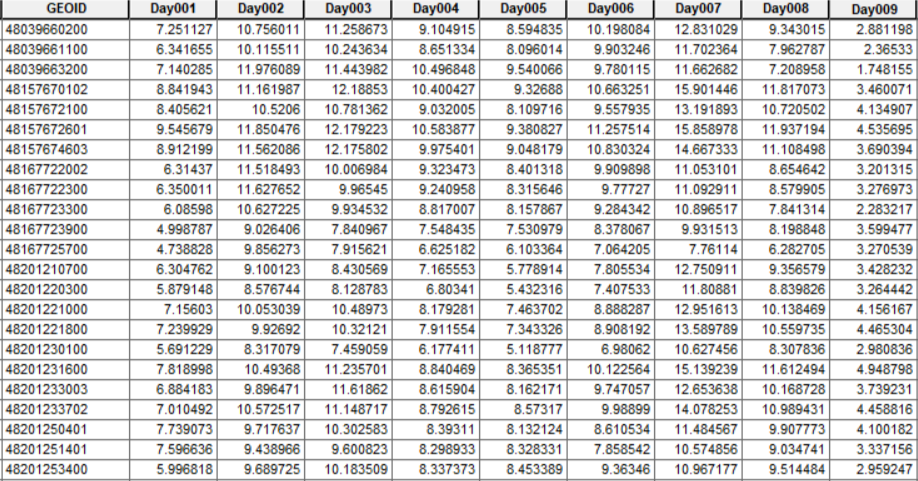
Hello, I'm looking for guidance on how to automatically export multiple layouts as png or jpg images based upon a pre-configured layout that I manually set up (symbology, scale, scale bar, north arrow, etc.). I have a dataset that has 365 columns of daily measurements in a full calendar year (1 Jan - 31 Dec). My ultimate goal is to create an animated gif map of these values over time. I would like to export a consistently-themed layout for each day as jpg or png so I can create this gif. An example image of part of my dataset is below.
Question #1: Anyone know how to automatically export 365 daily jpg/png files from this?
Question #2 (bonus question): Any tips on how I can automatically add a custom annotation header to each jpg/png file? I would like the calendar date to be annotated at the top of each image (for example, the map image for column Day001 would have an image heading "January 1", and so on....).
TIA!
#python #automate #export #layout
- Mark as New
- Bookmark
- Subscribe
- Mute
- Subscribe to RSS Feed
- Permalink
- Report Inappropriate Content
Hi,
You could certainly do this with Data Driven pages though you may have to alter the format of your data.
I believe the animations toolbar might also be able to record this.