- Home
- :
- All Communities
- :
- Learning
- :
- ArcGIS Tutorials
- :
- ArcGIS Tutorials Blog
- :
- What's new in Learn ArcGIS July 2020
What's new in Learn ArcGIS July 2020
- Subscribe to RSS Feed
- Mark as New
- Mark as Read
- Bookmark
- Subscribe
- Printer Friendly Page
- Report Inappropriate Content
Teach with GIS Beta Website
 The Learn ArcGIS Team unveiled a beta website, Teach with GIS, at the User Conference. The site is aimed at K-12 educators who want to include GIS in their teaching. The site includes videos of educators sharing why they include GIS technology in social studies and STEM lessons. There are also a dozen ready-to-use hands-on apps and stories that students can explore in the classroom or at-home.
New Learn Paths
A Learn Path is sequenced set of resources for learning about a particular topic. Here's a roundup of new paths in the Learn ArcGIS Gallery that have appeared in the last month.
Teach with ArcGIS Notebooks
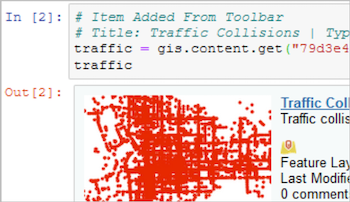
Use ArcGIS Notebooks as a teaching tool, from delivering class assignments to presenting analysis as a slideshow. This path is aimed at educators who want to include ArcGIS Notebooks in their teaching.
New Learn Lessons
A Learn Lesson is a step-by-step tutorial that uses a real-world scenario to introduce key ArcGIS tools and workflows. Here's a roundup of new lessons in the Learn ArcGIS Gallery that have appeared in the last month.
Find, inspect, and replace guardrail end treatments in ArcGIS Online
Find, inspect, and replace guardrail end treatments in ArcGIS Enterprise
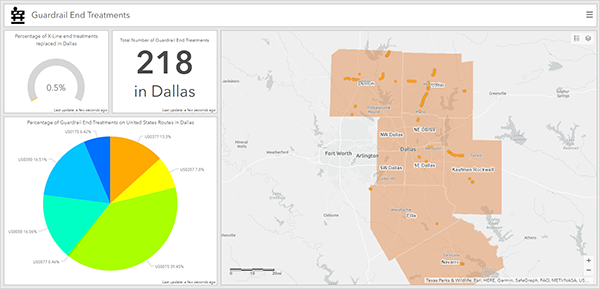
The Texas Department of Transportation (TxDOT) recently published information about a statewide operation to replace a certain type of guardrail end treatment that has caused multiple deaths. In this lesson, you'll manage multiple stages of this operation, including data collection, guardrail inspections, and recording the replacements.
First, you'll create a feature layer in ArcGIS Online to contain the data. Then, you'll use ArcGIS QuickCapture, Collector for ArcGIS, and Survey123 for ArcGIS to complete the operation. Last, you'll display the results in ArcGIS Dashboards.
Identify retail gaps with void analysis
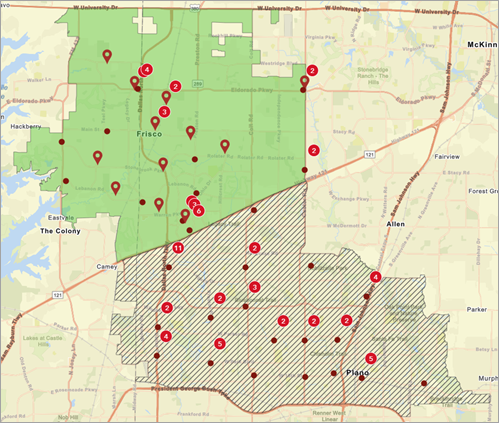 As demand for healthy foods and beverages grows, power juices and smoothies increase in popularity. A successful juice bar chain in Frisco, Texas, wants to expand to neighboring cities in Collin County. But does the area already have similar businesses that may reduce demand, or is there a gap that the juice bar can fill? To answer these questions, you'll perform void analysis in ArcGIS Business Analyst Web App.
Void analysis identifies gaps in specific businesses and services in one area compared to a similar area. You'll use it to compare Frisco to a neighboring city and find out if that city has a gap in juice bar businesses that the chain can fill by opening a new location. While this workflow uses void analysis for retail, void analysis can also be used for services, real estate, and business networks.
Use species distribution patterns to assess protected areas (ArcGIS Online)
 Species diversity is the foundation of a healthy planet. The leading cause of species extinction is habitat loss. Protecting species requires protecting enough suitable habitat for species to live, thrive, and fulfill their ecological function.
The Half-Earth Project is working to conserve half the Earth's land and sea in order to protect enough habitat for 85% or more of Earth's species. The Half-Earth Project is mapping the location of species, protected areas, and human activities, and using this information to identify the best places to protect the most species. GIS is at the core of determining which half of the Earth to protect. This Learn Lesson introduces some of the mapping methods the Half-Earth Project team deploys, and how these methods lead to identifying conservation priorities.
The two fundamental considerations for examining biodiversity in any area are:
- Species Richness - the total numbers of species in that area
- Species Rarity - based on the number of species found only in that area
In this learn lesson, you will focus on protected areas and species information on the rarity of birds to understand and map how countries are protecting bird species with the highest rarity. This lesson focuses on the continent of Africa, though the analysis can be replicated for other locations.
Use multidimensional data to predict coral-bleaching events (ArcGIS Pro and ArcGIS Image Analyst extension for ArcGIS Pro)
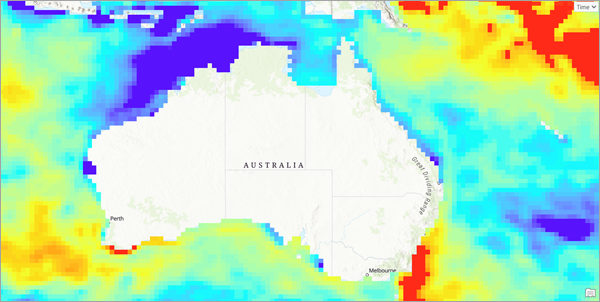 Coral reefs serve as a significant repository of marine biodiversity and are home to about 25 percent of marine species. Thus, the health and long-term success of these reefs are critical in maintaining our marine ecosystems. Unfortunately, reefs worldwide face many risks, primarily due to climate change. These include ocean temperatures that are too warm for coral survival, which may result in coral bleaching. In this lesson, you will use several years of daily sea surface temperature data to create a model that employs time-series forecasting capabilities to explore the impact of sea surface temperature on coral bleaching. Using model results, you will predict and identify locations showing anomalously high water temperatures. This will allow you to predict areas that are likely to be vulnerable to coral bleaching.
Explore Paris with ArcGIS Online
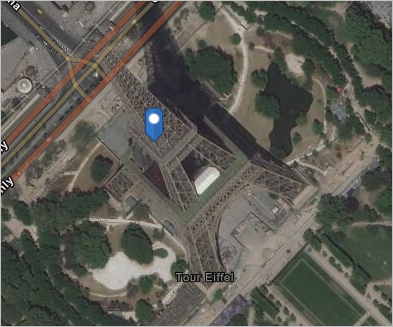 In this lesson, you'll create a map of Paris, France, to learn the basics of working with maps in ArcGIS Online. Learn how to navigate, create, and save a map. Search for and mark locations, change the basemap, and add new layers.
You must be a registered user to add a comment. If you've already registered, sign in. Otherwise, register and sign in.