- Home
- :
- All Communities
- :
- Services
- :
- Implementing ArcGIS
- :
- Implementing ArcGIS Questions
- :
- Is there a location which tells me how to format m...
- Subscribe to RSS Feed
- Mark Topic as New
- Mark Topic as Read
- Float this Topic for Current User
- Bookmark
- Subscribe
- Mute
- Printer Friendly Page
Is there a location which tells me how to format my data for specific analysis tools?
- Mark as New
- Bookmark
- Subscribe
- Mute
- Subscribe to RSS Feed
- Permalink
I read about the tools and its great, then I try to run it with my data and I get empty outputs etc. Can anyone offer advice?
Thanks,
Abby
- Mark as New
- Bookmark
- Subscribe
- Mute
- Subscribe to RSS Feed
- Permalink
Can you provide an example. It is pretty hard to provide advice beyond simple things like file paths and names
- Mark as New
- Bookmark
- Subscribe
- Mute
- Subscribe to RSS Feed
- Permalink
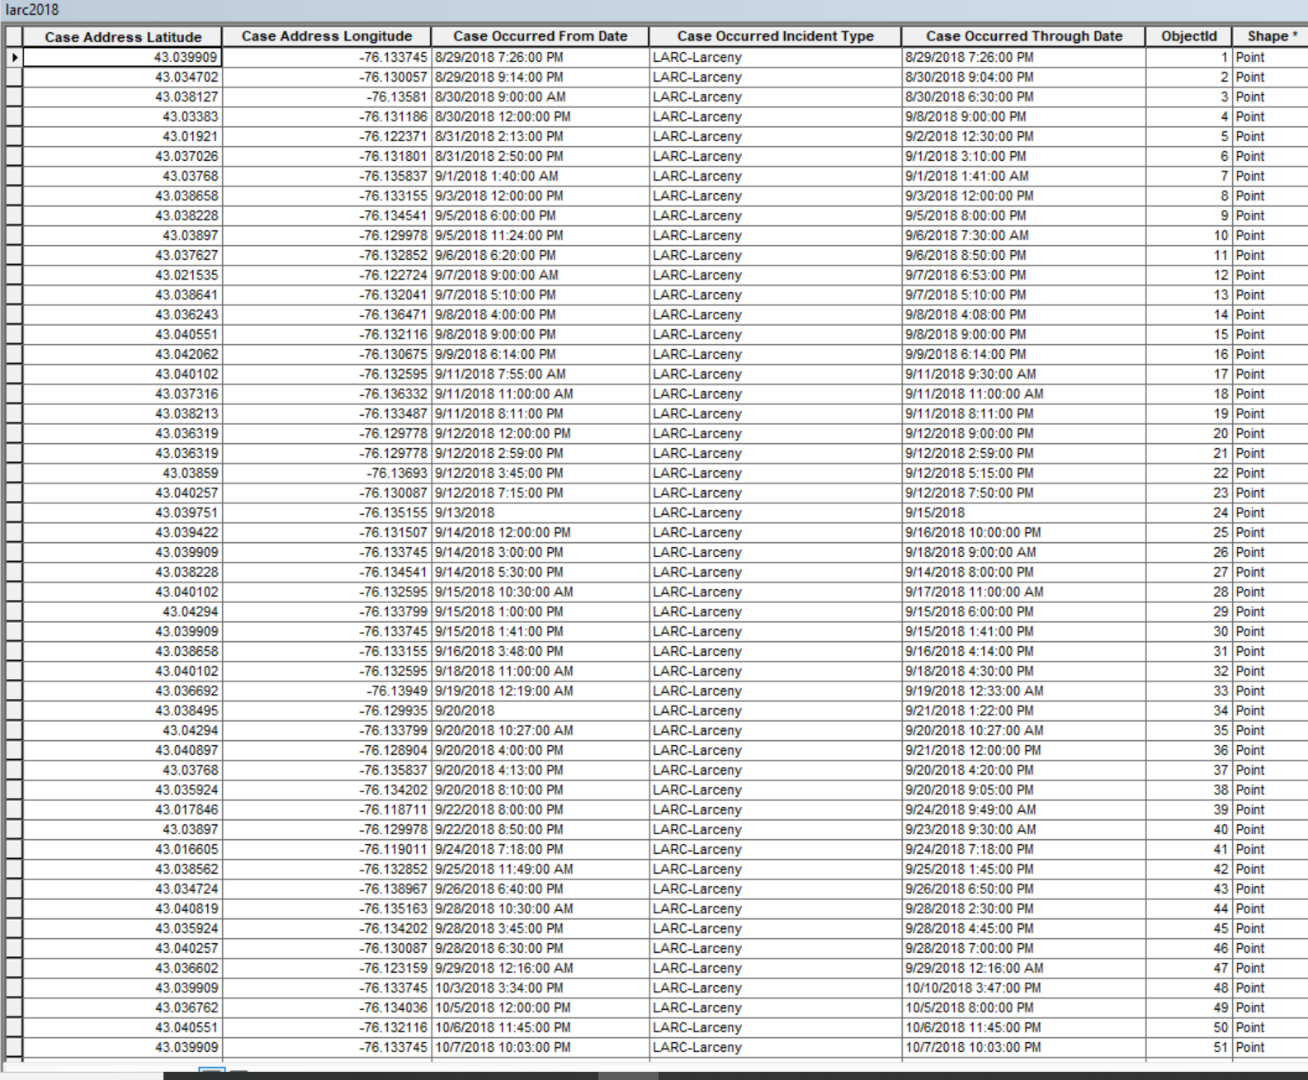
Hi Dan. Thank you for replying. An example is optimized hot spot analysis. I input a point feature data set and it outputs a fishnet polygon with only a single value. I have tried going into the symbology layer and playing around (using the GiP, Gi_Bin, or Gi_Z values as the value fields), however, nothing seems to work. I have defined a boundary polygon so all cells within the study area can be evaluated and to avoid getting a probability of 0 where there is a probability, but still nothing. I have used the kernel density tool and that works so I know the data is not flawed or anything. I have included an image of the format I have used. I should also note I add it as a data layer which I create using ArcGIS for Developers or the Catalog. Is that the issue?
Thank you,
Abby
- Mark as New
- Bookmark
- Subscribe
- Mute
- Subscribe to RSS Feed
- Permalink
Abby, you need to make an 'Event' layer
Make XY Event Layer—Data Management toolbox | ArcGIS Desktop
from the longitude (X) and latitude (Y) data,
Then save it to a file geodatabase (Copy Features or equivalent)
During the process, make sure that you define the coordinate system as a GCS-NAD83 or -WGS84 as appropriate for the data (Define Projection tool)
If you then need to get it into another coordinate system to match your polygons, then you need to use the Project tool
All during this process, avoid file paths that contain spaces or other non-text characters, and use a real folder on a real drive.