- Home
- :
- All Communities
- :
- Services
- :
- Implementing ArcGIS
- :
- Implementing ArcGIS Blog
- :
- Using ArcGIS Monitor Excel Report in System Design
Using ArcGIS Monitor Excel Report in System Design
- Subscribe to RSS Feed
- Mark as New
- Mark as Read
- Bookmark
- Subscribe
- Printer Friendly Page
- Report Inappropriate Content
Introduction
ArcGIS Monitor is designed to help you analyze and optimize the health of your ArcGIS implementation throughout the life cycle of your enterprise GIS. ArcGIS Monitor maximizes your GIS investment by providing timely and insightful system metrics on the status, availability, usage, system performance, and resource usage of your enterprise GIS. Alerts and analysis tools provide system administrators with real-time notifications to facilitate rapid resolution when measurements are outside defined system thresholds. Reports with statistics can be used to visualize historical data and enhance communications among GIS, IT, business owners, and senior management.
The ArcGIS Monitor Server application allows you to configure and export reports for your collections as Microsoft Excel (.xlsx) files. The ArcGIS Monitor Excel Report provides overall, dashboard-like view of your monitored GIS deployment, all in a single Excel file with the ease to navigate, sort and filter the data in a simple way.
For information about configuring and running the tool, please refer to ArcGIS Monitor documentation.
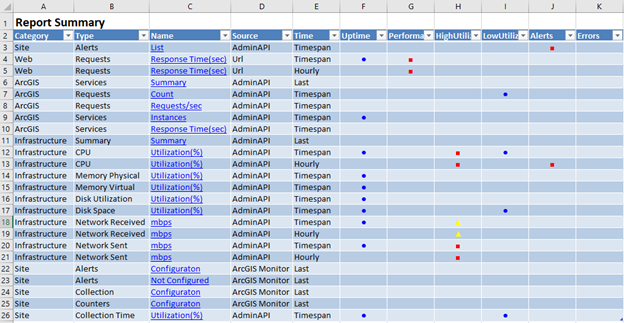
The Report Summary provides a view of all configured categories, e.g. Web, ArcGIS, Infrastructure and Site, Counter Type and Name, e.g. Web Requests Response Time, ArcGIS Services Summary, etc. You can navigate from this page to view counter details page by clicking on the desired link under the Name column.
Glossary of Report Summary page indications:
■ Indicates to investigate high utilization/load.
▲ Indicates to investigate sporadic utilization spikes.
● Indicates low utilization.
Configure and export reports
When you configure how to export the report, it is important to filter the report time span so it will include only busy time days and hours, for example, if the system is used mainly during business hours you should exclude Saturday and Sunday in Set Working Days and choose only business hours (e.g. 9 AM to 5 PM) in Set Working Days. For the purpose of system design, peak time usage and utilization is much more important than total usage.
Information Objectives for System Design
The Esri system design practice focuses on planning the hardware, software, and network characteristics for the future state of systems based on new or changing requirements.
The current health of an existing system will not necessarily have a strong relationship to a future system that has different requirements. However, depending on the design objectives, information about the current system can be relevant.
For example, in the case of a planned migration from an on-premises system to a cloud platform, it would be quite useful to describe the current system such that it can be faithfully rendered on a cloud platform. Or, capacity requirements driving a design may be derived from current system state, e.g. current services inventory, current system throughput, current resources utilization, plus the anticipated services and user growth over a defined term, e.g. two years.
Machine Resources and Utilization
It can be useful for system design to understand the current machine resources that support the system. For example, if you are migrating a system to a cloud platform, the number of processor cores that the system has on premises has some relevance to the number you might deploy on the cloud.
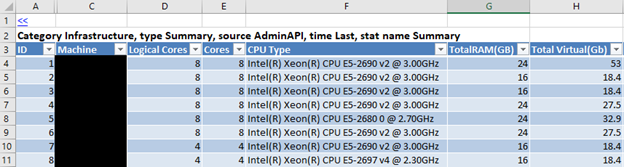
Machines
Clicking on the Infrastructure Summary link in the Report Overview will lead you to the Infrastructure Summary details page. The page will list all monitored machines, with the following details:
- Logical cores count
- Physical cores count
- Processor type
- Total RAM
- Virtual memory
Machines Utilization
The characteristics of the machines, and the configuration of the instances, offers incomplete insight into the degree to which machines resources are utilized and what resources are truly needed for the current workload, as a baseline for your system design.
Statistics Fields in Machines Utilization
Field | Definition |
Min | Minimum percent utilization |
Avg | Average percent utilization |
P5, P25, P50, P75 | The percentile grouping of resource utilization |
P95 | The ninety-fifth percentile. Ninety-five percent of the time resource utilization value is lower than this value |
P99 | The ninety-ninth percentile. Ninety-nine percent of the time resource utilization value is lower than this value |
Max | Maximum percent utilization |
CPU
Clicking on the Infrastructure CPU Utilization link in the Report Overview will lead you to the CPU utilization details page. The page will list all monitored machines, with CPU utilization statistics.
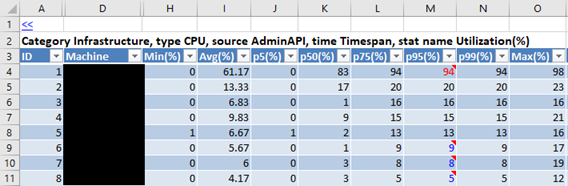
We're going to focus on the P95 percentile. As we learned above, P95 signifies the CPU utilization for the top 5% busiest time. When P95 CPU utilization exceeds 90% it suggests that the machine is overloaded. In this case you should plan how to reduce the load on the machine by distributing the load or by adding more resources. This page will also help you to identify candidate machines with high CPU utilization, even if it’s below 90%, that might require additional resources or load distribution due to the anticipated user growth in your system design.
Current machines CPU utilization can also help you in validating your capacity calculations by comparing capacity calculation results for current usage with actual CPU utilization statistics in order to validate your capacity models before calculating capacity for the anticipated user growth.
Memory
Clicking on the Infrastructure Memory Physical Utilization link in the Report Overview will lead you to the physical memory utilization details page. The page will list all monitored machines, with memory utilization statistics.
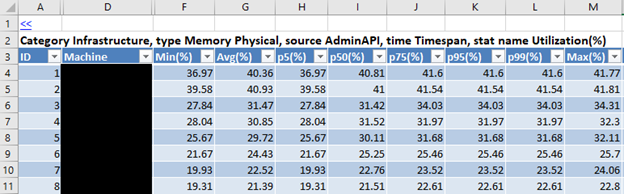
For ArcGIS Enterprise system with default services configuration we would usually expect to see small changes in memory utilization, with some exceptions, e.g. geoprocessing services, services configured with higher number of max instances, etc. As with CPU utilization, we're going to focus on the P95 percentile. When P95 memory utilization exceeds 80% it suggests that the machine requires more memory. In this case you should plan how to reduce memory pressure on the machine. There are different ways to do that depending on the machine role, for example:
- Portal – add more memory to the machine
- Hosting Server - add more memory to the machine or add more machines to the site
- Federated Server – use shared instances for less used map/feature services, add more memory to the machine, add more machines to the site, distribute services between sites (workload separation)
This page will also help you to identify candidate machines with high memory utilization, even if it’s below 80%, that might require you to plan for memory pressure alleviation due to the anticipated growth in usage or in the number of services in your system design.
Disk
Disk Utilization can help you identify current machines with potentially slow I/O and if storage upgrades are required.
Disk Space can give you the baseline for disk size requirements for the machines (i.e. not including shared storage) in your system design and identify if disk size has to be increased on existing machines if available disk space is low.
Network
Network Utilization can give you the baseline of current network usage for your system design.
Process
I recommend configuring Process counters in ArcGIS Monitor to monitor ArcSOC processes in federated ArcGIS Server machines.
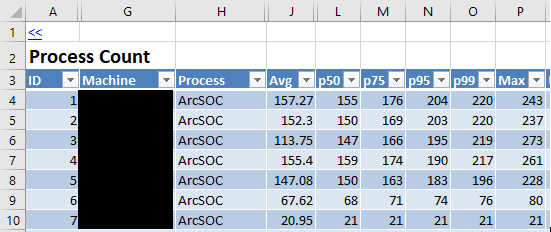
Infrastructure Process Count page provides number of total ArcSOC process running on the machine, i.e. the number of service instances. This will help to identify ArcGIS Server usage patterns – is number of service instances steady or volatile? Does the number of service instances during peak time exceed 200? If so, it can threaten the stability of the site, and action must be taken:
1. Tune services and reduce number max instances per service. ArcGIS Services Requests/sec and Instances information (details below) can help with tuning services with the right number of instances.
2. Configure less used map and feature services to use shared instances. ArcGIS Services Count and Requests/sec (details below) can help with identifying candidate services for shared instances configuration.
3. Configure Windows registry to allow more service instances (See this technical article for more information and specific steps: https://support.esri.com/technical-article/000001218)
Process count can also provide baseline for number of services in your system design, to prepare for anticipated growth in number of services and plan services configuration.
ArcGIS Services
It can be useful for system design to understand the current ArcGIS Server services inventory, usage and performance.
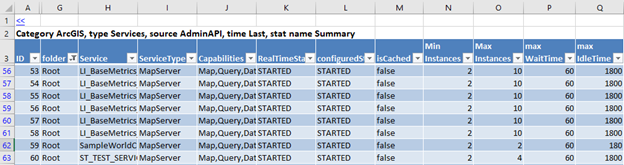
ArcGIS Services Summary
ArcGIS Services Summary provides ArcGIS Server services inventory including services configuration, e.g. started/stopped, types of services, etc., as a baseline for services configuration in your system design.
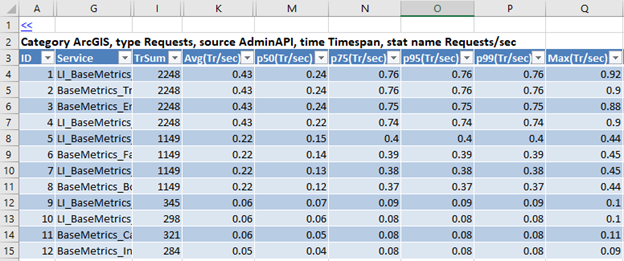
ArcGIS Services Count and Requests per Second
ArcGIS Services Count and Requests per Second provides baseline of current system throughput for your system design, as well as ArcGIS Server services usage information, e.g. most used services, less used services and unused services, for designing services configuration and help tuning services.
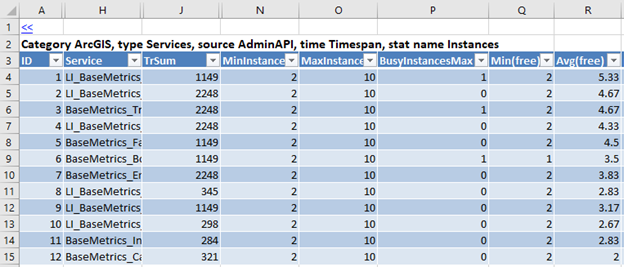
ArcGIS Services Instances
ArcGIS Services Instances information is not important for system design but can help with tuning services, e.g. number of min and max service instances for federated services.
ArcGIS Services Response Time
ArcGIS Services Response Time information can be used for capacity planning in your system design, if you are creating custom workflows in the capacity planner.
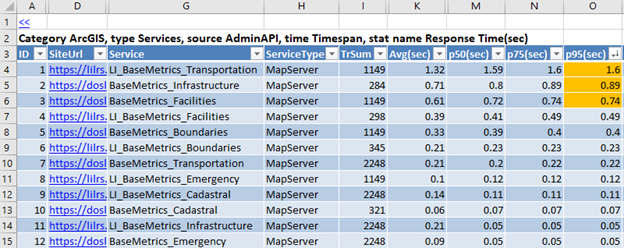
This information can also be used for optimizing current system by identifying slow-performing services. In the example above, I’ve sorted P95 elapsed time from largest to smallest, and highlighted any elapsed time over 1/2 second in orange. These are the services and layers I'd focus on optimizing, getting the P95 value below 1/2 second if possible.
Note: The contents presented above are recommendations that will typically improve performance for many scenarios. However, in some cases, these recommendations may not produce better performance results, in which case, additional performance testing and system configuration modifications may be needed.
I hope you find this helpful, do not hesitate to post your questions here: ArcGIS Architecture Series: Tools of an Architect