- Home
- :
- All Communities
- :
- Products
- :
- Imagery and Remote Sensing
- :
- Imagery Questions
- :
- GIS Project - Rice grass rate of spread analysis
- Subscribe to RSS Feed
- Mark Topic as New
- Mark Topic as Read
- Float this Topic for Current User
- Bookmark
- Subscribe
- Mute
- Printer Friendly Page
GIS Project - Rice grass rate of spread analysis
- Mark as New
- Bookmark
- Subscribe
- Mute
- Subscribe to RSS Feed
- Permalink
- Report Inappropriate Content
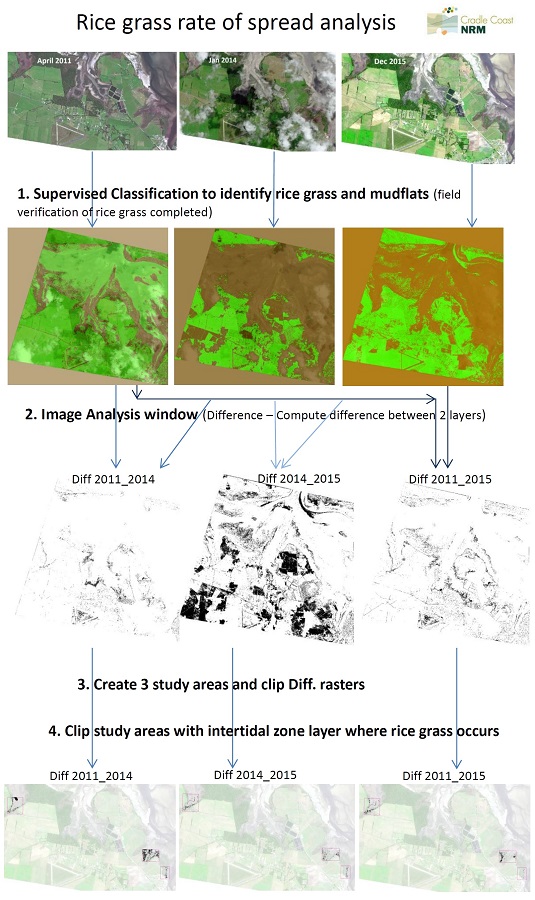
I am not sure if you have heard of the invasive estuarine weed rice grass (spartina anglica), but it has an unique spectral signature even in the RGB colour bands and I am using this to map rice grass and determine its rate of spread (hectares per year) in far North West Tasmania, Australia.
I have been provided with 3 datasets; April 2011, Jan 2014 and Dec 2015 and have so far managed to undertake this workflow in ArcMap;
- Supervised classification to identify rice grass and mudflats (field verification completed);
- Using the Image Analysis Window, compute the different between 2011 and 2014, 2014 and 2015 and 2011 and 2015;
- Create 3 study areas to reduce analysis times and which are rice grass only sites;
- Clip study areas within intertidal zone layer as this is where rice grass occurs;
- Currently 3 raster datasets outputs; Diff_2011_2014, Diff_2014_2015 and Diff_2011_2015.
Current Workflow
I am not sure of the next steps to take for analysis and am aware of some errors still in the data. Should I convert the above raster data sets to vector polygons and then I can manually edit and remove the errors? Or should I continue process in raster? Do I need to normalise the 3 data sets? Any suggestions are welcomed.
There is the project webmap in you are interested; map.
Thanks for your time and I look forward to your answer,
Mark.
- Mark as New
- Bookmark
- Subscribe
- Mute
- Subscribe to RSS Feed
- Permalink
- Report Inappropriate Content
No need to convert to polygon.
In your workflow did you ensure that the spatial extents, cell size and snap raster were all the same (some are within your control)
Did you do any filtering of either the input or output data? (the methodology should be discussed)
If you want to remove small fiddly bits, you can use filtering (discuss types used) or the shrink/expand method (discuss differences)
Where are your histograms?
You have a weird time step, what happened to the intervening years? making statements about time differences fails to draw attention that two of the differences are for 4 or 5 year differences and 1 is for a single year difference. The visual implication/inference needs discussion.
Normalize? maybe, did you look at this. And are you refering to normalize within a year or between time steps?
Regiongroup can be used to determine the number of unique groupings since a raster class is in essense a multipart 'shape' and regiongroup does the same function as multiparttosinglepart in vector world
Converting to vector introduces a whole set of other issues, if you feel the need, don't generalize, keep the cell shape intact so that cell counts/areas should be the same.
Oh... any spatial variation that can't be explained solely by invasion landscape preference (ie elevation, spread vectors...ie how spread)
Thats all I can think of now.
- Mark as New
- Bookmark
- Subscribe
- Mute
- Subscribe to RSS Feed
- Permalink
- Report Inappropriate Content
Hi Dan,
Thanks for your time and input. My responses are;
- Yes, all spatial extents and cell size are the same WV2(0.5mx0.5).
- No, I have not undertaken any filtering yet.
- I have histograms, just didn't provide them.
- Yes the time stamps are weird because getting access to cloud free imagery was the difficult part due to the project's geographic location (almost at Antarctica) and growth season of the rice grass.
- I have read that to compare data between different time frames, that you should normalize the data first before making comparisons?
- We do have a 25mDEM, but I haven't included that yet for modelling.
- Mark as New
- Bookmark
- Subscribe
- Mute
- Subscribe to RSS Feed
- Permalink
- Report Inappropriate Content
sounds like you are well on track
now, cloud free... if there any salvageable areas out of the imagery, they would be useful since at least they fill in the temporal dimension even if they aren't complete spatially. It would be an interesting venture and save the question....why did you skip years... (ergo my comment and question)
Re normalization, read a bit more and ensure that you are normalizing the right stuff.
Also... how sensitive is the classification to small variations in the spectral signature ? or is it pretty cut and dried?
Filtering can be to remove small areas once classified, or to filter bands prior to classification. Not fully in tune with all the RS stuff, but anything that influences your classification is important to study and report...the fact that a cool algorithm was used and everyone uses it....means little
Good luck and report back if you have further questions.
Hopefully some of the RS gurus will step in for technical support