- Home
- :
- All Communities
- :
- Products
- :
- ArcGIS Image Server
- :
- ArcGIS Image Server Questions
- :
- Classified Raster - Legend issue
- Subscribe to RSS Feed
- Mark Topic as New
- Mark Topic as Read
- Float this Topic for Current User
- Bookmark
- Subscribe
- Mute
- Printer Friendly Page
Classified Raster - Legend issue
- Mark as New
- Bookmark
- Subscribe
- Mute
- Subscribe to RSS Feed
- Permalink
- Report Inappropriate Content
- I have a NetCDF of temperature data, that I get a fresh copy every morning.
- This is stored under a Mosaic Dataset, created in ArcMap 10.6.1 (Nothing else in this mosaic dataset)
- I can serve this up as an image service using a stretched min/max renderer fine
- I want to also add a renderer to serve it up as a classified renderer, ranging from -5 to 50
- I can create a classification on a dummy raster that has min/max values of -5 to 50
- Have to use a dummy raster with the anticipated max/min values, as cant edit the min/max range when trying to setup a classified renderer
- I can then save this out as a raster function template

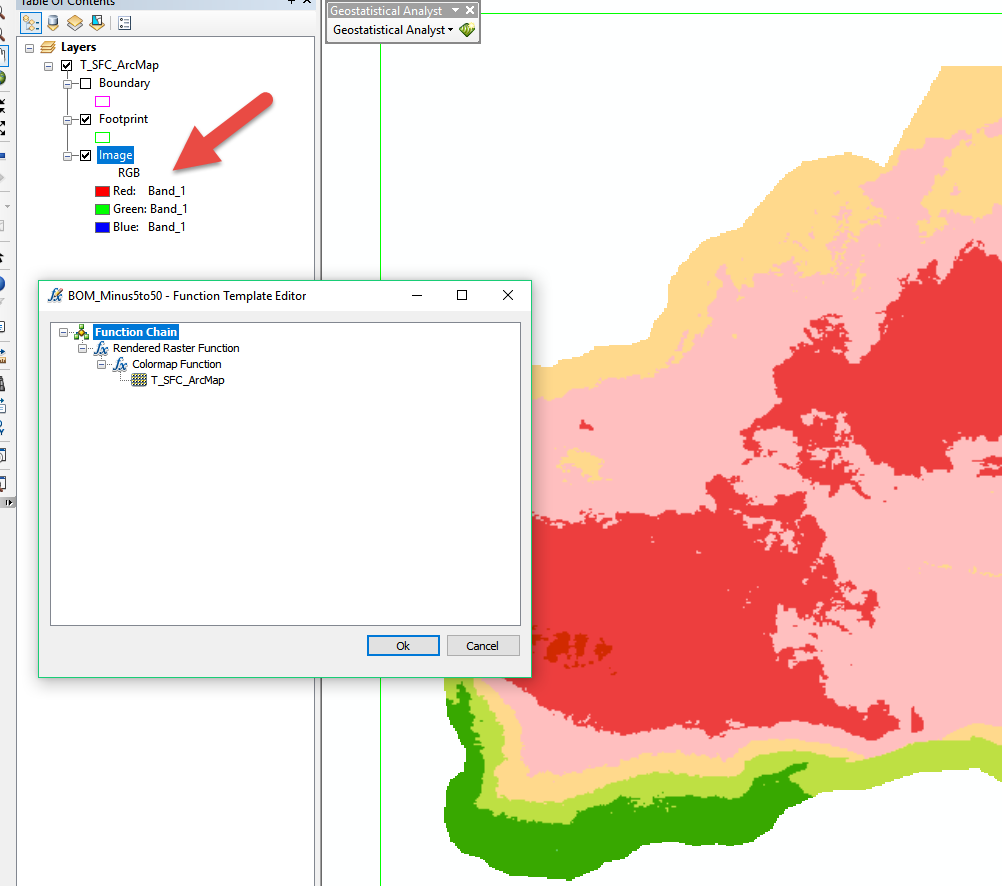
- If I then import this against the original mosaic dataset, the classification looks like it is available as a processing template
- But the legend appears as RGB (as shown below)
- I have tried playing around with adding in a colourmap function, but it still shows up as RGB
- As an end web gis user, I want to see the classification intervals and not the RGB values, how can I do this?
Solved! Go to Solution.
Accepted Solutions
- Mark as New
- Bookmark
- Subscribe
- Mute
- Subscribe to RSS Feed
- Permalink
- Report Inappropriate Content
Hi Simon,
I guess what you want to do can be achieved with a combination of
1) Remap Function
To be able to add a Attributed/Labeled Classification, you need to make your data display "integer classes" - basically the "numbered Count of classes"
I mimicked your values in the first few classes above. You could also use a table for this. Please read the Function help about upper- and lower Boundaries, ...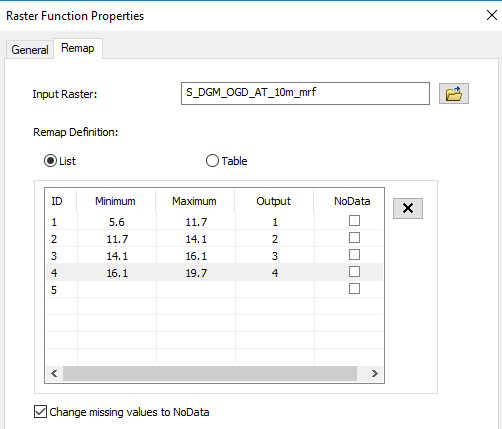
Make sure to properly define NoData!
Once you have done that, your now unique classes can be "labeled" and "colored" using the
2) AttributeTable function
Now here is where ArcMap and Pro do make a big difference: In ArcMap you need an attribute table comparable to what used to be a RAT (Raster attribute table) in old times (see help).
This is ArcMap: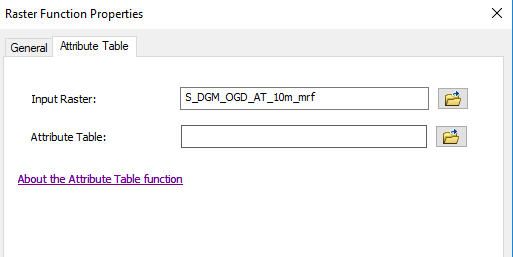
As I remember it being tricky to create a proper AttributeTable for ArcMap.
Here what it needs to look like:
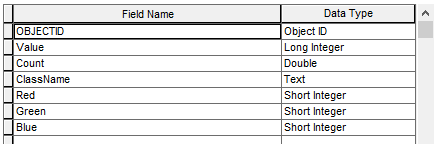
Keep in mind:
- All fields should be there exactly like this
- The "Value" field is link to the output classes of the Remap function
- The "ClassName" will be your visible label
- In "Red", "Green" and "Blue" you have to define your symbol colors
- The values in the Count field dont matter at all!
I attached this sample one (in a zipped fGDB) that you can copy and modify.
In Pro things have improved A LOT: You can either use a table, or just type in your definition in a UI like this (one of my datasets - 4 steepness classes in an elevation dataset😞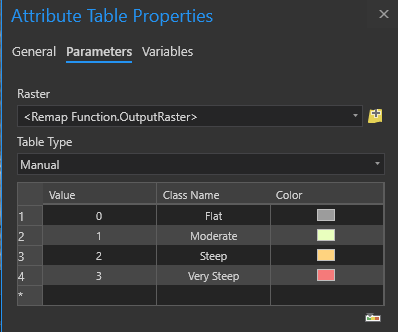
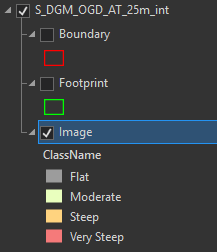
Doing things right, you will get something like this (the result of the above AttributeTable settings in ArcGIS Pro TOC):
So - again from my usecase and from Pro RasterFunction Editor - the whole process chain MIGHT look like this: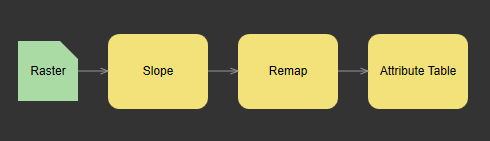
All this is way more comfortable in Pro - check it out!
I also recommend you to do this:
3) Dont forget to set the Source type of any raster where you apply AttributeTable to "Thematic" .. naturally only if you dont use many different function chains or this is to be the default.
Regards
Guenter
- Mark as New
- Bookmark
- Subscribe
- Mute
- Subscribe to RSS Feed
- Permalink
- Report Inappropriate Content
Hi Simon,
I guess what you want to do can be achieved with a combination of
1) Remap Function
To be able to add a Attributed/Labeled Classification, you need to make your data display "integer classes" - basically the "numbered Count of classes"
I mimicked your values in the first few classes above. You could also use a table for this. Please read the Function help about upper- and lower Boundaries, ...
Make sure to properly define NoData!
Once you have done that, your now unique classes can be "labeled" and "colored" using the
2) AttributeTable function
Now here is where ArcMap and Pro do make a big difference: In ArcMap you need an attribute table comparable to what used to be a RAT (Raster attribute table) in old times (see help).
This is ArcMap:
As I remember it being tricky to create a proper AttributeTable for ArcMap.
Here what it needs to look like:
Keep in mind:
- All fields should be there exactly like this
- The "Value" field is link to the output classes of the Remap function
- The "ClassName" will be your visible label
- In "Red", "Green" and "Blue" you have to define your symbol colors
- The values in the Count field dont matter at all!
I attached this sample one (in a zipped fGDB) that you can copy and modify.
In Pro things have improved A LOT: You can either use a table, or just type in your definition in a UI like this (one of my datasets - 4 steepness classes in an elevation dataset😞
Doing things right, you will get something like this (the result of the above AttributeTable settings in ArcGIS Pro TOC):
So - again from my usecase and from Pro RasterFunction Editor - the whole process chain MIGHT look like this:
All this is way more comfortable in Pro - check it out!
I also recommend you to do this:
3) Dont forget to set the Source type of any raster where you apply AttributeTable to "Thematic" .. naturally only if you dont use many different function chains or this is to be the default.
Regards
Guenter
- Mark as New
- Bookmark
- Subscribe
- Mute
- Subscribe to RSS Feed
- Permalink
- Report Inappropriate Content
Really appreciate that well written response. I think I will see if I can shift the workflow to ArcGIS Pro.
A couple of other things have come up, but aim to look at sorting this out next week, your logic gives me everything I need.
I will report back with my workings for completeness.
Big thanks, I imagine your answer will be useful for others.
- Mark as New
- Bookmark
- Subscribe
- Mute
- Subscribe to RSS Feed
- Permalink
- Report Inappropriate Content
Pleasure,
feel free to ask if questions come up
BTW: Once you have published a Thematic dataset like this, any end-user can change the color assignment in Desktop 