- Home
- :
- All Communities
- :
- Products
- :
- Imagery and Remote Sensing
- :
- Imagery Questions
- :
- Re: Change in AGO World Imagery June 6 - June 27, ...
- Subscribe to RSS Feed
- Mark Topic as New
- Mark Topic as Read
- Float this Topic for Current User
- Bookmark
- Subscribe
- Mute
- Printer Friendly Page
Change in AGO World Imagery June 6 - June 27, 2018?
- Mark as New
- Bookmark
- Subscribe
- Mute
- Subscribe to RSS Feed
- Permalink
- Report Inappropriate Content
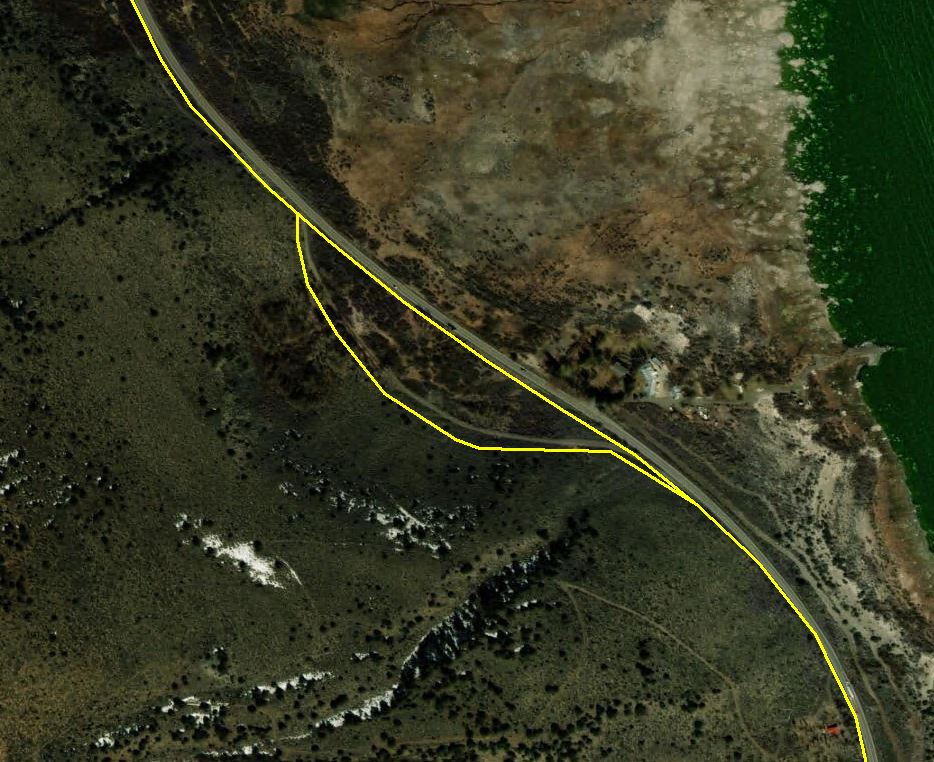
We are currently working on a centerline clean up project and using the World Imagery in ArcMap via service to update the spatial accuracy of the roads. Last week the service was updated (June 27th) and we noticed in some places the imagery had shifted up to 50 feet. After hours of investigating if something was wrong with our data, we pulled in the WayBack aerial from June 6 and the roads lined up to the aerial again.
What caused this shift in the accuracy of the World Imagery? It wasn't uniform across the area we are working in (Eastern California.) We haven't seen any reference to this from Esri. Attached are before (June 6) and after (June 27) screenshots showing the shift in the aerial.
Any insight or discussion is much appreciated.
- Mark as New
- Bookmark
- Subscribe
- Mute
- Subscribe to RSS Feed
- Permalink
- Report Inappropriate Content
Glad to hear you found a solution in Wayback!
There are a number of factors in the upstream processing of each imagery product that can lead to localized changes such as the one noted here. Generally speaking, aerial triangulation, the image look angle, and/or the elevation model used in the orthorectification could have influenced the positional accuracy of the final product.
- Mark as New
- Bookmark
- Subscribe
- Mute
- Subscribe to RSS Feed
- Permalink
- Report Inappropriate Content
Robert.
The issue with the update appears to be the projection process, or triangulation, or angle, or elevation model. As I understand it the release on the 27th provided one meter resolution of the imagery. In developing the data for release was a new set of source imagery or new/modified algorithms or environmental parameters used?
The reason I ask this question is for the following reasons:
1- in all the prior imagery releases over the past year the road centerlines generally have maintained the same spatial reference. We know this because we have been editing road centerlines to align with the imagery and have not run into this issue before. We are working on a statewide road centerline project and both my firm and client are using the imagery as a spatial standard.
2- We just completed editing a section of a large county using the June 6 version of the imagery. We modified 97% of the centerlines to the imagery. After the release on the 27th we evaluated the centerlines and found a roughly 21% error in the centerlines no longer aligning with the imagery. This creates an issue for my firm and client that has been editing data - do we now need to go back re-edit these data? The question is not based on a contractual issue but on a visual esthetic and quality of the work perception by the users/client. As we deploy applications in a range of public safety environments, users are coming to expect accurate alignment of lines, polys, and points with imagery. Imagery is informally considered a type of datum - the expectation is that it nominally shifts and can be used as a reference.
3- Will future releases of the imagery data continue to show these variations in centerline location? This is a key question as any user of Esri imagery data that is using it for reference needs to expect that when new releases of the imagery occur there is a chance the centerlines will not spatially align. For my firm and clients I work with this means:
a- One release version should be identified as the standard and used for the editing process and user applications into the foreseeable future.
b- There may be a need to include in any contracts, where Esri imagery data is used, caveats regarding the spatial accuracy across versions.
c- A decision will need to be made to use one release version of the imagery for the project, or obtain acknowledgement from the client that centerlines will appear "off" when a new version is utilized as part of the project. Further, there may be a need to add an attribute field to identify the version of the imagery used during editing of each feature.
4- I will claim ignorance to this question as I have not yet time to research it myself - Does Esri have a published statement regarding the accuracy, dynamic nature, or reliability of the data it provides as a service? If so, great; we can utilize it in contracts and reports to set expectation of the data.
Finally, given the variables of the projection process, or triangulation, or image angle, or elevation model, or associated algorithms associated with the 27th release, could your team conduct some analysis on the spatial changes and what percentage of the imagery (easily seen in roads but I am sure other features can be evaluated too) may have shifts. I think there is a need to set expectations for users - where will users expect to see shifts in the data and what is the mean distance users could see features shifting.
I appreciate your time in reviewing and considering the comments and suggestions provided.