Imagery and Remote Sensing Blog

cancel
Showing results for 
Show  only  | Search instead for 
Did you mean: 

Other Boards in This Place

Latest Activity

(65 Posts)
AlexandraWynn
Esri Contributor

We're excited to introduce ArcGIS Video Server, a new server role for ArcGIS Enterprise that enables indexing, searching, publishing, and streaming video as a service with geospatial and temporal context.

Read more...

more
0 0 296
VinayViswambharan
Esri Contributor

The ArcGIS Image Analyst extension for ArcGIS Pro 2.5 now features expanded deep learning capabilities, enhanced support for multidimensional data, enhanced motion imagery capabilities, and more.

Learn about  new imagery and remote sensing-related features added in this release to improve your image visualization, exploitation, and analysis workflows.

Deep Learning

We’ve introduced several key deep learning features that offer a more comprehensive and user-friendly workflow:

  • The Train Deep Learning Model geoprocessing tool trains deep learning models natively in ArcGIS Pro. Once you’ve installed relevant deep learning libraries (PyTorch, Fast.ai and Torchvision), this enables seamless, end-to-end workflows.
  • The Classify Objects Using Deep Learning geoprocessing tool is an inferencing tool that assigns a class value to objects or features in an image. For instance, after a natural disaster, you can classify structures as damaged or undamaged.
  • The new Label Objects For Deep Learning pane provides an efficient experience  for managing and  labelling training data. The pane also provides the option to export your deep learning data.
  • A new user experience lets you interactively review deep learning results and edit classes as required.
New deep learning tools in ArcGIS Pro 2.5

New deep learning tools in ArcGIS Pro 2.5

Multidimensional Raster Management, Processing and Analysis

New tools and capabilities for multidimensional analysis allow you to extract and manage subsets of a multidimensional raster, calculate trends in your data, and perform predictive analysis.

New user experience

A new contextual tab in ArcGIS Pro makes it easier to work with multidimensional raster layers or multidimensional mosaic dataset layers in your map.

Intuitive user experience to work with multidimensional data

Intuitive user experience to work with multidimensional data

  • You can Intuitively work with multiple variables and step through time and depth.
  • You have direct access to the new functions and tools that are used to manage, analyze and visualize multidimensional data.
  • You can chart multidimensional data using the temporal profile, which has been enhanced with spatial aggregation and charting trends.

New tools for management and analysis

The new multidimensional functions and geoprocessing tools are listed below.

New geoprocessing tools for management

We’ve added two new tools to help you extract data along specific variables, depths, time frames, and other dimensions:

  • Subset Multidimensional Raster
  • Make Multidimensional Raster layer

New geoprocessing tools for analysis

  • Find Argument Statistics allows you to determine when or where a given statistic was reached in multidimensional raster dataset. For instance, you can identify when maximum precipitation occurred over a specific time period.
  • Generate Trend Raster estimates the trend for each pixel along a dimension for one or more variables in a multidimensional raster. For example, you might use this to understanding how sea surface temperature has changed over time.
  • Predict Using Trend Raster computes a forecasted multidimensional raster using the output trend raster from the Generate Trend Raster tool. This could help you predict the probability of a future El Nino event based on trends in historical sea surface temperature data.

Additionally, the following tools have improvements that support new analytical capabilities:

New raster functions for analysis

  • Generate Trend
  • Predict Using Trend
  • Find Argument Statistics
  • Linear Spectral Unmixing
  • Process Raster Collection

New Python raster objects

Developers can take advantage of new classes and functions added to the Python raster object that allow you to work with multidimensional rasters

New classes include:

  • ia.RasterCollection – The RasterCollection object allows a group of rasters to be sorted and filtered easily and prepares a collection for additional processing and analysis.
  • ia.PixelBlock – The PixelBlock object defines a block of pixels within a raster to use for processing. It is used in conjunction with the PixelBlockCollection object to iterate through one or more large rasters for processing.
  • ia.PixelBlockCollection – The PixelBlockCollection object is an iterator of all PixelBlock objects in a raster or a list of rasters. It can be used to perform customized raster processing on a block-by-block basis, when otherwise the processed rasters would be too large to load into memory.

New functions include:

  • ia.Merge() – Creates a raster object by merging a list of rasters spatially or across dimensions.
  • ia.Render (inRaster, rendering_rule={…}) – Creates a rendered raster object by applying symbology to the referenced raster dataset. This function is useful when displaying data in a Jupyter notebook.
  • Raster functions for arcpy.ia – You can now use almost all of the raster functions to manage and analyze raster data using the arcpy API
New tools to analyse multidimensional data

New tools to analyse multidimensional data

Motion Imagery

This release includes enhancements to our motion imagery support, so you can better manage and interactively use video with embedded geospatial metadata:

  • You can now enhance videos in the video player using contrast, brightness, saturation, and gamma adjustments. You can also invert the color to help identify objects in the video.
  • Video data in multiple video players can be synchronized for comparison and analysis.
  • You can now measure objects in the video player, including length, area, and height.
  • You can list and manage videos added to your project with the Video Feed Manager.
Motion imagery in ArcGIS Pro

Pixel Editor

The Pixel Editor provides a suite of tools to interactively manipulate pixel values of raster and imagery data. Use the toolset for redaction, cloud and noise removal, or to reclassify categorical data. You can edit an individual pixel or a group of pixels at once. Apply editing operations to pixels in elevation datasets and multispectral imagery. Key enhancements in this release include the following:

  • Apply a custom raster function template to regions within the image
  • Interpolate elevation surfaces using values from the edges of a selected region

Additional resources

more
0 0 976
by Anonymous User
Not applicable

The new Getting to Know ArcGIS Image Analyst guide gives GIS professionals and imagery analysts hands-on experience with the functionality available with the ArcGIS Image Analyst extension.

It’s a complete training guide to help you get started with complex image processing workflows. It includes a checklist of tutorials, videos and lessons along with links to additional help topics.

Task Checklist for getting started with ArcGIS Image Analyst

This guide is useful to anyone interested in learning how to work with the powerful image processing and visualization capabilities available with the ArcGIS Image Analyst. Complete the checklist provided in the guide and you’ll get hands on experience with:

  • Setting up ArcGIS Image Analyst in ArcGIS Pro
  • Extracting features from imagery using machine learning image classification and deep learning methods
  • Processing imagery quickly using raster functions
  • Visualizing and creating data in a stereo map
  • Creating and measuring features in image space
  • Working with Full Motion Video

Download the guide and let us know what you think! Take the guide survey to provide us with direct feedback.

ABOUT THE AUTHOR

more
2 0 775
EmilyWindahl
Esri Contributor

Given the growing number of people using commercial drones these days, a common question is: “What do I do with all this imagery?”

The simple answer is that it depends on what you’re trying to accomplish.

If you just want to share the imagery as-is, and aren’t worried about making sure it’s georeferenced to be an accurate depiction of the ground, Oriented Imagery is probably your answer. If you’re capturing video, Full Motion Video in the Image Analyst extension for ArcGIS Pro is your best bet. Ultimately, though, many users plan to turn the single frame images acquired by drones into authoritative mapping products—orthorectified mosaics, digital surface models (DSMs), digital terrain models (DTMs), 3D point clouds, or 3D textured meshes.

Esri has three possible solutions for producing authoritative mapping products from drone imagery, each targeted for different users— (1) Drone2Map for ArcGIS, (2) the ortho mapping capability of ArcGIS Pro Advanced, and (3) the Ortho Maker app included with ArcGIS Enterprise. Read on to get an overview of all three solutions, and to figure out which one is best for your application.

Drone2Map for ArcGIS

For individual GIS users, Drone2Map is an easy-to-use, standalone app that supports a complete drone-processing workflow.

Drone2Map includes guided templates for creating orthorectified mosaics and digital elevation models. It’s also the only ArcGIS product that creates 3D products from drone imagery, including RGB point clouds and 3D textured meshes. Once you’ve processed your imagery, it’s easy to share the final products—2D web maps and 3D web scenes can be easily published on ArcGIS Online with a single step. ArcGIS Desktop isn’t required to run Drone2Map, but products created with Drone2Map are Desktop-compatible. That’s important, because it gives you the option to use ArcGIS Pro as an image management solution, or to serve your imagery products as dynamic image services using ArcGIS Image Server.

Ortho mapping capability of ArcGIS Pro Advanced

For GIS professionals, the ortho mapping capability of ArcGIS Pro Advanced enables you to create orthomosaics and digital elevation models from drone images (as well as from modern aerial imagery, historical film, and satellite data) in the familiar ArcGIS Desktop environment.

There are added benefits to processing your drone imagery in ArcGIS Pro. For users with very large imagery collections, Pro’s image management capabilities are especially valuable. Managing drone imagery using mosaic datasets makes it easy to query images and metadata, mosaic your imagery, and build footprints. Image management and processing workflows in ArcGIS Pro can also be automated using Python or Model Builder. Finally, sharing your imagery is straightforward. While you can publish your products to ArcGIS Online, you can also use ArcGIS Pro in conjunction with ArcGIS Image Server to publish drone products as dynamic image services.  

Ortho Maker app in ArcGIS Enterprise 10.6.1+

For ArcGIS Enterprise users, the Ortho Maker app offers a solution for organizations with multiple users who want simple, web-based workflows to create orthomosaics and DEMs from drone imagery.


Ortho Maker provides an easy-to-use web interface for uploading drone imagery and managing the ortho mapping workflow, while behind the scenes it uses the distributed processing and storage capability of Enterprise and ArcGIS Image Server to quickly process even very large collections of drone imagery. (That also means it requires ArcGIS Image Server configured for raster analysis.) The ArcGIS API for Python can be used to automate the ortho mapping process. Sharing Ortho Maker products is virtually automatic—they become imagery layer items accessible in your Enterprise portal, easily shared with users throughout your organization.

What do typical users say?

things typical users of each ArcGIS option for processing imagery might say

Next steps

Now that you have a better idea which solution makes sense for your application, it’s time to take one for a test drive. Drone2Map offers a free 15-day trial, plus a hands-on Learn lesson to get started. You can try ArcGIS Pro Advanced free for 21 days, and read more about getting started with ortho mapping for drone imagery.  For users with Enterprise 10.6.1+ and raster analysis enabled, Ortho Maker is included—find out how to get started.  Other Enterprise users should contact their administrator to see about getting access. If you still have questions, contact Esri for more product information.

more
6 7 6,641
CodyBenkelman
Esri Regular Contributor

For FMV in ArcGIS (ArcGIS Pro 2.2 or later with Image Analyst Extension, or ArcMap 10.x with the FMV add-in) to display videos and link the footprint into the proper location on the map, the video must include georeferencing metadata multiplexed into the video stream.  The metadata must be in MISB (motion industry standards board) format.  Information is here http://esriurl.com/misb, but drone users do not need to study this specification.  For non-MISB datasets, Esri has created a geoprocessing tool called the Video Multiplexer that will process a video file with a separate metadata text file to create a MISB-compatible video.  This is described more completely (e.g. format for the metadata about camera location, orientation, field of view, etc.) in the FMV Manual at http://esriurl.com/FMVmanual.

Running the Video Multiplexer is straightforward if you have the required metadata in the proper format, so that is the key challenge. 

Esri has an app available at http://esriurl.com/SSEE that can be used to plan and control drone flights.  This app for iPad is free for users with an ArcGIS Online or Enterprise account, and it will automatically record the metadata required for the Video Multiplexer on any video flight (manual or autonomous).  Drones supported by this app are listed at https://esriurl.com/SiteScanSupportedDrones.    

For users that require Android, Esri business partner CompassDrone has built an application called CIRRUAS that will capture video metadata required for FMV support.  CIRRUAS is available at https://compassdrone.com/cirruas/.

Note that the required metadata must be captured at the time of the drone flight.  If you have videos that were previously captured without using this app, it may be possible to extract the required metadata, but there are limitations and our experience has shown that it is challenging.  Further discussion is included below.

DJI drones write a binary formatted metadata file with extension *.dat or *.srt (depending on drone and firmware) for every flight.  There is a free utility called “DatCon” at this link https://datfile.net/DatCon/downloads.html which will reportedly convert the DJI files to ASCII format.   That ASCII file could then be manually edited for compatibility with ArcGIS Pro as described below.  If you decide to pursue this editing and reformatting, please see this blog for additional advice: http://esriurl.com/MultiplexerTipsTricks.


Key points:

  • Esri has not tested and cannot endorse the free DatCon utility. If you choose to use it, as with any download from the internet, you should check it for viruses etc.
  • DJI has changed the format of the metadata in this file on multiple occasions, so depending on your drone and date of its firmware, you will find differences in the metadata content. Esri does not have a specification for the DJI metadata at any version, so cannot advise you what to expect to be included in (or missing from) this file.
  • Another key point is that the DJI *.dat and *.srt files were created for the purpose of troubleshooting; they were NOT designed with the intent of supporting geospatial professionals seeking a complete metadata record for the drone, gimbal, and camera.  As a result, users will typically find temporal gaps in the metadata.  As a result, processing this metadata through the FMV Multiplexer will likely generate incomplete and/or inaccurate results, unless you apply manual effort to identify the temporal gaps and fill in your own estimated or interpolated values for the missing times and missing fields.
  • This blog was first written in September 2018, and it is very possible that DJI will make firmware changes in the future to change the readability and completeness of their metadata.

NEW UPDATE September 2022:  if any portion of your video aims above the horizon, the features of FMV may not be suitable for your needs.  See resources in post below from 09-20-2022.

Check back in this blog for updates as more capabilities are developed.

more
6 23 14K
JeffLiedtke
Esri Contributor

The June 2017 update of ArcGIS Online includes some useful capabilities for displaying imagery served by your image services. These capabilities give you greater control for visualizing the information contained in your image services. When we talk about rendering, we’re not talking about making soap out of fat. Here at Esri, rendering is the process of displaying your data. How an image service is rendered depends on what type of data it contains and what you want to show.

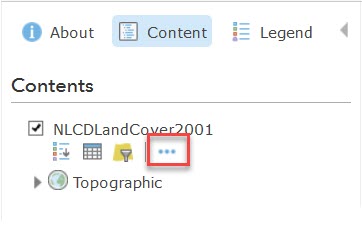
Once you search for and add a layer, and your image is displayed in Map Viewer, click the More Options icon then Display to open the Image Display pane.

Image Display Options

You see a new category named Image Enhancement. This is where the real fun begins.

Image Enhancement pane

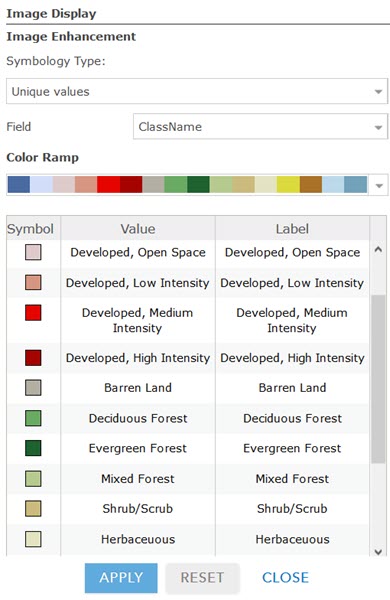
The Symbology Type options include Unique Values, Stretch and Classify. Unique Values and Classify renderers work with single-band image services, while the Stretch renderer works on both single and multiple band images.

Unique Values Renderer

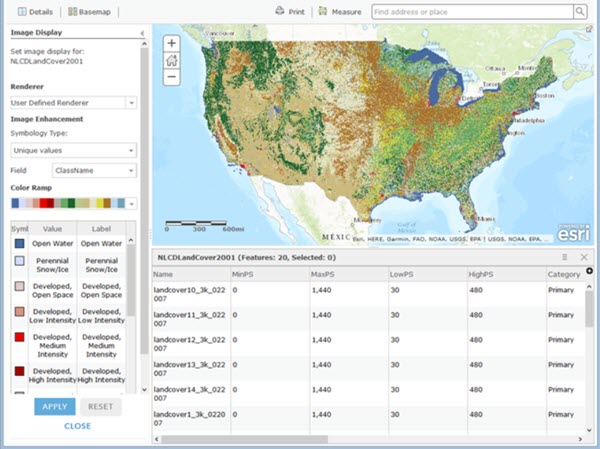
Unique values symbolize each value in the raster layer individually and are supported on single band layers with Raster Attribute table. The symbology can be based on one of more attribute fields in the dataset. The colors are read from the Raster Attribute table and if they are not available the renderer assigns a color to each value in your dataset. This symbology type is often used with single band thematic data, such as land cover, because of its limited number of categories. It can also be used with continuous data if you choose a color ramp that is a gradient.

Unique Values Renderer

  1. Use the Field drop-down to select the field you want to map. The field is displayed in the table.
  2. Click the Color Ramp drop-down and click on a color scheme. If your image service already has a color ramp, such as the NLCD service in this example, it is displayed by default.
  3. The colors in the Symbol column and Labels can be edited as required.
  4. Click Apply to display the rendering in the layer

Stretch

The stretch parameters improve the appearance of your image by adjusting the image histogram controlling brightness and contrast enhancements. Either single or multiple band images can be stretched. For multiple band images, the stretch is applied to the band combination previously chosen in the RGB Composite options. The stretch options enhance various ground features in your imagery to optimize information content.

1.   Click the Stretch Type drop-down arrow and choose the stretch type to use. The following contrast enhancements determine the range of values that are displayed.

  • None – No additional image enhancement will be performed
  • Minimum and Maximum – Displays the entire range of values in your image. Additional changes can be made by editing the values in the Min-Max grid (available only when Dynamic range adjustment is turned off.)
  • Standard Deviation – Display values between a specified number of standard deviations
  • Percent Clip – Set a range of values to display. Use the two text boxes to edit the top and bottom percentages.

2.   If the Stretch type is set to an option other than None, the following additional image enhancement options will be available.

  • Dynamic range adjustment – Performs one of the selected stretches, but limits the range of values to what is currently in the display window. This option is always turned on if the imagery layer does not have global statistics.
  • Gamma – Stretches the middle values in an image but keeps the extreme high and low values constant.

3.   For single-band layers, you can optionally choose a new color scheme from the Color Ramp drop-down menu after applying a stretch method on the layer.

4.   Click Apply to display the rendering in the layer.

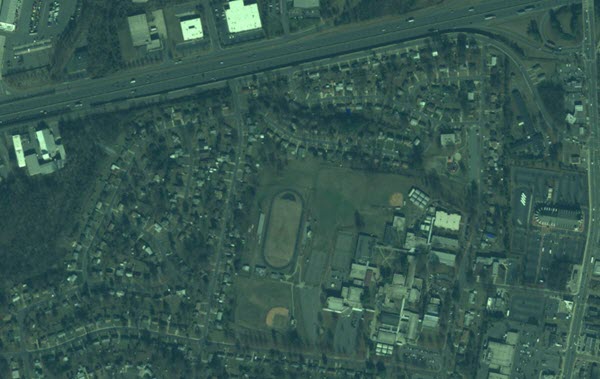
Here’s a WorldView-2 natural color image of Charlotte, NC, using the default no stretch:

Multispectral Image, No Stretch

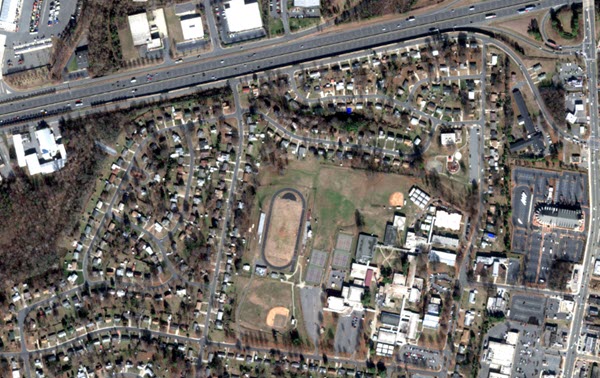
And here is the same imagery layer with the top 2% and bottom 20% of the histogram omitted:

Multispectral Imagery, Percent Stretch

Classify Renderer

Classify symbology is supported by single band layers. It allows you to group pixels together in a specified number of classes. The following are the different settings available with the Classify symbology.

  • Field – Represents the values of the data.
  • Method – Refers to how the break points are calculated.
  • Defined Interval – You specify an interval to divide the range of pixel values and the number of classes will be automatically calculated.
  • Equal Interval – The range of pixel values are divided into equally sized classes where you specify the number of classes.
  • Natural Breaks – The class breaks are determined statistically by finding adjacent feature pairs between which there is a relatively large difference in data value.
  • Quantile – Each class contains equal number of pixels.
  • Classes – Sets the number of groups.
  • Color Ramp – Allows you to choose the color ramp for displaying the data.

Classify symbology works with single band layers that have either a Raster Attribute Table or Histogram values. If a histogram is absent, it is generated when you select the symbology type.

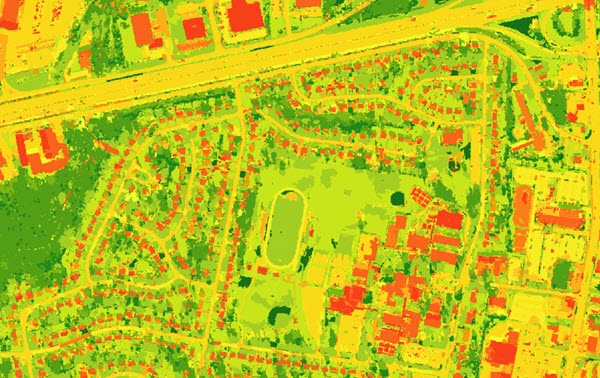
Here’s the classified map of Charlotte, specifying 15 classes and using the Natural Breaks method for determining class breaks:

Class Map

Summary

These new Map Viewer image rendering capabilities are similar to what you are used to in ArcMap and ArcGIS Pro. Since this release, Scene Viewer also supports imagery layers, however we are still working on bringing the new Map Viewer image rendering capabilities into Scene Viewer. Check out these new imagery capabilities in ArcGIS Online and see how they can enhance the stories behind your data.

Please leave us comments below for any future enhancements you’d like to see. And check back in a few months; we have a lot of other cool stuff planned for imagery in upcoming releases.

more
1 0 840
CodyBenkelman
Esri Regular Contributor

Esri and Garmin are pleased to announce that Garmin’s VIRB Action Cameras (VIRB Ultra 30, VIRB X, VIRB XE, and VIRB Elite) have full support for Full Motion Video (FMV) for ArcGIS!  

To leverage this feature, users can download the latest version of VIRB Edit software (version 5.1.1 and above) from http://www8.garmin.com/support/download_details.jsp?id=6591 or simply search for “Virb edit software” at http://www.garmin.com.


The Full Motion Video add-in is a free download for ArcMap 10.3 through 10.5, and will be coming in ArcGIS Pro version 2.1 by the end of 2017.  Current users of ArcMap can find information on FMV at http://esri.com/FMV.  The Full Motion Video add-in allows users to manage, display, and analyze geospatially enabled videos within their GIS.  Feature data can be digitized from video frames, and GIS features can be overlaid onto the video during playback.  The video search tool provides a powerful data management capability, enabling users to quickly find archived videos based on attribute data or a simple geographic search. 


The Garmin VIRB cameras record GPS and camera orientation data with the video.  This position and orientation metadata enables FMV for ArcGIS to locate the sensor on the map, and if the camera footprint (field of view) is aimed toward the ground, the moving video footprint can also be displayed in ArcGIS. 

Instructions for extracting the VIRB position and orientation metadata and then processing with the Full Motion Video Multiplexer are available in this document:  http://esriurl.com/GarminVirbFMV

more
4 3 3,347
CodyBenkelman
Esri Regular Contributor

Esri has released an updated version of the Full Motion Video (FMV) add-in, version 1.4.2, for the current version of ArcMap (10.8.x).  If you are using earlier versions of ArcMap, you'll need different versions of the add-in.  Refer to http://esriurl.com/FMVmanual for supported versions.

IMPORTANT:  Please note that FMV has been supported in ArcGIS Pro (with the Image Analyst extension) since Pro version 2.2, and all active development is focused on the 64-bit 3D environment of ArcGIS Pro.  For users on the 10.x platform, FMV has been recompiled for compatibility with 10.8.x, but no new features are being added into the 10.x platform.  Users are encouraged to move to Pro for the latest capabilities which include

  • Viewing in 2D and 3D
  • Support for VMTI (video moving target indicator) metadata
  • Support of a DEM in the Video Multiplexer geoprocessing tool

See more information at https://www.esriurl.com/FMVFAQpro 

For video captured with appropriate metadata (regarding camera location and orientation), FMV enables viewing and processing of video in a mapping environment.  FMV is compatible with a variety of common video formats, whether captured from fixed vantage points, manned aircraft, or drones. 


Refer to the landing page at http://esri.com/FMV for further information, and go to my.esri.com if you need to download the software for ArcMap 10.x.  For ArcGIS Pro with the Image Analyst extension, no download is required.

more
2 7 4,117
ReneeBrandt
Occasional Contributor

Hi Everyone,

We had so many questions from the Eyes on the World imagery webinar, that it took us a few weeks to answer them all.

I'm attaching a document with answers to all the questions submitted.  In addition, if you didn't have a chance to join us live, a recording of the webinar is posted at the link below:

go.esri.com/imageryseries

We want to thank you for participating in the webinar, and your interest in ArcGIS imagery capabilities.

more
0 0 1,744
ReneeBrandt
Occasional Contributor

Great News!  ArcGIS Full Motion Video (FMV) is now here!  Do you need to visualize and analyze video from drones, UAVs, UASs, manned aircraft, GoPros, surveillance systems, or video cameras? 

If you are an existing ArcGIS for Desktop customer, and want to work with streaming or recorded video data, FMV is a simple to install add-in.  If you are not using ArcGIS for Desktop yet, get a free trial of both.

For more information:

more
4 33 8,543
175 Subscribers