- Home
- :
- All Communities
- :
- Products
- :
- Imagery and Remote Sensing
- :
- Imagery Blog
- :
- Arthur's Feature Extraction from LiDAR, DEMs and I...
Arthur's Feature Extraction from LiDAR, DEMs and Imagery
- Subscribe to RSS Feed
- Mark as New
- Mark as Read
- Bookmark
- Subscribe
- Printer Friendly Page
- Report Inappropriate Content
7/26/2019: Added how to make a tree inventory 3D without lidar or height (hint DBH).
10/24/2018: Added link and instructions to create 3D buildings using lidar from Microsoft Building Footprints US.
10/4/2018: Added an update to the tools in the 3D mapping with Lidar Point Clouds below called ArthursLidarBuildingExtractionTools_10_04_2018.zip. This fixes issues with the Unclassified approach to building collection from lidar, a tool to clip buildings extracted to parcels, and Jagged tool which help to identify jagged buildings that come as a result of regularization. These tools are improvements that I have tested with many cities/counties for building extraction. These updates will eventually be applied to the 3D mapping with Lidar Point Clouds. For creating 3D buildings from the extracted 2D building footprints, please use the latest version of the Local Government 3D Basemaps solution.
9/28/2017: Please see 3D mapping with Lidar Point Clouds, this are ArcGIS Pro Tools, example data and workshop exercises from the IMF workshop we developed for this year's Imagery and Mapping Forum before the ESRI UC. This covers Extracting Building Footprints from Classified Lidar for buildings, Extracting Building Footprints from Unclassified Lidar for Buildings, and the 3D Basemaps for taking the footprints to 3D and adding trees. This replaces the methodology with Geoff Taylor showed in Extracting Building Footprints from Classified LiDAR using some of my older techniques.
12/5/2016: Added extensively to the Regularize Building Footprint tool suggestions.
12/8/2016: Changed 1200 to 12000 in the Regularize Building Footprint tool suggestions.
12/21/2016: Added Clean Extracted Buildings Using Regularize Building Footprint Tool
12/22/2016: Corrected error in models for Clean Extracted Buildings Using Regularize Building Footprint Tool due to bug in Regularize Building Footprint tool (inputting empty featureclass).
01/03/2017: Issue found with Clean Extracted Buildings Using Regularize Building Footprint Tool not working if there are no large buildings (over 25,000 sq. feet), looking into.
This blog will be dedicated to feature extraction from raster or point clouds to vector. I have been generating content for the World Topo Map Basemaps including the Contours, Spot Elevations, Vegetation and even buildings from Lidar. Lately, I have been focused on extracting buildings and trees from Lidar and/or imagery. I wrote a tool to extract Trees from Lidar 5 years ago and it's published here.
Instructions to create 3D Buildings from Microsoft US Building Footprints:
An example of this is at: http://www.arcgis.com/home/item.html?id=3f3de2298e27408689cb71b92340db7f
Here's a link to see it in 3D: Scene Viewer
Semi-automatic extraction of building footprints from Imagery
Attached is the tool for ArcGIS Pro 1.3 for Extract Buildings From Imagery. You will need 3D Analyst and Spatial Analyst for this tool. It takes imagery segmented with the Segment Mean Shift tool and converted to vectors. You then select the vectors, run the tool. It uses a model to convert into corrected buildings from the raw raster vectors and append to a feature class. Below is an example of segmentation vectors selected and then run through the tool to get building footprints. I suggest selecting multiple buildings and then running the tool. The tool is attached at the bottom as ExtractBuildingsFromImageryPro1_3v4.zip. After unzipping the data, be sure to use define projection on the building featureclass in the output.gdb to match the projection of your imagery.
There was an issue with the pathways not coming through correctly. I believe this is now fixed as the workspace is defined as in_memory. If you get an error for pathway not found, open the model and change the pathways in the model for C:\Users\student\Documents\ArcGIS\Projects\ImageryExtraction\ImageryExtraction.gdb\seg to in_memory\seg. You will have to do this for all the temporary files in the model. Thanks to those who reported this error.
- Download the tool from my blog.
- Unzip the tool.
- Get high resolution imagery of the area you wish to extract buildings from (6 inch is best).
- Open ArcGIS Pro (1.3 or better) Map
- Add your imagery to the Map
- Under the Insert Tab, use Add Toolbox to add the ExtractBuildingsFromImageryPro1_3.tbx toolbox.
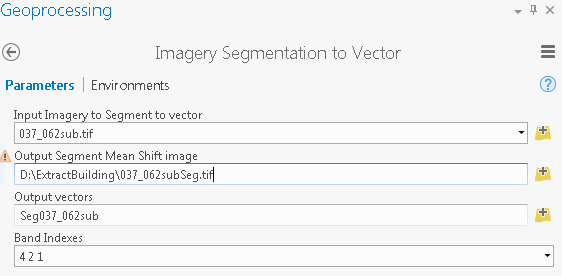
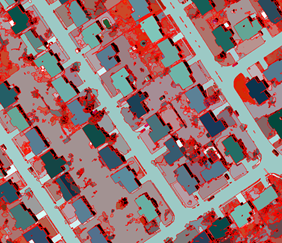
- Run the Imagery Segmentation to Vector tool against your imagery. This takes time (5 minutes for a 349mg file). If four band, enter 4 2 1 into the Band Indexes.
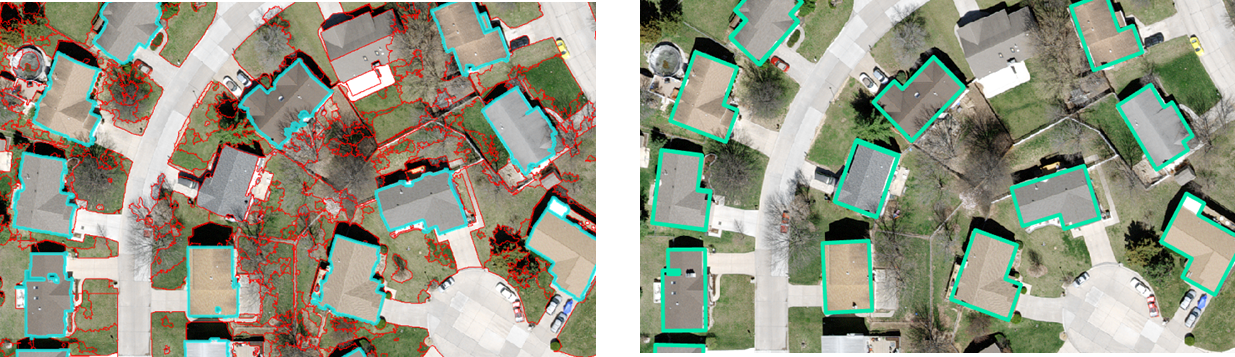
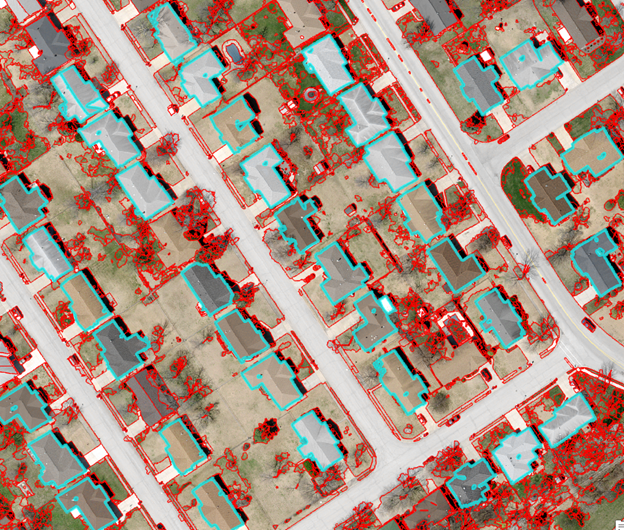
- Change the symbology of the output to red and put on top of the segment mean shift image. It should look like this:
- Turn off the Segmentation image and with the original imagery underneath, select polygons for houses you want to convert to building polygons.
- For the first time, run Define Projection to the building featureclass to match your imagery.
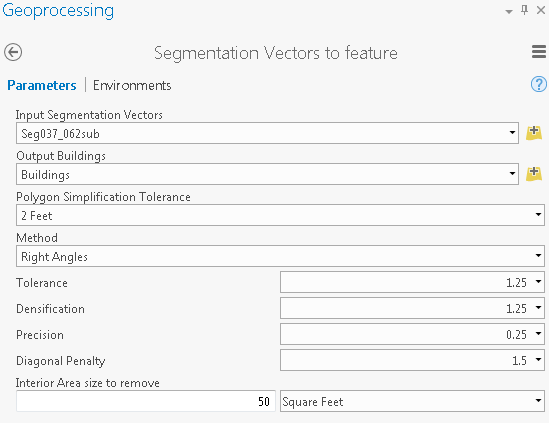
- Open the Segmentation Vectors to feature tool and run after setting your parameters.
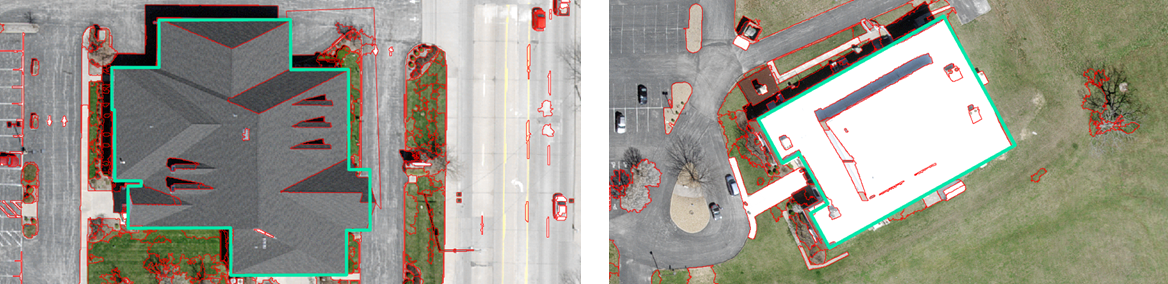
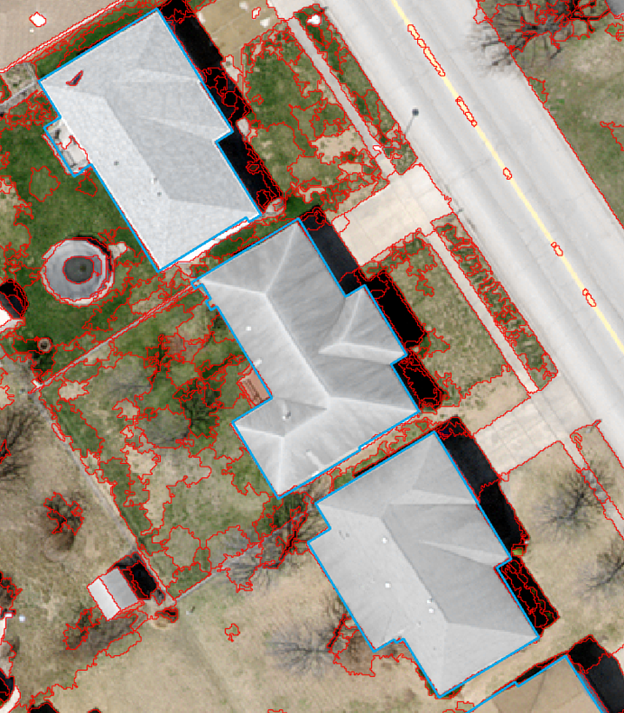
- Inspect your results:
Regularize Building Footprint Tool - Clean up raw extracted features extracted from lidar or imagery.
Raw Lidar and Raster extracted buildings need to be cleaned up and the Regularize Building Footprint tool does a good job, but it's difficult to know what to enter in the parameters for the tool. I have been working on models to do so and now have added a model to run the Regularize Building Footprint tool against raster extracted buildings call Clean Extracted Buildings Using Regularize Building Footprint Tool.
The Clean Extracted Buildings Using Regularize Building Footprint Tool requires ArcGIS ArcMap 10.4 with ArcGIS for Desktop Advanced and requires the 3D Analyst extension. This is the first version released is derived from the processes below. The input for this tool can be rasterized building auto extracted from imagery/digital maps/hard copy scanned map. I have used similar processes to extract the buildings from OS maps, lidar rasters generated and even classified imagery for buildings. This goes beyond the tool above in the clean up of features using the Regularize Building Footprint tool.
Time to run both operations (Warning: The tool will use most of the computing power on your system):
Intel Core i7 - 4600 CPU @ 2.10 GHz 2.70 GHz U with 8GB memory (64bit) - 25 minutes for 10,000 features
Intel Xeon CPU E5 -1620 0 @ 3.60GHz 3.60GHz with 32GB memory (64bit) - 8 minutes for 10,000 features
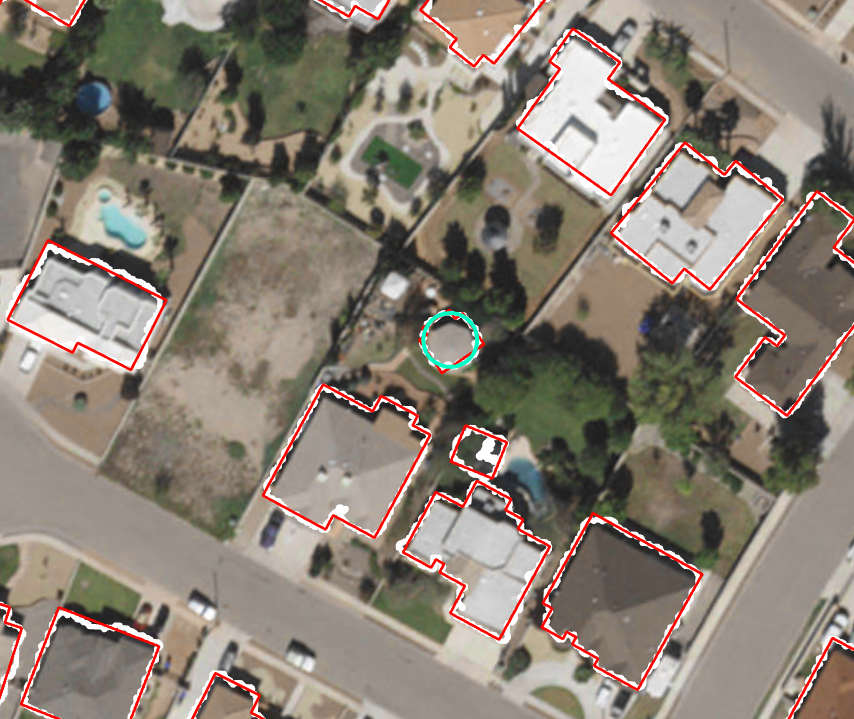
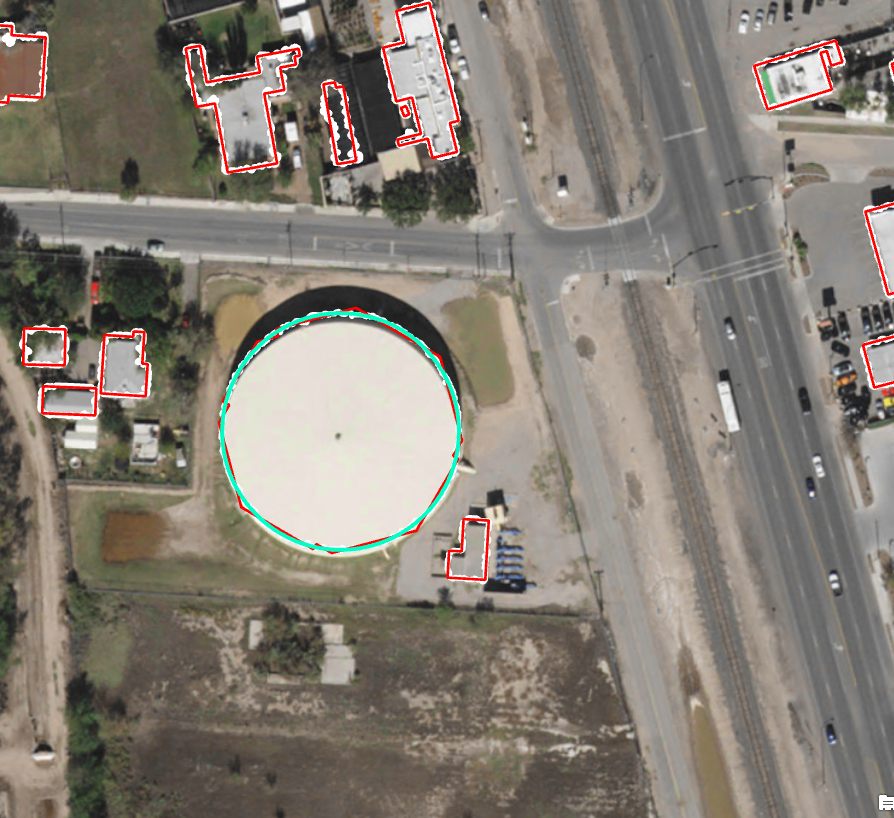
Below in white is the original raw lidar extracted buildings and Aqua Green is the CircleBuildings extracted. The Red are the Buildings output. The buildings under the circlebuildings will need to be deleted
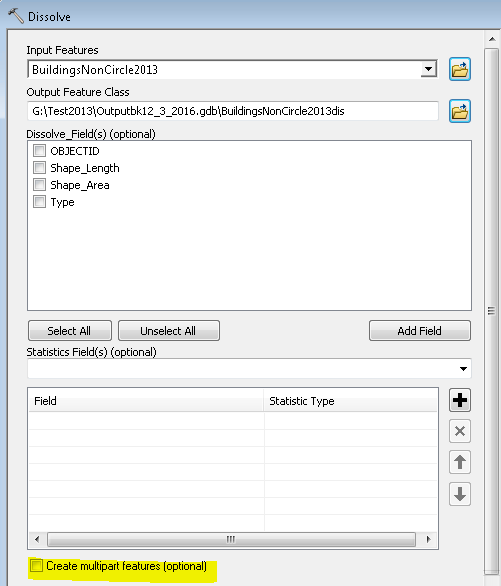
1. To use this tool, first run a Dissolve on your features with multipart turned off.
2. Download and unzip the attached file Clean Extracted Buildings Using Regularize Building Footprint Tool.zip
Run the "1. Regularize Building Footprints For Circle (Feet Projection)" tool inside first.
3. Run the "2. Regularize Building Footprints All Non-Circle (Feet Projection)" next.
4. Review your CircleBuildings output first, the should not be that many and you need to check to see if they are actually
circles. If not, delete. This should collect tanks, round buildings, gazebos, etc. If a building is not completely round,
but is like a hexagon or something similar, try using the generalize button in editing with a 1 or 2 or 3 to get the sides
straight as a hexagon or octagon. Add addition circle structures you see, often they are near each other. Save when
done.
5. Add your Buildings featureclass and select by location those with there centroid in the CircleBuildlings, then delete.
6. Review your buildings. If you have general extraction issues, please look at the type of building. Go into the "2.
Regularize Building Footprints All Non-Circle (Feet Projection)" tool and adjust those settings using the
Regularize Building Footprint tool help.
Included is some sample data and the output before being reviewed manually. You can see some stair stepping in the
features comes through. This is due to the tool only set to handle Right and Diagonal Angles for Large and Medium
buildings types (See field call Type). The TotalProcess field in the Buildings featureclass shows you the processes
used. Example: "Regularized, Simplified, Simplified, Simplified, Simplified" means that it had a Regularized Building
Footprint tool with an output of Regularized, then it was simplified using a 2, 4, 6 and 8 Simplify Buildings tool.
* Issue found with Clean Extracted Buildings Using Regularize Building Footprint Tool not working if there are no large buildings (over 25,000 sq. feet), looking into how to fix this.
Manual Process outlined to help you if you want to better understand what the tool is doing:
First start with extracting the circles from your data. I usually run a county or two at a time with this.
Run Circles first seven times – Regularize Building Footprint with Tolerance 2, 4, 5, 6, 8, and Tolerance 12 and
the definition queries below:
Tolerance 1.6 with the raw vectors using a definition query of Shape_Area <= 220 AND Shape_Area > 175
Tolerance 1.8 with the raw vectors using a definition query of Shape_Area <= 240 AND Shape_Area > 220
Tolerance 2 with the raw vectors using a definition query of Shape_Area <= 1400 AND Shape_Area > 240
Tolerance 4 with the raw vectors using a definition query of Shape_Area <= 2500 AND Shape_Area > 1400
Tolerance 5 with the raw vectors using a definition query of Shape_Area <= 3000 AND Shape_Area > 2500
Tolerance 6 with the raw vectors using a definition query of Shape_Area <= 8000 AND Shape_Area > 3000
Tolerance 8 with the raw vectors using a definition query of Shape_Area <= 12000 AND Shape_Area > 8000
Tolerance 12 with the raw vectors using a definition query of Shape_Area > 12000
Merge the output to BuildingsCircle and then apply a definition query of STATUS = 0. This should work to auto extract circles.
I suggest reviewing the circles to make sure they are correct, deleting any that are not.
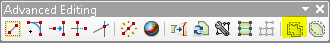
You will want to start editing on the merged circles, select all and using the generalize with a input of 0.1 foot.
This turns the perfect circles to ones with vertices that are used as input for Local Government Scenes.
Select the raw extracted buildings that are not circles using Select by Location. Run a Dissolve with Create mulitpart features clicked off.
Divide into three groups by size below and run through Regularize Building Footprint with the values below:
•Small: "Shape_Area"< 5000 sq. feet
Right_ANGELS Tolerance2, Densification2, Precision 0.25
•Medium: "Shape_Area" >= 5000 AND "Shape_Area" <= 25000 Right_ANGLES_AND_DIAGONAL Tolerance3, Densification3,
Precision 0.25, Diagonal Penalty 1.5
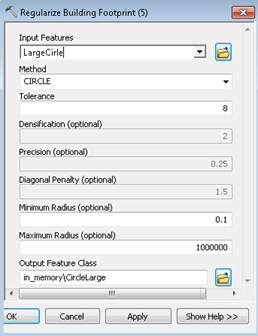
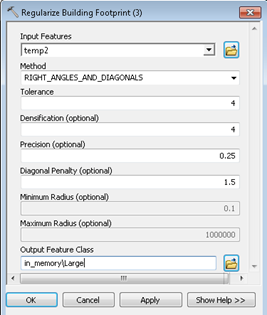
Large: "Shape_Area">= 25000 Right_ANGLES_AND_DIAGONAL
Tolerance 4, Densification 4, Precision 0.25, Diagonal Penalty 1.5
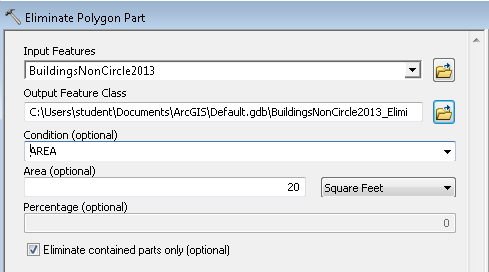
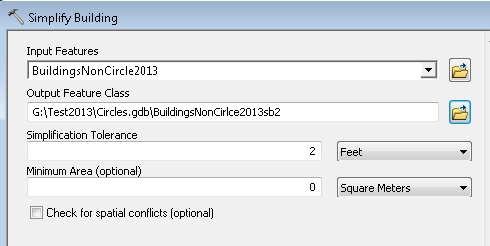
After running these groups, merge the result to BuildingsNonCircle and run dissolve on the features. Run a Eliminate Polygon Part on the features with at least a 20 Square Feet and Eliminate contained part only. This is to get rid of interior holes in the cleaned polygons. Run a Simplify Buildings with Simplification Tolerance 2 and then again with that as the input with a Simplification Tolerance 4.
Merge your circle buildings and the BuildingsNonCirclesb4 to get your finished buildings. Start reviewing buildings against imagery/lidar to find errors (there will always be errors it seems like).
Extracting Buildings and Trees from Lidar
Here is also a tool for Building and Tree Identification from Lidar developed by Joe McGlinchy and Roslyn Dunn. It's a work in progress and only works with ArcGIS Desktop 10.3.1 currently. It collects building footprints and circle trees that can be run through the Regularize Building Footprint Tool above.
Another tool for extracting trees I developed uses Lidar and NAIP imagery is here. A version for Pro is attached (Trees From LIDAR and NAIP_Pro).
Adding Color to Roofs of Buildings for display in ArcGIS Pro (Scene Viewer)
Adding color to roofs in ArcGIS Pro really makes the scenes look more realistic with Local Government Scenes. Over a year ago, I developed a model to add hex colors to buildings as a field to display in ArcGIS Pro. With the Local Government Scenes process, you can use a field with a Hex Color to get colors added to display in ArcGIS Pro using their layers. I often use two sources of imagery from different times and use one for the roof, then another for the side color (add another field called side color). Though using it for the side color is ideal, it's an easy way to color buildings in mass.
Instructions:
1. Clip leaf off high resolution imagery to the area where you have buildings you wish to add color.
2. Resample to 3ft or so, this will allow the Segment Mean Shift tool to run much faster.
3. Run Segment Mean Shift on the leaf-off imagery with defaults parameters.
4. Run the Add Hex Color From Imagery to Roofs 10.4 or ArcGIS Pro Add Hex Color to Roofs (attached below).
5. Download the Old Local Government Scenes layer files (attached below zipped) and unzip.
6. Move your buildings to the 3D in scene in Pro and click on properties to set elevation to absolute.
7. In Pro, run the Apply Symbology from Layer using the LOD2BuildingShellsFloors_feet.lyrx or LOD2BuildingShells_meters.lyrx in the OldLocalGovernmentScenesLayerFiles directory that you unzipped. The new version of the Local Government Scenes does not have color for building roofs or building sides, this will likely be changed in future versions.
7. Set the roof color to your hex color field in the symbology and apply.
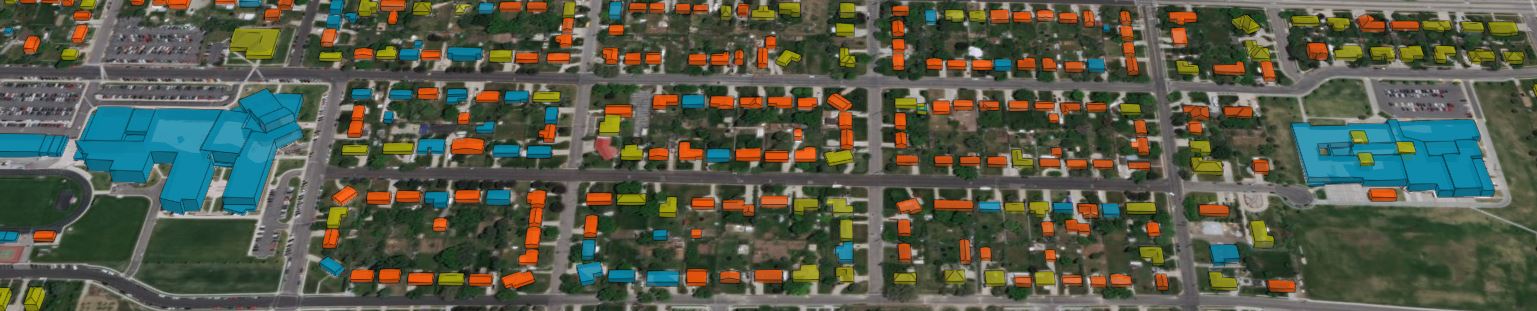
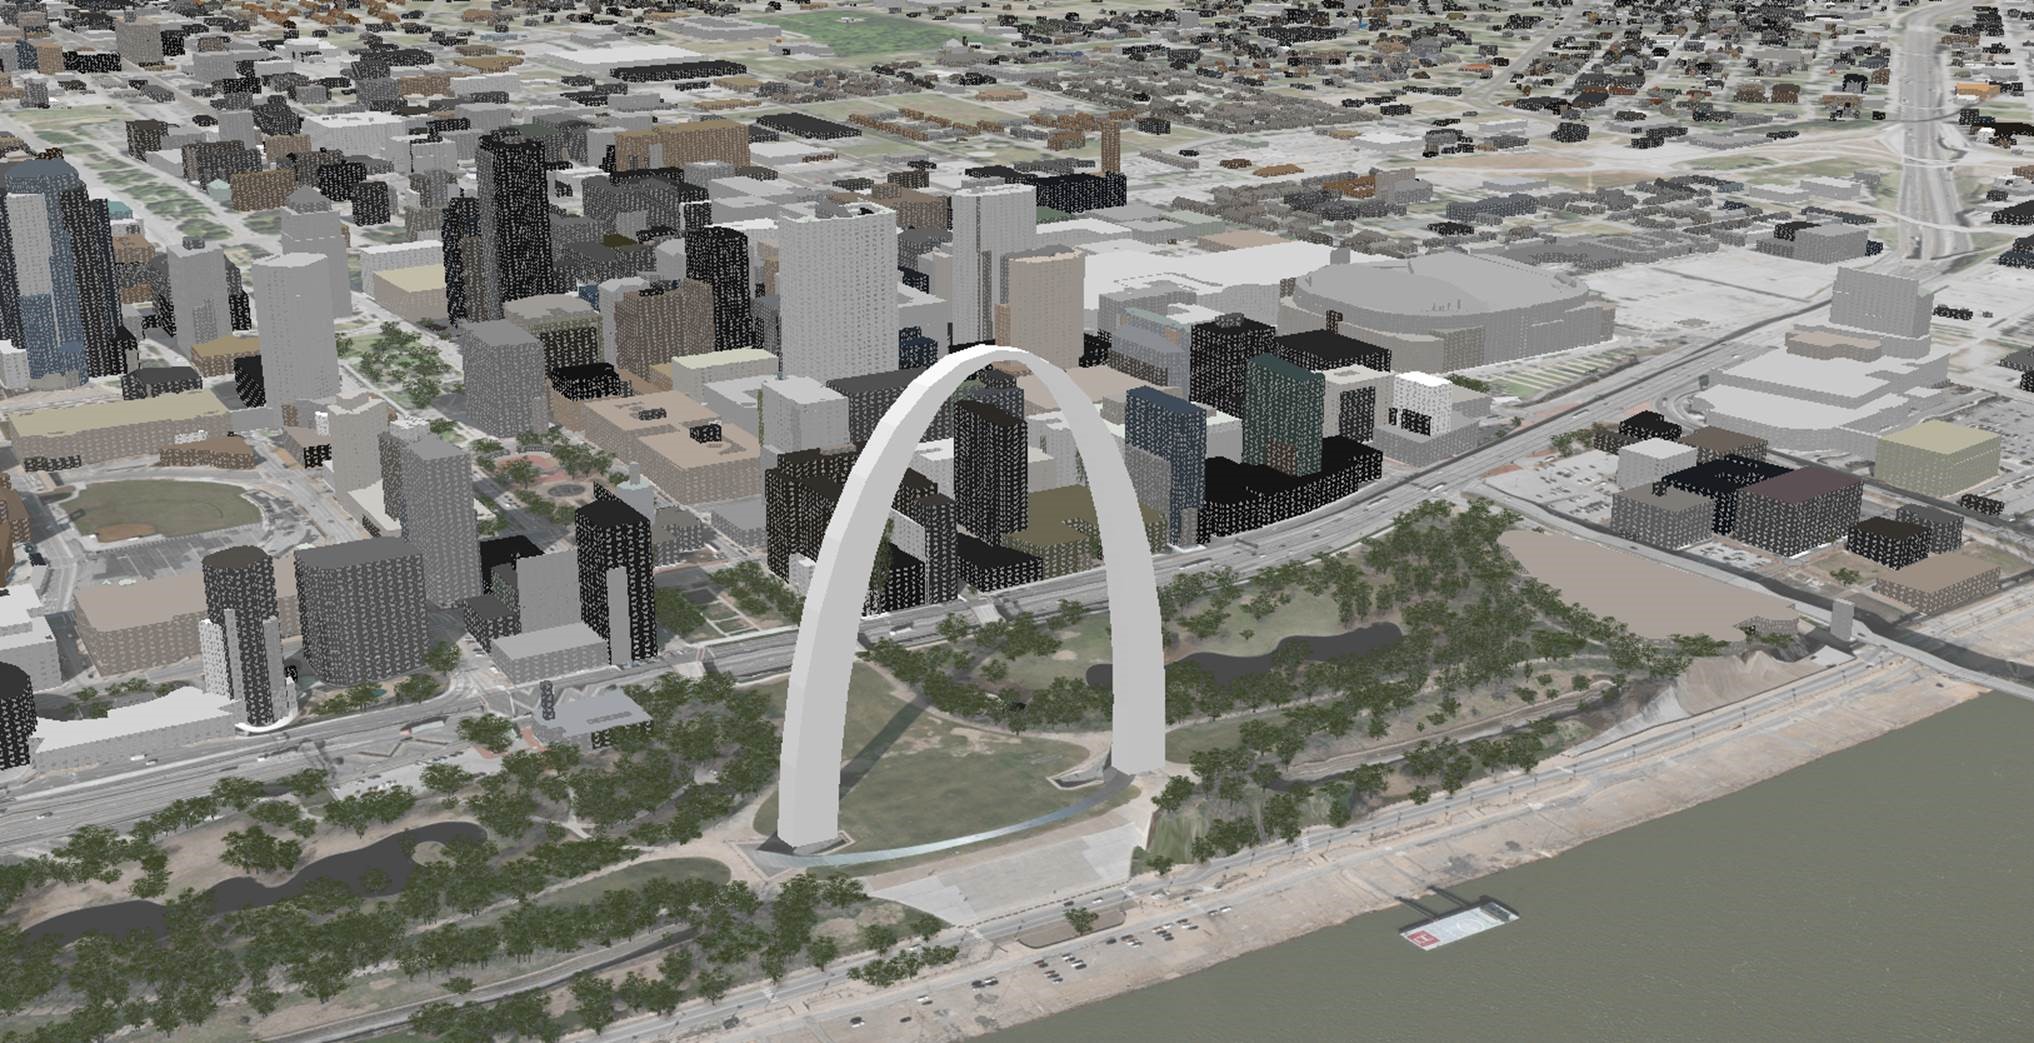
Below is St. Louis in 3D with color added to the buildings. The Arch was the only feature drawn. All building colors were applied through imagery using the process above. Trees were extracted using the Trees From LIDAR (here). Buildings were segmented using Segment Mean Shift tool on a reclassified DEM clipped to the building footprints and then converted to polygons. This gives the 3D buildings multiple heights for different sections. Add Hex Color From Imagery to Roofs was run on individual polygons for the different roof parts.
Here's an another example over St. Charles, County, MO. They recently made their data Open Data through MSDIS and the next weekend I processed 160,000 buildings to 3D using Local Government Scenes with a model around it to run in batch(Scene Viewer). For the Building Side colors, I used this formula to calculate a color off the roof colors. The side colors are not correct, but it gives it a more realistic view.
"#" + hex(int(((int(!HexColor![1:3],16))-random.randrange(30)+20)*-1))[-2:] + hex(int(((int(!HexColor![3:5],16))-random.randrange(30))*-1)+20)[-2:]+ hex(int(((int(!HexColor![5:7],16))-random.randrange(30))*-1)+20)[-2:]
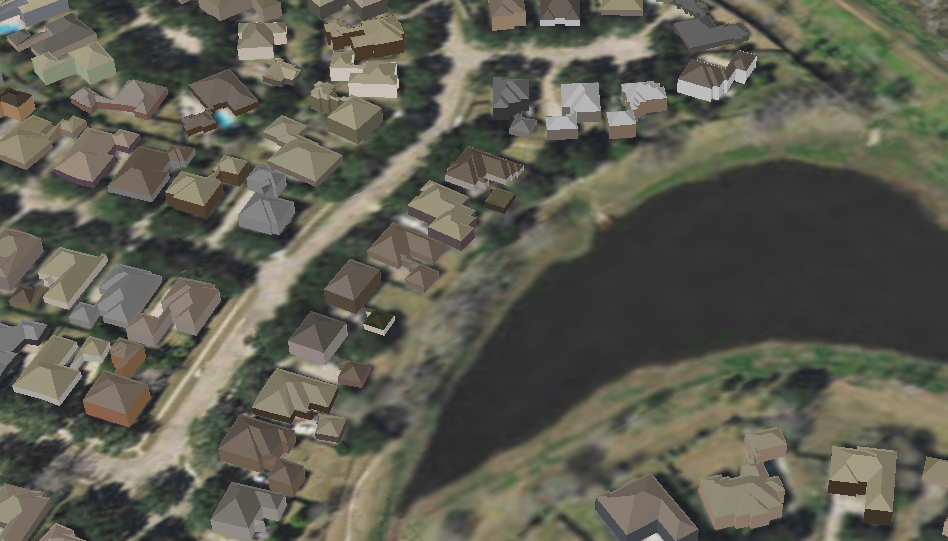
Another option is to use real side of buildings color. To do this, start with an image search on a web browser for houses in the area you are doing. You can then capture the images, georeference them side by side in ArcMap and mosaic them together. Run Segment Mean Shift on the mosaicked image and then create a featureclass to put fake buildings over the areas you want to get colors from. Run the Add_Hex_Color_From_RGB_Imagery_to_Roofs_10.4 tool on those buildings and then export it out to a table. Look at how many records are in the table, add a field to buildings called join and calculate it with a random number equal to the number of records in the table (import random in code block, random.randint(1,100) , 100 being the number of records). Then add a field to your building called side color and calculate it after doing a join with the table using the objectid and join field. Use this field as input to the symbology fo the sides of the buildings. An example is below of this for Fort Bend, TX, where we extracted the buildings footprints from lidar, ran them through the Local Government Scenes and then applied color to roofs from imagery and the side colors randomly.
Fort Bend County, TX, in 3D:
St. Charles in 3D Scene Viewer
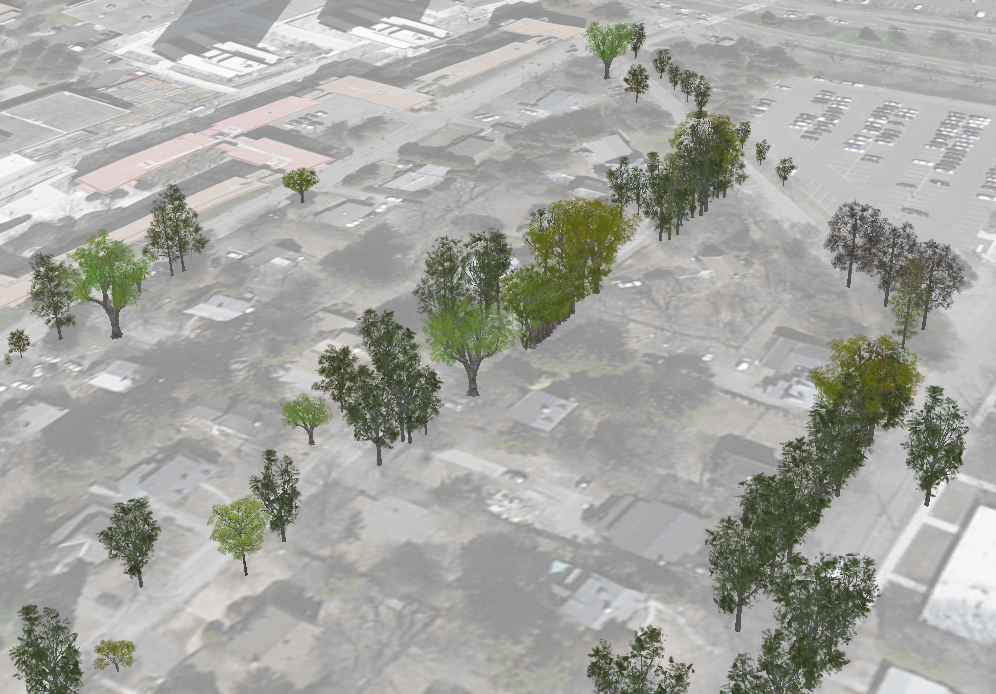
Taking your Tree Inventory and Displaying it in 3d in ArcGIS Pro:
A while back a local park asked me about what to do with their new Tree Inventory to their board that was delivered as a point featureclass with genus. I suggested to show it off it using ArcGIS Pro in 3D. Below are instructions for adding a height to the tree points from Lidar and then calculating a field for the Genus from the scientific name. By calculating the height and a field with just the Genus, you can display the trees in 3D in Pro easily. Here's a link to all the trees available:
Supported tree genus types—ArcGIS Pro | ArcGIS for Desktop
With the trees, having it driven by Genus means that a Silver Maple (Acer saccharinum) will be show in the field as just "Acer" to drive symbology. With the link above, you can see that Acer will be shown as a Sugar Maple tree. It's close enough usually to give a good representation of the tree type.
Looking through research, it seems getting the height of a tree from the DBH does not work great. So, I would suggest to use the Lidar or the height if it's in the Tree Inventory. The only issue with this I came across was newly planted trees that the lidar did not have in it or we smaller when the lidar was done.
- Review the points, you will likely want to reproject the points to the same as your lidar.
- First step was to download the LAS file of the area
(lidar format of data). - Second Step was to create a las dataset with the las
files. - Next we used the LAS Point as Statistics as Raster using Z_Range
method to get a DEM of the heights of the trees. - I ran a Focal Statistics tool with Max of 3 circle to
get the spread of the highest point so it intersects the point. - Ran Add Surface information to get the Z from the
raster to the Tree Inventory points, this is the height of the tree. - Add a field call Genus and calculated the field using
the Scientific name. ArcGIS needs
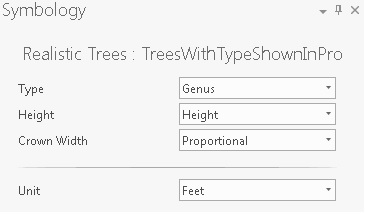
an input of the Genus only, so I used the this vb script in 10.4 to do this from the Scientific name in python (ArcGIS Pro) !BOTANICAL!.split(' ',1)[0] or vb script Split([BOTANICAL] , " ",2)(0) - Opened ArcGIS Pro Scene and add the trees as Add Preset layers
Realistic Trees using that field Genus, you get a more correct symbology
for the trees and the height field. This does not work with all of your
trees, but many are supported.
Again, you can see the ones supported at this link: Supported tree genus types—ArcGIS Pro | ArcGIS for Desktop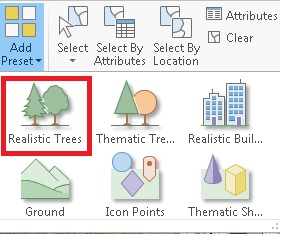
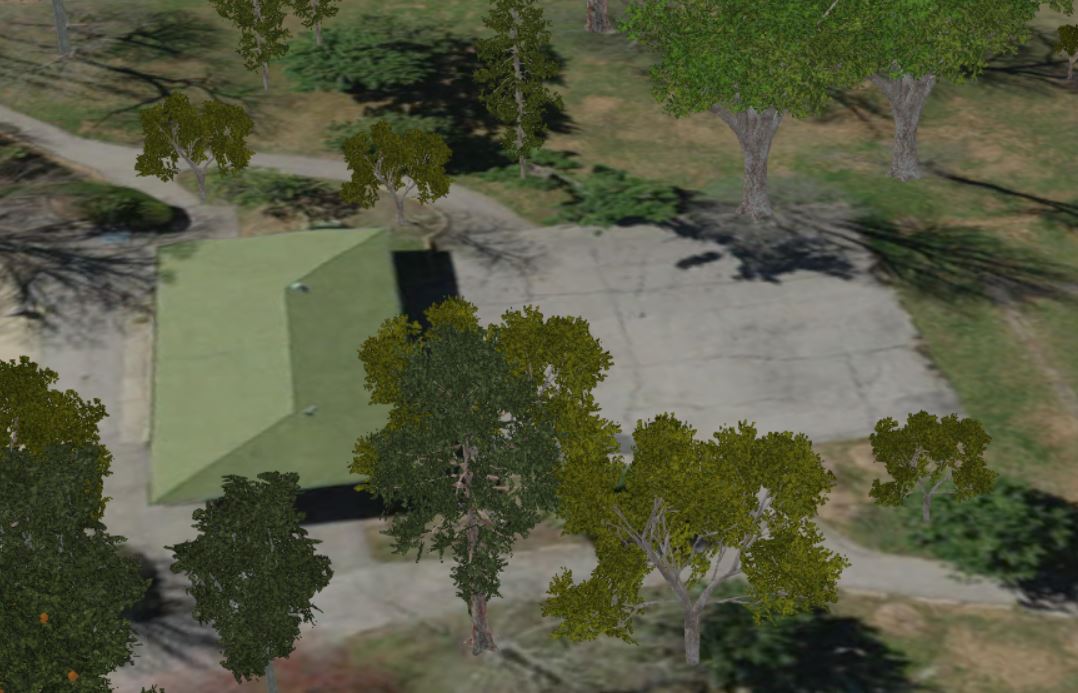
- Add imagery and review your trees to make sure they look correct. A common error is the height may be in meters or feet, but I had choose the wrong one.
Here's some data I tried it with from Amherst, MA with the source data and a subset processed attached called SubsetOfAmherstMATreeInventory2010.zip :
Tree Inventory: http://www.arcgis.com/home/item.html?id=4eaa4f8ceecf47cc89ea5726ddbcaad7
Lidar: http://www.arcgis.com/apps/Legend/main/index.html?appid=d6226fcfd1844e9fb45303e5aa41b730
Another one to look at is Tower Grove Park in St. Louis, MO. The scene has over 6,000 trees rendered. Some trees do not come in with the correct genus and show as white.
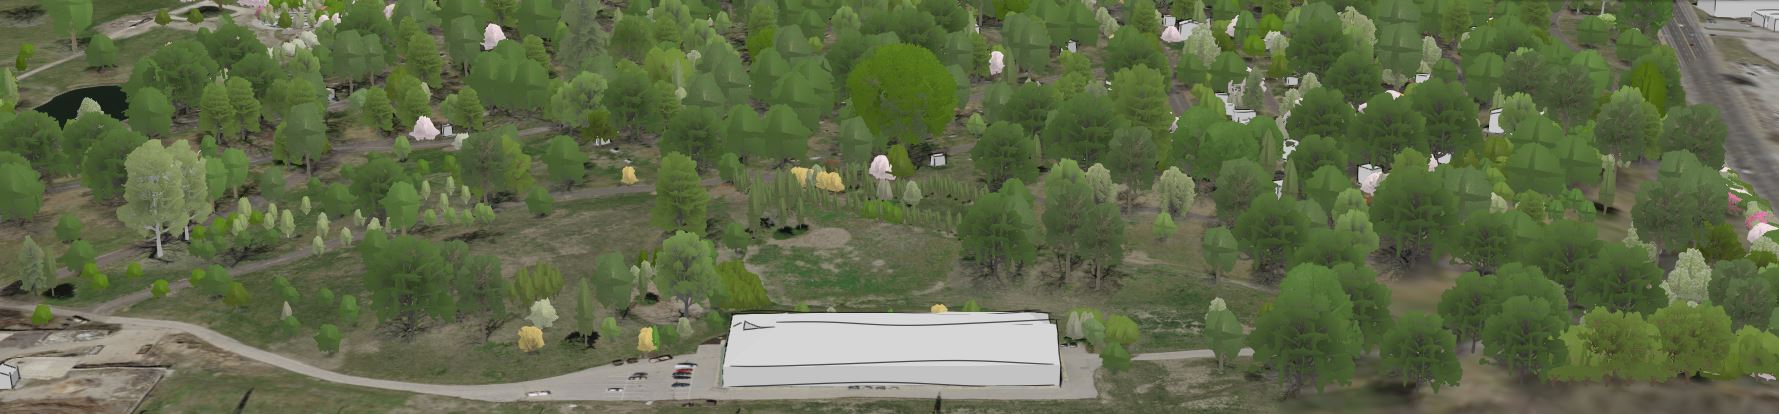
Making your tree inventory become 3D without lidar? (hint DBH)
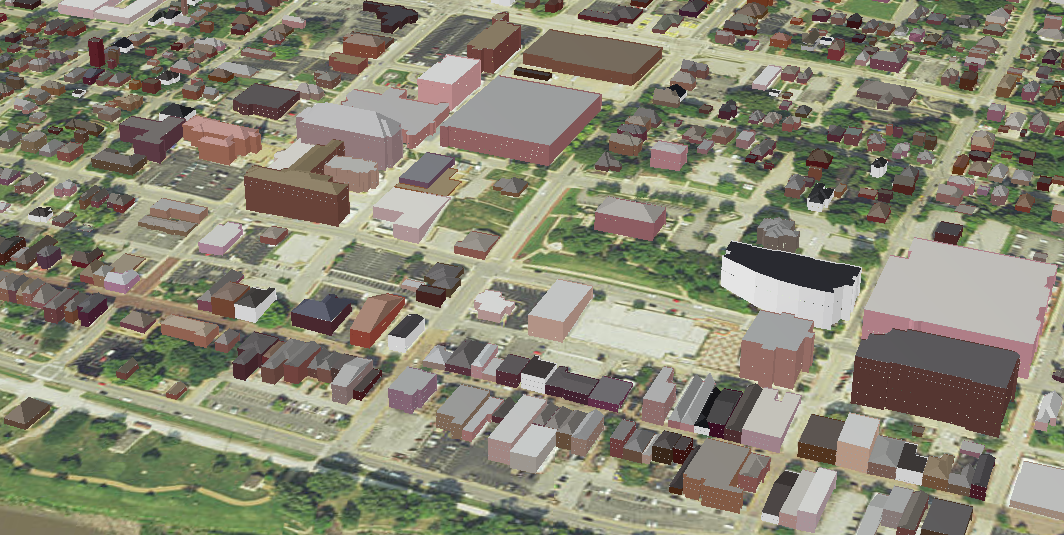
I received some tree inventory data from Bellefontaine Cemetery here in St. Louis, MO. I used a join with similar trees to the scientific genus name the Missouri Botanical Garden has done for their trees to render in 3D. Esri supports about 60 genus of trees for 3D rendering. Then I had used the lidar to get a simple formula to convert the DBH (Diameter at Breast Height) to tree Height. It's not accurate, but rendered the trees fairly well. There are very complex formulas out there I might investigate further to tie DBH to height, this might allow many tree inventories to be come 3D easily. The table to calculate a similar genus is below with the other downloads called MissouriBotanicalGardenSubstitutesForTreeGenus.txt.
Scene showing trees made 3D using a formula applied to the DBH ((DBH x 2)+20). 5,150 of the 9,153 tree's genus were supported using the 63 genus types supported by Esri ArcGIS Pro. 2,120 trees did not match the support genus for rendering, but a table was used supplied by the Missouri Botanical Garden for like trees genus. The trees in white were not supported or mapped over for genus symbology, this included 1,883 trees and shrubs. To Calculate Genus, I used the SPP field (Scientific Name) with !SPP!.split(' ',1)[0]
Scene Viewer - Be sure to turn on the lidar to see how close or not close the trees are in height.
Arthur Crawford - Esri
Special thanks to St. Charles County, Monica Balestreri, MSDIS, Michael Owen, Town of Amherst (MA), Dan Hedges, Joe McGlinchy, Roslyn Dunn, Thomas Maurer, Hua Wei, Jeff Liedtke, J. D. Overton, Khalid Duri, David Altergott, Tower Grove Park, Andy Watson and the others who have help me.
You must be a registered user to add a comment. If you've already registered, sign in. Otherwise, register and sign in.
-
Analysis
10 -
ArcGIS Drone2Map
3 -
ArcGIS Excalibur
1 -
ArcGIS Image Analyst
1 -
ArcGIS Image for ArcGIS Online
1 -
ArcGIS Pro
1 -
Change detection
1 -
Deep learning
4 -
Elevation and lidar
8 -
Image classification
1 -
Image management
2 -
Image Mapping
8 -
Image Services
3 -
Mosaic datasets
4 -
Motion imagery
10 -
Multidimensional
2 -
Oriented Imagery
2 -
Raster functions
4 -
Site Scan for ArcGIS
1 -
Visualization
9
- « Previous
- Next »