GIS Life Blog - Page 2

cancel
Showing results for 
Show  only  | Search instead for 
Did you mean: 

Latest Activity

(450 Posts)
BernSzukalski
Esri Frequent Contributor

It's easier than ever before to make meaningful maps quickly.

Read more...

more
0 1 1,520
GavinRehkemper
Esri Contributor

Typically the Feature Form widget is used within a side panel, like in this sample.

But what if you want a slightly different workflow where the user draws their boundary and then is prompted with a popup to fill out. We can combine the Sketch widget and the Feature Form widget within a Modal for that effect:

Read more...

more
2 0 838
BernSzukalski
Esri Frequent Contributor

A great post from @AndrewSkinner  about using the new blending tools in Map Viewer Beta. Another good reason to start working with Map Viewer Beta if you haven't found enough reasons already.

Read more...

more
0 0 635
BernSzukalski
Esri Frequent Contributor

On August 4, 2020, a massive explosion gutted buildings and crumbled neighborhoods surrounding the port of Beirut, Lebanon, after a warehouse containing 2,750 tons of ammonium nitrate ignited. Maxar published imagery post-blast, and a swipe app was created to view before and after.

Read more...

more
0 0 1,051
AndresCastillo
MVP Regular Contributor

At first glance, the two look so familiar (at least to me).

Yet per the documentation:

A record set is of the 'dataset' parameter data type, is transportable, and supports the User defined value input mode for GP task settings.

The schema of a record set contains the definition of one or more fields:

When the model tool dialog box is opened, records and attributes can be entered.

A quick tour of using Feature Set and Record Set—Help | ArcGIS Desktop 

A Value Table is a parameter of a GP tool that uses a multicolumn table of the 'Value Tables', are non-transportable, and their Input mode will be fixed to Constant value for GP task settings.

The task will use the value you supplied for the parameter when you created the GP result.

it will not become a task parameter when the service is published.

If you need your client to enter values rather than using the constant value, you'll need to modify your model or script so that it uses other data types besides Value Table.

Input modes and parameter data types—Documentation | ArcGIS Enterprise 

more
0 0 355
BernSzukalski
Esri Frequent Contributor

Unlike other Esri products, ArcGIS Living Atlas of the World is truly many moving parts continuously updating independently on their own schedule. Living Atlas News is an attempt to capture what's been going on. Check it out here: ArcGIS Living Atlas News (July 2020).

Read more...

more
0 0 482
AdamCarnow
Esri Regular Contributor

The 2020 Virtual Esri International User Conference starts Monday, July 13, 2020.  I hope to virtually meet you there.  If you would like to connect, here are some opportunities:

  • Incorporating Business Value in Your GIS Strategy - Streaming Live, Tuesday, July 14, 2020, 1:40 PM - 2:40 PM PDT
    • Aligning your GIS strategy with your Business goals and objectives will allow you to more effectively address the most pressing needs of your organization. But how do you do that? On top of this, business leaders don’t usually speak in the “language of GIS”, which challenges you to interpret business challenges, and translate them into GIS opportunities. This session will cover strategies for gaining leadership sponsorship, how to determine and measure the business value of your GIS, and considerations for how to communicate that value throughout your organization
  • Two On-Demand Sessions:
    • Evangelizing GIS
      • Getting your workforce to adopt new technology and new workflows requires winning hearts and minds across the organization. Learn how the right communication strategy creates a common vision and momentum to accomplish positive change.
    • Communicating the Value of GIS in Your Organization: How to Measure Return on Investment
      • Understanding, documenting, and communicating the value GIS brings to your organization can be critical to your success. First, presenting the return on investment (ROI) from your programs’ and projects helps celebrate the success of the departments using GIS. This process oftentimes stimulates ideas across an organization as to the uses of spatial thinking and GIS technology. Secondly, it reinforces the investment in technology, people, and equipment to improve government services. Quantified ROI is good to have on hand during budgeting periods, too. Finally, measuring the real benefits of GIS can act as an accountability tool for yourself. It provides a self-check as to whether your program is in sync with or meeting organizational goals. This session will seek to provide guidance on documenting and reporting the business value of GIS. Topics will include Measuring the benefits of GIS; Calculation methods; Examples of success; and Techniques for communicating success.
  • In the Expo - I will be working in the Esri Showcase at the Smarter Government Starts Here booth in the Executive Engagement & Public Policy section.  I am scheduled to be there the following days/times:
    • Monday, July 13, 2020, 12:00 PM - 1:30 PM PDT & 3:00 PM - 4:00 PM PDT
    • Tuesday, July 14, 2020, 7:30 AM - 10:00 AM PDT, 11:00 AM - 12:00 PM PDT & 3:00 PM - 4:00 PM PDT
    • Wednesday, July 15, 2020, 7:30 AM - 10:00 AM PDT & 11:00 AM - 4:00 PM PDT
  • We can also connect using the Networking portion of the platform
  • And of course I am available on LinkedIn and Twitter as well as here on GeoNet

Hope to "see" you there!

more
0 0 1,028
Egge-Jan_Pollé
MVP Regular Contributor

EggeJan_Poll_0-1711390386693.pnghttps://community.esri.com/people/EPolle_TensingInternational/blog/2020/03/24/arcgis-javascript-with... 

Setting x, y and zoom level in url to retain map view

When you zoom in on a particular location on a map, you sometimes wish you could retain that map view, e.g. to share it with someone else. That's why we were looking for a way to get the x, y and zoom level from the search parameters in our url. But not only do we want to be able to read the values from the query string (i.e. everything behind the question mark), we also want to be able to set them, and to modify them whenever the map view changes, i.e. when the user pans and zooms around on the map.

Below is a description of the functionality we use to grab the x an y coordinates (in British National Grid, rounded to the full meter) and to modify the url.

URLSearchParams and History.replaceState()

The URLSearchParams interface defines utility methods to work with the query string of a URL. In the example below we use the following methods of this interface:

  • The has() method indicates whether a parameter with the specified name exists
  • The get() method returns the (first) value associated to the given search parameter
  • The set() method sets the value associated with a given search parameter. And very important: if the search parameter does not yet exist (which might initially be the case), this method will create the search parameter.

The History.replaceState() method modifies the current history entry. This method is particularly useful when you want to update the URL of the current history entry in response to some user action, e.g. the panning and zooming mentioned before.

And this is how it works:

If you provide the url without any parameters, you will start at the Default map view. But as you will see, the default parameters are added immediately to the address bar:

https://twiav.nl/en/arcgis/javascript/arcgis_javascript_with_uk_data_url_parameters.htm

And as soon as you start zooming and panning around, these parameters will be adjusted every time the view becomes "stationary" (we do use reactiveUtils to check the state of the view, stationary or not),

In this way, you can zoom in to a particular spot and copy the url to make sure to share exactly that map view.

If you click on the link below you will immediately end up in Steòrnabhagh  (or Stornoway in English, we are using the Web Map GB Cartographic Local Names here), on the island of Lewis and Harris in the Outer Hebrides:

https://twiav.nl/en/arcgis/javascript/arcgis_javascript_with_uk_data_url_parameters.htm?x=143956&y=9... 


Happy coding!


The code


<!DOCTYPE html>
<html>
<head>
  <meta charset="utf-8">
  <meta name="viewport" content="initial-scale=1, maximum-scale=1, user-scalable=no">
  <title>ArcGIS JavaScript with UK data - URL Parameters: x, y and zoomlevel</title>
  <link rel="stylesheet" href="https://js.arcgis.com/4.29/esri/css/main.css">
  <script src="https://js.arcgis.com/4.29/"></script>
  <style>
    html, body, #viewDiv {
      padding: 0;
      margin: 0;
      height: 100%;
      width: 100%;
    }
  </style>
  <script>  
      require([
        "esri/Map",
        "esri/geometry/Point",
        "esri/views/MapView",
        "esri/widgets/Home",
        "esri/Viewpoint",
        "esri/core/reactiveUtils"
      ], function(Map, Point, MapView, Home, Viewpoint, reactiveUtils) {

      var sr = 27700;
      var xCoordHome = 500000;
      var yCoordHome = 500000;
      var zoomLevelHome = 5;
      var scaleHome = 4612360;

      var xCoord = xCoordHome;
      var yCoord = yCoordHome;
      var zoomLevel = zoomLevelHome;

      if ('URLSearchParams' in window) { // Feature detection (URLSearchParams is not supported by Internet Explorer)
        var url = new URL(document.URL);
        var search_params = url.searchParams;
        // get searchparams if x, y and l are provided in url
        if(search_params.has('x') && search_params.has('y') && search_params.has('l')) {
          var xCoord = parseInt(search_params.get('x'));
          var yCoord = parseInt(search_params.get('y'));
          var zoomLevel = parseInt(search_params.get('l'));
        }
      };

      var map = new Map({
        basemap: {
          portalItem: {
            id: "5b9d5ac7e17f402a9111f1ca2c22bf56"
            // GB Cartographic Local Names, hosted by EsriUKContent, see: https://www.arcgis.com/home/item.html?id=5b9d5ac7e17f402a9111f1ca2c22bf56 
          }
        }
      });

      var view = new MapView({
        spatialReference: sr, 
        container: "viewDiv",
        map: map,
        center: new Point({x: xCoord, y: yCoord, spatialReference: sr}),
        zoom: zoomLevel
      });

      var home = new Home({
        view: view,
        // viewpoint of home needs to be defined (hard coded) because otherwise this home depends on the x, y and l values in the searchparams
        viewpoint: new Viewpoint({targetGeometry: new Point({x: xCoordHome, y: yCoordHome, spatialReference: sr}), scale: scaleHome})
      });

      view.ui.add(home, "top-left")

      reactiveUtils.when(
        () => view?.stationary === true,
        () => {
          modifySearchParams();
        });

      //modify url with new coords and zoomlevel as searchparams
      function modifySearchParams() {
        if ('URLSearchParams' in window) { // Feature detection (URLSearchParams is not supported by Internet Explorer)
          xCoordNew = parseInt(view.center.x);
          yCoordNew = parseInt(view.center.y);
          zoomLevelNew = view.zoom;
          search_params.set('x', xCoordNew);
          search_params.set('y', yCoordNew);
          search_params.set('l', zoomLevelNew);
          url.search = search_params.toString(); // change the search property of the main url
          new_url = url.toString(); // the new url string
          history.replaceState(null, '', new_url);
        }
      }
    });
  </script>
</head>
<body>
  <div id="viewDiv"></div>
</body>
</html>


more
0 0 594
GavinRehkemper
Esri Contributor

In part 1 of the series, we used TSDX to create a TypeScript+React Component, installed it into the Experience Builder client folder, and included the Component in a custom widget. The widget did not actually do anything though. In this post, we'll go through how to using ArcGIS API for JavaScript within the component, how to interact with the Map object, and how to pass in configuration settings from Experience Builder.

Create a Map in the TSDX Example Page

Right now, the Example App (what shows when you run npm start in the example folder) is totally empty except for your widget. In an Experience Builder app, your widget will most likely be interacting with other widgets like the Map widget. To mirror this situation in the Example App, we need to include the ArcGIS API for JavaScript directly and create a map object on the page.

Lets start in the example directory of your TSDX project. Within there, the structure of components will be:

  • /example
    • index.tsx - already existing main file. We'll update this to contain the Map and Wrapper (below).
    • /components
      • Map.js - a React component responsible for creating and displaying the ArcGIS API for JavaScript Map object. Pass in a function (viewReady) to be called when the map is ready and can pass a reference to the View back up to index.tsx.
      • Wrapper.js - The equivalent to our custom Experience Builder widget, in that it "wraps" our custom component. index.tsx passes a reference to the mapView that it gets from Map.js.

Map.js

To include the ArcGIS API for JavaScript map on the page, we will use the esri-loader and esri-loader-hooks packages. To install these dependencies, browse to the example directory in your terminal then run: npm install --save esri-loader esri-loader-hooks

The entire contents of Map.js can be found here. At a high level, we're creating a DOM Node Reference, passing it to useMap (from the esri-loader-hooks library) to create the map, and using useWatch (also from the esri-loader-hooks library). Within the onUpdateChange function, the line const [FeatureLayer] = await loadModules(... is loading the FeatureLayer module from the ArcGIS API for JavaScript so we can use it to create a layer and add to the map.

Finally, at the end of the useWatch function, we call viewReady(view) as a "callback" to the parent component to give it a reference to the MapView (view variable) that we created here in this component.

index.tsx

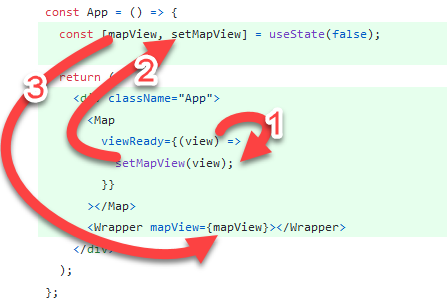
In index.tsx, we're importing the two components Map and Wrapper and including them in the JSX. The mapView is passed from the Map component to the Wrapper component via React state (see the setMapView call in the function that is passed as a prop to the Map component).

Also in index.tsx, we've created a CSS file and are importing it - basically making the map the full size of the page and hovering the widget over the top of it.

Wrapper.js

Wrapper.js is the equivalent of the custom Experience Builder wrapper widget that we will build. It is a light-weight "wrapper" and includes our component directly.

The first prop that we pass into our component is the mapView - that comes directly from the parent component, index.tsx.

We will use the Experience Builder infrastructure to load any ArcGIS API for JavaScript modules we need to use, so this widget should mirror that. To do this, we use the loadModules module from esri-loader and load whatever we want and pass it into our component as the second prop, modules.

Our widget is going to operate on a Feature Layer, so the third prop is the string ID of the Feature Layer we're working with. In this example app we know it because we created the Feature Layer ourselves in Map.js, but in Experience Builder that will be configured in the Builder interface and will be passed into our component from the config.

package.json

One last step is to include the browserslist property in your package.json file. This fixes an error that happens because the app is trying to support older browsers.

All the changes for this step are summarized here.

Update the Component

Since we'll be using the ArcGIS API for JavaScript, first we setup our component to use the type definitions. First run:

npm install --saveDev @types/arcgis-js-api

Then add this as the first line to src/index.tsx:

/// <reference types="@types/arcgis-js-api" />

This tells the TypeScript compiler to use these types, and now you can use the variable __esri to refer to any types in the ArcGIS API for JavaScript.

Next, build out the new functionality for your widget. This is where your widget will deviate from our example. In our example, we're creating a Sketch widget and doing a query against the Feature Layer to find the number of intersecting features after each drawing. Full code is here.

Update the Experience Builder Widget

In part 1, we created a basic wrapper around the component, which did not take any props as input. In this part 2, the component will now take three props: the MapView, the modules, and the Feature Layer ID. We added these to the Example App above, and similarly they must be added to the Experience Builder widget.

Unlike the Example app above where we had to install and import esri-loader (to get access to the ArcGIS API for JavaScript) and create a map, in Experience Builder we already have those - you can simply drag the Map object into the Experience. We do have to configure the custom widget to know which map widget it should operate on, so that's what we'll do first.

Start up Experience Builder and setup your custom widget per the instructions in part 1.

Then, in your Experience, add a Map widget. You probably want to choose a web map that contains the layer you're using in the Example App, but not totally necessary.

Next, create a Settings panel to allow the Experience Author to choose the Map and LayerID. To do this, create src/settings/settings.tsx and other required files, and use the JimuMapViewSelector and the JimuLayerViewSelector. Full code is here.

completed settings panel

Next, update the widget code (src/runtime/widget.tsx) to pass in the props to the component. I'll go through each of the three props below.

1. MapView

When the user chooses a Map in the Settings panel that we created above, the config useMapWidgetIds gets set. To use this to get the MapView in the widget, use the JimuMapViewComponent to put the jimuMapView into state it can be used.

{this.props.hasOwnProperty("useMapWidgetIds") &&
  this.props.useMapWidgetIds &&
  this.props.useMapWidgetIds.length === 1 && (
    <JimuMapViewComponent
      useMapWidgetIds={this.props.useMapWidgetIds}
      onActiveViewChange={(jmv: JimuMapView) => {
        if (jmv && jmv.view) {
          this.setState({
            jimuMapView: jmv,
          });
        }
      }}
    />
  )}

After that is set, we can update the component, passing in this state:

<MyWidget
  mapView={this.state.jimuMapView ? this.state.jimuMapView.view : false}

2. featureLayerId

Similar to above, the Feature Layer ID gets set in the Settings. This one is simpler than JimuMapView though since it's just a string, all that is needed is to update the JSX:

<MyWidget
  mapView={this.state.jimuMapView ? this.state.jimuMapView.view : false}
  featureLayerId={this.props.config.layerId}

3. modules

To instruct Experience Builder to load the ArcGIS API for JavaScript for us, update the widget's manifest.json file to include a dependency property:

"dependency": ["jimu-arcgis"]

This allows the inclusion of modules directly in our widget like this:

const Sketch = require("esri/widgets/Sketch");

... and then just pass these imports as an array in the JSX, so our final component in our widget JSX will look like:

<MyWidget
  mapView={this.state.jimuMapView ? this.state.jimuMapView.view : false}
  featureLayerId={this.props.config.layerId}
  modules={[Sketch]}
></MyWidget>

(full code)

Completed Component and Widget

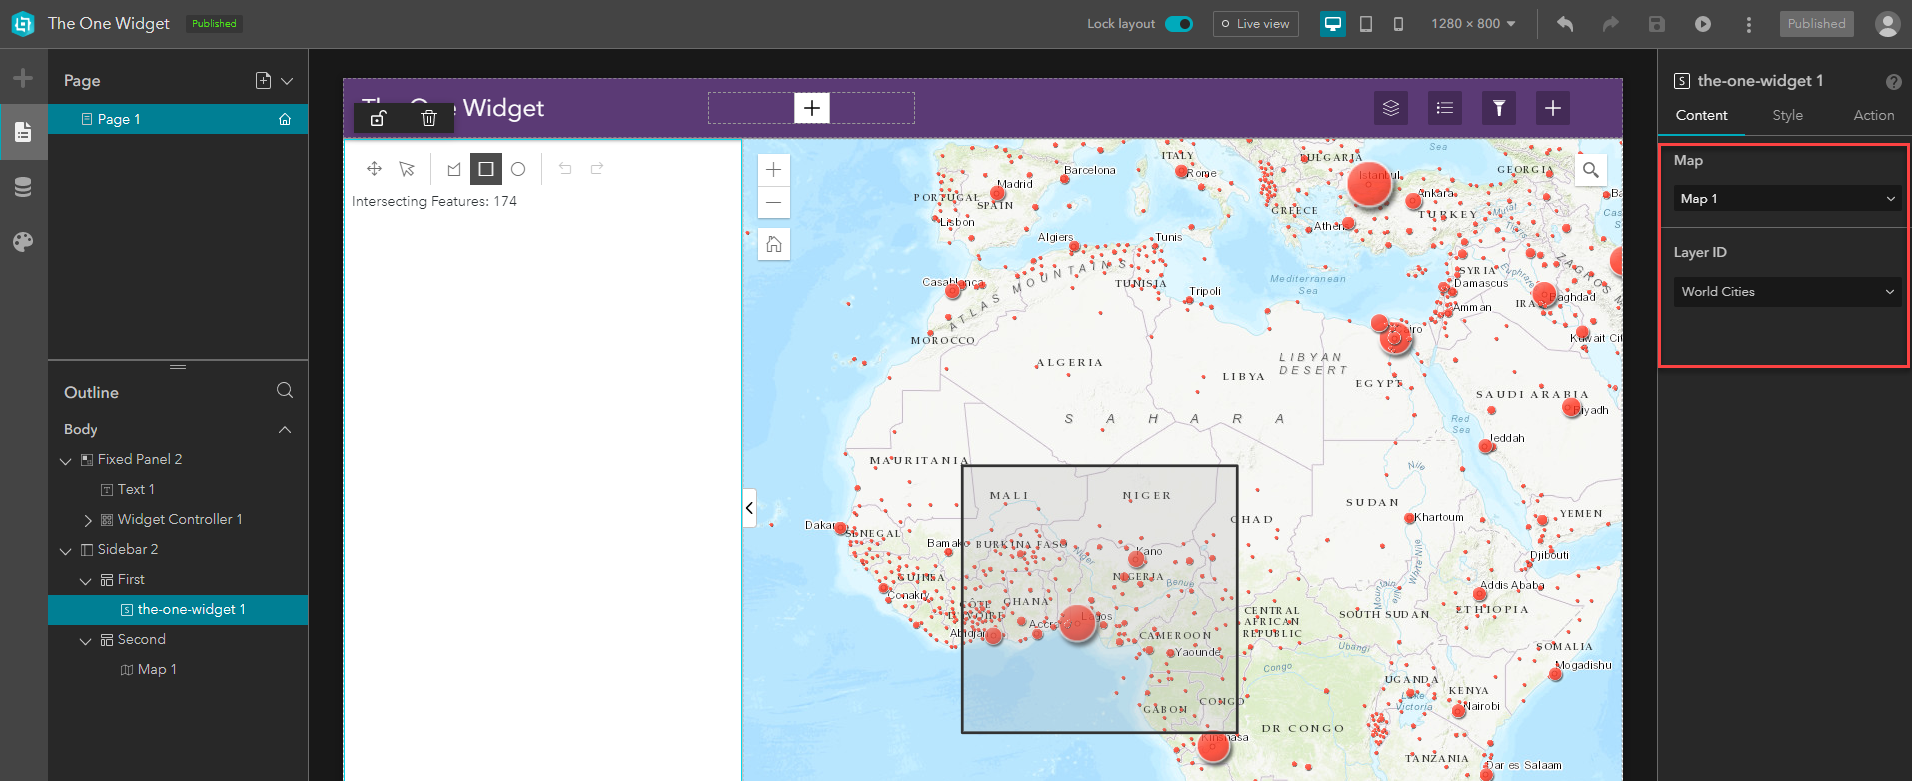
When complete, you can include your widget with an Experience to get something like this, all while still able to use your component in a React app like this.

The full, completed code for this tutorial can be found here (component) and here (Experience Builder widget wrapper). Thanks for reading, and use the comments for questions, discussion, and links to the widgets you've built.

more
2 1 2,054
63 Subscribers