GIS Life Blog - Page 2

cancel
Showing results for 
Show  only  | Search instead for 
Did you mean: 

Latest Activity

(450 Posts)
ReneRubalcava
Frequent Contributor

esri-target.jpg

Pretty recently, there was a cool blog series on using the GeometryEngine in the ArcGIS JS API. If you haven't read it, I highly suggest you do.

But before we had the GeometryEngine, we had to do stuff the old fashioned way, manually checking geometries on our own.

I pulled this from a use case I found in an old repo of mine. The use-case is that I have a point, and before I can do anything with this point, I need to know if the point is contained in any other features.

For example, I have data being streamed real-time into my app, say service requests, but I only care about seeing the ones that are in some predefined service areas.

A simple utility could look something like this:

define([], function () {
  var geomUtil = {};
  geomUtil.graphicsContain = function (graphics, pt) {
    var len = graphics.length;
    while (len--) {
      var graphic = graphics[len];
      if (graphic.geometry.contains && graphic.geometry.contains(pt)) {
        return pt;
      }
    }
    return null;
  };
  return geomUtil;
});

So basically, you iterate over the graphics and as soon as you find a graphic that contains the point, you return it. This saves some time as it doesn't need to iterate all the graphics to finish.

You could even tweak this a bit by finding the graphic in the graphics array that contains the point and instead of returning the point, return the graphic. To do it right, you'd need to iterate over all graphics though, which depending on your application could be expensive.

Here's a sample of what this might look like in action:

JS Bin - Collaborative JavaScript Debugging

To test it, draw some rectangles and polygons on the map and then try to add points. You should only be able to add points inside the polygons.

You could even get pretty function and start filtering out geometries that you can throw into the GeometryEngine and now you have a party!

For more geodev tips and tricks, check out my blog!

more
0 0 552
ReneRubalcava
Frequent Contributor

mappins.jpg

Photo: pin points | Flickr - Photo Sharing!

So I've seen this come up a couple of times. You have some FeatureLayers on your map.

You set up a listener for clicks on the map.

You click on the map.

You have maybe six layers, but you only get back one graphic.

What's up with that?

Ok, so yeah, this just has to do with what layers are where. Graphics on you map probably SVG. It just so happens that if an SVG has no fill, you can't get a click event from it. You can however set the opacity to clear and still get a click event, so keep that in mind.

But it's also a web thing. The way SVG graphics work (all DOM elements really), the click event just comes up from the top element. It doesn't click through to other elements.

So you're screwed right?

Not so fast.

You have a couple of options here. The first is to use a QueryTask. You can simply query all the layers and get results for features at the location you clicked. This is a nice clean solution and works great for polygons. Points and Lines are a little trickier. If you don't click exactly where the point or line is, you won't get a result. So you could make a little buffer of the location you clicked on using the GeometryEngine if you like to try and get a better result. I'll leave that up to you.

You can also use the IdentifyTask. This takes a little more work to set up when using FeatureLayers and experimenting with a tolerance, which is similar to the buffer we talked about earlier.

I personally think the QueryTask with a buffered geometry is a better solution, but at least you have some options.

Here's what this might look like:

require([
  "esri/map",
  "esri/layers/FeatureLayer",
  "esri/tasks/query",
  "esri/tasks/IdentifyTask",
  "esri/tasks/IdentifyParameters",
  "dojo/promise/all",
  "dojo/domReady!"
], function(Map, FeatureLayer, Query, IdTask, IdParams, all) { 
  var map = new Map("mapDiv", {
    center: [-118.182, 33.913],
    zoom: 14,
    basemap: "topo"
  });
  
  var layer0 = new FeatureLayer("http://sampleserver1.arcgisonline.com/ArcGIS/rest/services/Demographics/ESRI_Census_USA/MapServer/0");
  
  var layer1 = new FeatureLayer("http://sampleserver1.arcgisonline.com/ArcGIS/rest/services/Demographics/ESRI_Census_USA/MapServer/1");
  
  map.addLayers([layer0, layer1]);
  
  // conventional method
  map.on('click', function(e) {
    // only one graphic 
    console.log(e.graphic);
    // let's get freaky *_*
    var q = new Query();
    q.returnGeometry = true;
    q.outFields = ["*"];
    q.geometry = e.mapPoint;
    // distance and units are for Hosted Feature Services Only 
    q.units = "feet";
    q.distance = 50;
    // Query all the FeautreLayers
    var defs = [layer0, layer1].map(function(x) {
      return x.queryFeatures(q);
    });
    all(defs).then(function(results) {
      console.log("all query results", results);
    });
    
    // Or use IdentifyTask, super freaky! #_#
    var idParams = new IdParams();
    idParams.geometry = e.mapPoint;
    idParams.mapExtent = map.extent;
    // You'll need to experiment with tolerance
    // to get the desired results
    idParams.tolerance = 10;
    idParams.layerOption = IdParams.LAYER_OPTION_ALL;
    var url = layer0.url.substr(0, layer0.url.lastIndexOf("/"));
    idParams.layerIds = [layer0, layer1].map(function(x) {
      return x.url.substr(x.url.lastIndexOf("/") + 1, x.length);
    });
    console.log(idParams);
    var idTask = new IdTask(url);
    idTask.execute(idParams).then(function(results) {
      console.log("id results", results);
    });
  });
  
});

You can find a live demo here.

So  don't let little limitations get you down. You can get just about anything done with a little elbow grease.

For more geodev tips and tricks, check out my blog.

more
0 0 708
ReneRubalcava
Frequent Contributor

lists.jpg

https://www.flickr.com/photos/paloetic/4795592340/

Have you ever been working on a mapping application and maybe you're listing some data somewhere that corresponds to the data on your map? We've seen samples in the past that show how to highlight features on the map when you hover over a related item in a list or a table.

That's cool.

But haven't you ever wanted to quickly see in your list what that item corresponds to on the map? Maybe using the matching symbology that is used in the map? I bet you have?

It turns out, that's not incredibly difficult to do.

The renderer (in both v3.x and v4beta) has a method called getSymbol. This method takes a graphic. But if I had a graphic, I'd have the symbol, what are you trying to pull here man?!

Chillax.

Let's assume you are using the QueryTask to query your data. The results of a QueryTask return Features, which are Graphics, but they have no symbols. So you can iterate these results and get the symbol from the renderer.

That could look something like this sample.

require([
  'esri/layers/FeatureLayer',
  'esri/tasks/QueryTask',
  'esri/tasks/support/Query'
], function(
  FeatureLayer, QueryTask, Query
) {
  var featureLayer = new FeatureLayer({
    id: 'myLayer',
    outFields: ['*'],
    url: 'http://services2.arcgis.com/LMBdfutQCnDGYUyc/arcgis/rest/services/Los_Angeles_County_Homeless_Progra...'
  });
  featureLayer.then(function() {
    var node = document.getElementById('my-list');
    var q = new Query({
      where: '1=1',
      outFields: ['*'],
      returnGeometry: false
    });
    var qTask = new QueryTask(featureLayer.url);
    var promise = qTask.execute(q).then(function(results) {
      return results.features.map(function(a) {
        var sym = featureLayer.renderer.getSymbol(a);
        a.symbol = sym;
        return a;
      });
    });
    promise.then(function(features) {
      features.map(function(feature) {
        var attr = feature.attributes;
        var sym = feature.symbol;
        var item = document.createElement('li');
        var img = document.createElement('img');
        img.setAttribute('src', sym.source.url);
        img.setAttribute('height', 25);
        img.setAttribute('width', 25);
        var span = document.createElement('span');
        span.innerHTML = attr.ProgName;
        item.appendChild(img);
        item.appendChild(span);
        node.appendChild(item);
      });
    });
  });
});

There's no map in this sample, as it's not the focus here. We're just creating a FeatureLayer so that we can leech off it's renderer. Then when we do the Query of the layer, we use the renderer to get the symbol and create an list element with an image and some text.

You can see a demo of this here.

You can not take this sample and hook it up so that when you click on an item, it can zoom to the location on the map and maybe display some detailed data in another part of the page or in the popup, that's totally up to you. I just wanted to show how easy it is to get access to the symbology of features to use them in your actual user-interface. So go forth and hack away!

For more geodev tips and tricks, check out my blog.

more
2 0 724
ReneRubalcava
Frequent Contributor

ago-cloud.jpg

It occurred to me recently that developers can be somewhat confused about how they can use ArcGIS Online for their development needs. I even wrote up an intro for developers earlier this week. So I just wanted to cover a few resources that are good staring off points for users.

Developer Site

The key entry point for developers is probably going to be the developer site. The developer site is a gateway to a wealth of information on how you can leverage ArcGIS Online for your applications. It covers the details of the premium services from the ever popular geocoding and routing to the powerful geoenrichment and geotrigger services and more.

It also links out to all the various APIs and SDKs that Esri provides that you can use to access these services. And as I have said before and I'll keep saying it, it links to the core to it all, the REST API documentation.

But how does all this tie into ArcGIS Online?

ArcGIS as a Platform

I was a confused ArcGIS Online user at one point. When it was released I wasn't quite sure what to make of it. Then it became a platform. What does that even mean? Basically, all the resources and tools discussed on the developer site are gathered in ArcGIS Online, along with tons of data that others have created and are sharing. This lets you tie into multiple resources for your applications.

But how does a developer get started? I covered this a bit more in this blog post and in my book, but here are the main points.

  • Create a Feature Service via your Developer Account.
  • You can also upload data directly into your ArcGIS Online Account (same account used for developer site).
  • Prepare a map with supporting data
  • Edit or collect data, via your own application or one of the ready to use apps.
  • Blow it up in ArcGIS Online

Let's talk about that last one a bit, which is where the cool stuff is for developers who want to do something with their data.

There are a ton of tools for you to use in ArcGIS Online, you can aggregate your data, perform some spatial analysis and even use demographic data to enrich your own sad little datasets and give them meaning. You can take the results of your spatial analysis and use the visualization tools to really drive home the point of the analysis in your application.

You may have collected some data for available retail locations that your client plans on opening a new store. You can use the tools to create a drive-time analysis of each location, say within 10 minutes, and you can take that result and use the geoenrichment tools to determine the demographic makeup of people that live with ten minutes of each location. You can even find out where their entertainment preferences are and use this information to narrow the down the best candidates for a new store location. You can then save these results and your clients can share this new map with other stakeholders.

Learning Resources

Esri has been offering a series of free online courses you can take.

Learn What Spatial Analysis Can Do for You

Give Yourself the Location Advantage

Although these courses are not specifically targeted at developers, I think they would prove useful to anyone that wants to take their applications to a new level.

There are some introductory lessons online in this Get Started with ArcGIS Online page.

Don't forget, when you sign up for a free ArcGIS Developer account, you have access to all the features in ArcGIS Online. With the amount of data available to you and the ability to perform analysis on your own data that can further enrich your own applications, I think any developer should at least see how they can incorporate it into their workflow.

For more geodev tips and tricks, check out my blog.

more
1 0 1,910
ReneRubalcava
Frequent Contributor

esrijs-polymer.png

I did a blog post recently on using Polymer with the ArcGIS API for JavaScript 4.0 beta.

You can read more about Web Components here and here.

Web components are awesome, because you could do something like this in your HTML.

<body>
  <my-awesome-component></my-awesome-component>
</body>

And you could have <my-awesome-component> be some awesome user-interface element!

Sounds great right? Yeah, web-components aren't quite supported in all browsers yet. But no fear, while browser vendors duke out the spec and details, we can just use awesome libraries like Polymer. Most libraries like Angular, Ember, React and even Dojo Djits provide components of some sort.

So what's so great about Polymer? Let's look at a simple component that we want to use to display the current extent of the map.

<dom-module id="extent-info">
  <template>
    <div class="extent-details well">
      xmin: <span>{{xminc}}</span><br>
      ymin: <span>{{yminc}}</span><br>
      xmax: <span>{{xmaxc}}</span><br>
      ymax: <span>{{ymaxc}}</span><br>
    </div>
  </template>
  <style>
    .extent-details {
      margin: 1em;
    }
  </style>
  <script>
    var ExtentInfo = Polymer({
      is: 'extent-info',
      properties: {
        xmin: Number,
        ymin: Number,
        xmax: Number,
        ymax: Number,
        xminc: {
          type: Number,
          computed: 'toFixed(2, xmin)'
        },
        yminc: {
          type: Number,
          computed: 'toFixed(2, ymin)'
        },
        xmaxc: {
          type: Number,
          computed: 'toFixed(2, xmax)'
        },
        ymaxc: {
          type: Number,
          computed: 'toFixed(2, ymax)'
        }
      },
      toFixed: function(n, x) {
        return x.toFixed(n);
      }
    });
  </script>
</dom-module>

So let's check this out.

The root of your component is a dom-module with an id that corresponds to the id given to the Polymer constructor. Then we have a template section. The template section contains the actual DOM elements of your component. This is where you can bind attributes to your Polymer component by using mustache syntax {{bindingVariable}}. These bound variables are defined in the Polymer constructor as properties. In these properties, you can define computed properties. Meaning these are properties that are computed based on other properties, in this case simplifying the precision of the extent numbers.

The beauty of these components is that to update them, you simply update the attributes o the DOM element and the computed properties will handle the rest.

class Component {
  constructor(data) {
    // add import link
    var href = require.toUrl('app/views/PolymerView/components/ExtentInfo.html');
    var node = document.querySelector('.esriTop.esriRight');
    var link = document.createElement('link');
    link.setAttribute('href', href);
    link.setAttribute('rel', 'import');
    document.body.appendChild(link);

    var el = document.createElement('extent-info');
    node.appendChild(el);
    el.setAttribute('xmin', data.xmin)
    el.setAttribute('ymin', data.ymin)
    el.setAttribute('xmax', data.xmax)
    el.setAttribute('ymax', data.ymax)
    this.element = el;
  }

  update(data) {
    var el = this.element;
    el.setAttribute('xmin', data.xmin)
    el.setAttribute('ymin', data.ymin)
    el.setAttribute('xmax', data.xmax)
    el.setAttribute('ymax', data.ymax)
  }
};
export default Component;

Now the easy way to use this with the ArcGIS API for JavaScript 4.0 beta is using Accessors. You can create a Model the extends Accessor and defines the Extent.

import Accessor from 'esri/core/Accessor';
import Extent from 'esri/geometry/Extent';
class Model extends Accessor {
  classMetadata: {
    properties: {
      extent: {
        type: Extent
      }
    }
  }
};
export default Model;

Since it's an Accessor, you can watch for changes on the Model and update the values of the component with the changes.

import Model from './Model';
import Component from './components/ViewProxy';
// Controller links Model and view
class Controller {
  constructor(extent) {
    this.model = new Model({ extent: extent });
    this.view = new Component({
      position: 'topright',
      xmin: this.model.extent.xmin,
      ymin: this.model.extent.ymin,
      xmax: this.model.extent.xmax,
      ymax: this.model.extent.ymax
    });
    this.model.watch('extent', (val) => {
      this.view.update({
        xmin: val.xmin,
        ymin: val.ymin,
        xmax: val.xmax,
        ymax: val.ymax
      });
    });
  }
};
export default Controller;

That's it. You can start building out a bunch of reusable components that can be composed together to create an entire application if you want.

There's currently a project called esri-polymer on github from James Milner of Esri UK that's really cool. It's based on the current ArcGIS API for JavaScript 3.x, so no Accessors, but it has enough components that it allows to put an application together without writing any JavaScript.

This is the future of what's to come in web development, but screw the future, you can do this stuff now.

For more geodev tips and tricks, check out my blog.

more
0 0 895
ReneRubalcava
Frequent Contributor

esrijs-tooling.png

In the past few weeks I've talked about testing for your ArcGIS API for JavaScript applications, and how you might structure your ArcGIS JS Apps. Most recently on my blog I talked about a new tool I've been working on to simplify all this work for you.

You can find the tool on github.

This tool is based on yeoman, which is a scaffolding tool for web apps. It's a node based command line tool that let's you quickly build an ArcGIS JS app, with testing and build tools included.

All the code is written in ES6/ES2015.

So what do you get with this tool? Glad you asked.

You get a generator that scaffolds your entire application structure for you.

You get testing built in with intern.

You get preconfigured easy to use Dojo build scripts.

Best of all, you get a simple development workflow.

What do I need?

You'll need at minimum:

The Dojo build uses the Google Closure compiler, so you'll also need Java, sorry. But you'll also need Java for functional tests with intern, which uses a local Selenium driver.

What do I do?

Once you have everything, you can install the generator with npm install -g generator-arcgis-js-app

Once you do that, create a folder that you want to use for your application. Run a terminal/command line inside the folder and use yo arcgis-js-app to use the generator to scaffold your application.

The initial process takes a little while to install all the dependencies and do an initial build.

Once this is done, you can npm start to start a local server on your machine and navigate to http://localhost:8282/dist to see the default application. You should also probably open another browser tab or window to view the tests page at http://localhost:8282/node_modules/intern/client.html?config=tests/intern .

The scaffold will automatically inject a script in the page that will automatically activate livereload if you have the extension installed in your browser. It's also set up so that any changes you make to your code in the src directory will get updated to the dist directory and reload your web app and test page. This makes it very easy for you to develop your application and see the results right away.

When you are ready to deploy your application you can run grunt release --force. This will run the Dojo build system on your app. You need to use --force for now because of a weird error in the build. It's not really broken, but something doesn't play nice, I'll be fixing this as soon as I can. This will take a while, so you go watch some cat videos or something.

The release script is set up to scan your CSS file and copy all resources into a release/resources folder and update the references in your CSS file and places it in the release/app.css file. The built JavaScript app is copied into the release/app.js file. The index.html file is copied over with the new references and stripped of the livereload script.

And that's it. You get 3 files and a folder of resources that you can easily deploy for your application.

You're welcome.

What are you talking about?

You can read more details about this generator on my blog and check out the github repo as updates are done and fixes are applied. If you run into problems, let me know. I'll talk about how you might tweak the application structure at a later time.

For more geodev tips and tricks, check out my blog.

more
0 0 657
ReneRubalcava
Frequent Contributor

esrijs-intern.png

You write badass apps. Your users are happy, you're happy, everything is peachy. Someone says they want some new features. You're like rad dude, I got this. You start writing and refactoring, adding new modules, tweaking a couple of others and somewhere along the line your entire application comes crashing down. Something broke and you've made so many changes you can't tell what broke where.

You are so screwed.

Maybe you've never been in such a horrible scenario, but I bet you've had to do some ugly stuff in your code to make things work because you needed to work around some weird issue that popped up while adding new features.

The shame

As developers, we all feel like we should do it. Maybe we start a new project with enthusiasm doing it. We should be testing our code. I'm guilty of starting a project with lots of tests, but somewhere along the way I don't keep it up and I feel horrible about it. But it doesn't have to be that way. Unit tests are appropriate for large projects, trust me. Maybe it's TDD or BDD or you just write tests after the fact. However you do it, you will only thank yourself down the road as a project grows.

Here is a repo on testing from previous Esri Dev Summits and a cool Karma example. I like Karma, it's a cool test runner, but recently I've revisited TheIntern for testing. Intern is really cool and you can read some really great posts on SitePen about it. Check out the one on InternRecorder which is awesome.

Simplify your flow

The only drawback on Intern from something like Karma that I could never get to work is have it run my tests in the terminal on every file change, but I've worked around that using live-reload in my development toolkit.

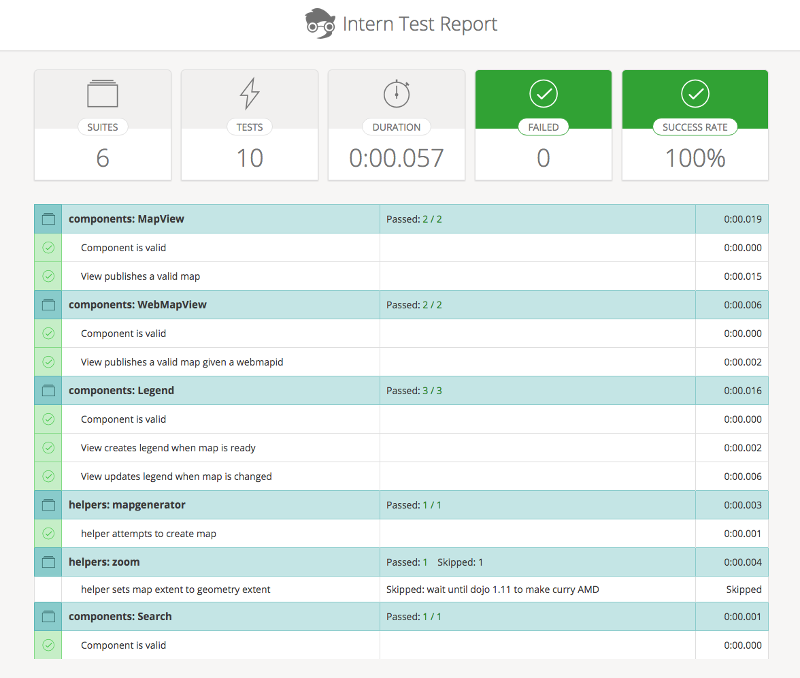
Combine live-reload with Grunt and a few plugins and every time I make a change to my app, my app reloads in the browser and my test page also reloads so I can instantly see if I broke something.

intern-test-page.png

Green is a beautiful color.

Now I'm not going to get into the whole red/green/refactor bit of tdd or unit testing. There are plenty of tutorials out there to help you out with that. There's also a whole world out there on spies and mocks for testing. I'll just say that I like SinonJS for this purpose. I know it and I'm used to it, but others may have different preferences.

So what's a sample test look like? Like this maybe.

define(function(require) {
  var registerSuite = require('intern!object');
  var expect = require('intern/chai!expect');
  var View = require('app/components/map/WebMapView');
  var topic = require('dojo/topic');
  var config = require('app/config');
  var utils = require('esri/arcgis/utils');
  var chai = require('intern/chai!');
  var sinon = require('sinon');
  var sinonChai = require('sinon-chai');
  chai.use(sinonChai);
  var mapView;
  registerSuite({
    name: 'components: WebMapView',
    setup: function() {
      // set up test here
      sinon.stub(utils, 'createMap').returns({
        then: function(){}
      });
    },
    beforeEach: function() {
      // run before
    },
    afterEach: function() {
      // run after
      if (mapView && mapView.destroy) {
        mapView.destroy();
      }
    },
    teardown: function() {
      // destroy widget
      utils.createMap.restore();
    },
    'Component is valid': function() {
      expect(View).to.not.be.undefined;
    },
    'View publishes a valid map given a webmapid': function() {
      mapView = new View({
        webmapid: config.webmap.webmapid
      });
      expect(mapView.webmapid).to.equal(config.webmap.webmapid);
    }
  });
});

All that noise basically boils down to this.

'View publishes a valid map given a webmapid': function() {
  mapView = new View({
    webmapid: config.webmap.webmapid
  });
  expect(mapView.webmapid).to.equal(config.webmap.webmapid);
}

I'm basically saying that when I create this component, I expect it to have a webmap with the webmapid I gave the constructor. That's it. The implementation is left up to me, but the test is only concerned about the end result.

Tells a story

Tests are great documentation. I can't tell you how many times I've pulled up the tests for a library or framework to get a better idea of how to use it if I'm confused about something in the docs. They can be incredibly valuable resources. They don't replace documentation, but are fantastic companions.

There are tons of tutorials out there on JavaScript unit testing, you can read up on. A lot are based on QUnit or Jasmine, but like I said, I've grown to really like Intern. Intern integrates well with Sauce Labs, but if you don't need the full platform, you can use the local selenium driver and chromedriver. And if using Grunt, I can use grunt-run to run the driver before executing the functional tests.

run: {
  options: {
    wait: false
  },
  webdriver: {
    cmd: 'java',
    args: [
      '-jar',
      'tests/lib/selenium-server-standalone-2.46.0.jar',
      '-Dwebdriver.chrome.driver=node_modules/chromedriver/bin/chromedriver'
    ]
  }
}

But these are probably details better left for a future blog post.

Write some tests

I'm currently working on a Yeoman generator to help simplify this for ArcGIS JS API development, which also includes testing. It's not quite done yet, but I'm hoping to finish it up soon.

Now I'm not saying you have to test every little thing, but it is a good idea to test the behavior of your app.

Two things to consider:

  1. Writing the tests before - testing helps to guide your development.
  2. Writing the tests after - can be done, writing the app can help you get the idea down, but you run the risk of writing tests just to pass.

Remember I said that tests aren't concerned with the implementations of your code. You test that you pass in a and you expect result b. That's it. So it's a good way to quickly get down what you are trying to accomplish. If you write the tests after the fact, you run the risk of writing the tests to fit your code, which could be broken. BUT, if you rerun these tests as your write more code, you'll at least know if your broke something that worked earlier.

There are lots of resources on JavaScript testing out there. Here are a couple I can think of .

Introduction To JavaScript Unit Testing

JavaScript Testing Recipes

Intern Tutorial esri jsapi

Here is a demo project that includes testing and grunt tooling to help you out.

For more geodev tips and tricks, check out my blog.

more
2 0 1,086
ReneRubalcava
Frequent Contributor

esrijs-structure.jpg

Every now and then, someone will ask me about how they should structure their ArcGIS JS API app. In my book, I recommend the following app structure:

app/

   |-- css/

   |-- js/

         |-- controllers/

         |-- services/

         |-- utils/

         |-- widgets/

         |-- main.js

         |-- run.js

   |-- index.html

I've used this app structure for a lot of projects and it's worked fine. Typically my run.js looked like this:

(function() {
  'use strict';
  var pathRX = new RegExp(/\/[^\/]+$/)
  , locationPath = location.pathname.replace(pathRX, '');
  require({
  packages: [{
  name: 'controllers',
  location: locationPath + 'js/controllers'
  }, {
  name: 'widgets',
  location: locationPath + 'js/widgets'
  }, {
  name: 'utils',
  location: locationPath + 'js/utils'
  }, {
  name: 'services',
  location: locationPath + 'js/services'
  }, {
  name: 'app',
  location: locationPath + 'js',
  main: 'main'
  }]
  }, ['app']);
})();

This works out pretty nice. But one thing it doesn't take into consideration is treating the app and all submodules as an app package. This is more concerned with treating my modules as packages when using the CDN. What's the difference? Glad you asked!

Let's say you want to build your application. Maybe you're going to utilize the ArcGIS optimizer or esri-slurp, which has a great example here by the way. You're going to want to treat your application as it's own package. What do I mean by that? Well, let's take a look at how you use the ArcGIS JS API.

require(['esri/map', 'dojo/declare'], function(Map, declare) {/*cool stuff*/});

In this case, esri is a package and dojo is a package.  There are other packages included in the API, such as dgrid, dstore, and diijt. This because when you use the Dojo build system, it knows how to reference the files. So you can naturally bundle your application as it's own package, called app. You can call it Sally if you want, but let's assume app works just fine.

So these days, the way I like to structure my app similar to this.

index.html

dojoConfig.js

app/

   |-- styles/

   |-- models/

   |-- services/

   |-- utils/

   |-- widgets/

   |-- main.js

   |-- app.profile.js

    |-- package.json

    |-- config.json

Here, I have dojoConfig file that does some basic setup. It could look like this:

var dojoConfig = {
  async: true,
  parseOnLoad: true,
  isDebug: true,
  deps: ['app/main']
  }
};

Ok, so this assumes I'm going to use esri-slurp to download the API and use bower to install other dependencies. If I were using this as a CDN, I would add packages property like this:

packages: [{
  name: 'app',
  location: location.pathname.replace(/\/[^\/]+$/, '') + 'app'
}]

That's it.

Ok, bear with me a second. What is this app.profile.js nonsense? This file defines some resourceTags for our app package. This basically tells the Dojo build system my package is using AMD. A coworker told me about this, I didn't think I needed it, but the Dojo build system nags you if you don't have it. It looks like this:

var profile = (function(){
  return {
    resourceTags: {
      amd: function(filename, mid) {
        return /\.js$/.test(filename);
      }
    }
  };
})();

The pacakge.json let's the Dojo build system know where to find the app.profile to use.

{
  "name": "myapp",
  "version": "1.0.0",
  "main": "main",
  "description": "Demo app.",
  "homepage": "",
  "dojoBuild": "app.profile.js"
}

The config.json is something that i've been using for years in my ArcGIS JS API apps. It's basically settings or what the map looks like or configurations for widgets. I can use this file or call a web service to get this config data. You can see an example of what that might look like here. The rest of the application is pretty basic. Currently my application structure is heavily inspired by ember-cli as it's something I've been using a lot lately.

However, if I'm using React for building my UI, I like to use a more Flux oriented structure.

index.html

dojoConfig.js

app/

   |-- styles/

   |-- stores/

   |-- actions/

   |-- helpers/

   |-- views/

   |-- main.js

   |-- app.profile.js

   |-- package.json

   |-- config.json

I would also do the same if I were using Angular, where I'd adopt a structure that uses directives instead of views or components. I'm currently working on a Yeoman generator for ArcGIS JS Apps, which you can see a demo app here. It's still pretty experimental, but could be useful to some.

The cmv-app has an interesting app structure using configuration base similar to this starterkit I was working on.

They key here, whether you like my advice or not, is pick a structure that works for you. You could have your main.js work as the application controller and just have a widget folder with all your UI stuff. Again, as long as it works for you, you're all set.

I'll get to a follow-up blog post that talks about the next step here, which is creating a custom build of your application. That should be fun!

For more geodev tips and tricks, check out my blog.

more
1 3 711
ReneRubalcava
Frequent Contributor

esri-edit.jpg

So I've talked a lot about the ArcGIS API for JavaScript 4.0beta1 a lot recently. I've proclaimed my love of Accessors, and I think Promises are groovy. There's a the whole new concept of separating the map and the view. It's chock full of good stuff. It is however, beta. So not everything is 100% and some stuff just isn't quite ready yet.

But you're impatient. You like living on the edge. You drink wine from the bottle. You want some stuff to work now! One of the things not in the 4.0beta1 API is editing. If you look at the docs for a FeatureLayer, it has no editing capabilities at the moment. It will, just not yet. That's ok though. You're a developer... you got this.

What is editing after all? Editing is nothing more than a capability of a feature service in the ArcGIS REST API. I've told you before, learn to speak rest and everything else just comes together. For this case, let's assume you just want to add features to the service. There's a capability specifically for that. It even has a sample of what the request and response will look like. It can't get much simpler than that.

So this sample editor is about as simple as you can get to add features to a Feature Service.

var Editor = declare(null, {
  constructor: function (params) {
    this.map = params.map;
    this.layer = params.layer;
  },
  add: function (graphic) {
    var data = graphic.toJSON();
    var map = this.map;
    var layer = this.layer;
    // http://resources.arcgis.com/en/help/arcgis-rest-api/index.html#/Add_Features/02r30000010m000000/
    var url = this.layer.url + "/addFeatures";
    map.remove(layer);
    esriRequest({
      url: url,
      content: {
        features: JSON.stringify([data]),
      }
    }, {
      usePost: true
    }).then(function (response) {
      map.add(layer);
    }).otherwise(function () {
      map.add(layer);
    });
  }
});

That's it. Provide a Map and FeatureLayer and you're all set.

Notice that as of right now, you need to remove the layer from the map and then add it again to get the edits to show. Beta!

I'm just using this on a shared service, but esri/request should be able to handle authentication for you if you need it. Don't hold me to this right now, I haven't tried it yet.

Need to support deletes and updates? Look at the delete features and update endpoints. Or just use applyEdits and manage it how you want. Remember... It's all just REST man!

Here is a demo of this module in action.

So go on, give it a shot. Beta is beta, but sometimes you just gotta do whatcha gotta do.

So go forth and hack away my friends!

For more geodev tips and tricks, check out my blog.

more
0 0 1,863
ReneRubalcava
Frequent Contributor

esrijs-modules.jpg

A while ago I wrote an article on how to Embrace your AMD modules. A couple of questions popped up on seeing examples of how to do so, using best practices and recommended ways of working with modules. So I thought I would try to help out with that today.

What I did was take a sample from the docs that I had updated to add some features a while ago.

I wanted to think about how I could break this up into a more modular app using AMD.

So first things, first, let's look at the code, ignoring the HTML for now.

require([
  "esri/Color", "esri/dijit/PopupTemplate", "esri/layers/FeatureLayer", "esri/map", "esri/renderers/BlendRenderer",
  "esri/symbols/SimpleFillSymbol", "esri/symbols/SimpleLineSymbol", "dojo/on", "dojo/domReady!"
], function (Color, PopupTemplate, FeatureLayer, Map, BlendRenderer, SimpleFillSymbol, SimpleLineSymbol, on){
  map = new Map("map", {
    basemap: "topo",
    center: [-118.40, 34.06],
    zoom: 15
  });
  //Set the blendRenderer's parameters
  var blendRendererParams = {
    //blendMode:"overlay" //By default, it uses "source-over", uncomment to display different mode
    //See: https://developer.mozilla.org/en-US/docs/Web/API/CanvasRenderingContext2D/globalCompositeOperation
    symbol: new SimpleFillSymbol().setOutline(new SimpleLineSymbol().setWidth(0)),
    fields: [
      {
        field: "OWNER_CY",
        label: "Owner Occupied",
        color: new Color([0, 0, 255])
      }, {
        field: "RENTER_CY",
        label: "Renter Occupied",
        color: new Color([255, 0, 0])
      }, {
        field: "VACANT_CY",
        label: "Vacant",
        color: new Color([0, 255, 0])
      }
    ],
    opacityStops: [
      {
        value: 0.1,
        opacity: 0
      },
      {
        value: 1,
        opacity: 0.7
      }
    ],
    normalizationField: "TOTHU_CY"
  };
  //Create the PopupTemplate to be used to display demographic info
  var template = new PopupTemplate({
    "title": "Housing Status by Census Block",
    "fieldInfos": [
      {
        "fieldName": "OWNER_CY",
        "label": "Number of Owner Occupied Houses",
        "visible": true,
        "format": {
          "places": 0,
          "digitSeparator": true
        }
      }, {
        "fieldName": "RENTER_CY",
        "label": "Number of Renter Occupied Houses",
        "visible": true,
        "format": {
          "places": 0,
          "digitSeparator": true
        }
      }, {
        "fieldName": "VACANT_CY",
        "label": "Number of Vacant Houses",
        "visible": true,
        "format": {
          "places": 0,
          "digitSeparator": true
        }
      }, {
        "fieldName": "TOTHU_CY",
        "label": "Total Housing Units",
        "visible": true,
        "format": {
          "places": 0,
          "digitSeparator": true
        }
      }
    ]
  });
  var layerUrl = "http://services.arcgis.com/V6ZHFr6zdgNZuVG0/arcgis/rest/services/Blocks%20near%20Wilshire%20enriched...";
  var renderer = new BlendRenderer(blendRendererParams);
  layer = new FeatureLayer(layerUrl, {
    id: "blendedLayer",
    outFields: ["TOTHU_CY", "RENTER_CY", "OWNER_CY", "VACANT_CY"],
    opacity: 1,
    definitionExpression: "TOTHU_CY > 0",
    infoTemplate: template
  });
  layer.setRenderer(renderer);
  map.addLayer(layer);
  on(document.getElementById("blendSelect"), "change", function(e) {
    renderer.setBlendMode(e.target.value);
    layer.redraw();
  });
});

This isn't so bad for a small app, but I like to think about how can I scale my app? Where can I break it up a bit and what exactly is happening?

Warning - This is just my opinion on how you could modularize this app, others may have differing opinions.

Step by step

First off, this app makes use of the BlendRenderer that I discussed here. That has me thinking I could probably break all that functionality out. I'm also creating a PopupTemplate and the BlendRenderer right in this single file. When I see stuff like this, that is kind of simple parameters type stuff, I have tendency to drop them into utility modules, meaning they can be reused in multiple modules pretty easily and are part of a common core to my application.

So I can break them out into their own utility modules which you can see in this sample repo.

Ok, that was pretty simple, just a copy/paste into a couple of modules. Now let's think about what my app does. For simplicity sake, let's say I am focused on visualizing some population information. Let's focus this into a widget. This widget could look something like this:

define([
  'dojo/_base/declare',
  'dojo/_base/lang',
  'dojo/topic',
  'dijit/_WidgetBase',
  'dijit/_TemplatedMixin',
  'esri/layers/FeatureLayer',
  'dojo/text!./widget.html'
], function(
  declare, lang, topic,
  _WidgetBase, _TemplatedMixin,
  FeatureLayer,
  templateString
) {
  var hitch = lang.hitch;
  return declare([_WidgetBase, _TemplatedMixin], {
    templateString: templateString,
    baseClass: 'population-info',
    postCreate: function() {
      var layerOptions = this.get('layerOptions');
      var renderer = this.get('renderer');
      var url = this.get('url');
      var map = this.get('map');
      var layer = new FeatureLayer(url, layerOptions);
      layer.setRenderer(renderer);
      map.addLayer(layer);
      this.set('layer', layer);
      this.own( // do this so the widget can clean up memory if it's destroyed
        topic.subscribe('blend-select-update', hitch(this, 'updateBlendMode'))
      );
    },
    updateBlendMode: function(mode) {
      console.log('update blend mode with dojo/topic');
      var layer = this.get('layer');
      var renderer = this.get('renderer');
      renderer.blendMode = mode;
      layer.setRenderer(renderer);
      layer.refresh();
    }
  });
});

This is a pretty simple widget. We use a postCreate method to set stuff up. I talk about the dijit lifecycle in this video. This method is where I set up my layer and assign the renderer that was passed in the options. There's a simple HTML template which is just a copy of the HTML from the sample the has a description of the data. I'm also using dojo/topic, which I talked about here. I'm going to demonstrate a couple of different methods of widget communication, one using dojo/topic and one using dojo/Evented.

This module also has an updateBlendMode method that simply handle the dojo/topic subscribe and updates the blendMode. This means any module in your application publish an update to the blendMode or whatever reason. In my opinion, this is an ideal method of widget communication, because the individual widgets do not need to be aware of each other.

The other thing the sample had was a select menu that allowed you to update the blendMode. Again, I think this is the perfect candidate for another widget. The code for this widget could look something like this:

define([
  'dojo/_base/declare',
  'dojo/Evented',
  'dojo/topic',
  'dijit/_WidgetBase',
  'dijit/_TemplatedMixin',
  'dojo/text!./widget.html'
], function(
  declare, Evented, topic,
  _WidgetBase, _TemplatedMixin,
  templateString
) {
  return declare([_WidgetBase, _TemplatedMixin, Evented], {
    templateString: templateString,
    baseClass: 'blend-select',
    onChange: function(e) {
      var val = e.target.value;
      if (this.cboxNode.checked) {
      topic.publish('blend-select-update', val);
      } else {
        this.emit('blend-select-update', val);
      }
    }
  });
})

This widget uses the dojo/Evented and dojo/topic. You'll notice that the widget itself extends dojo/Evented using dojo/_base/declare. This allows you to use this.emit() to emit events from your widget. This widget has the select-menu for blendModes and also a checkbox to set whether or not you want to emit an event with the new blendMode or publish the blendMode via dojo/topic.

The template for this looks like this:

<div>
  <div>
  <input type="checkbox" data-dojo-attach-point="cboxNode"> Use dojo/topic
  </div>
  <select data-dojo-attach-event="change:onChange">
  <option value="source-over">source-over</option>
  <option value="source-in">source-in</option>
  <option value="source-out">source-out</option>
  <option value="source-atop">source-atop</option>
  <option value="destination-over">destination-over</option>
  <option value="destination-in">destination-in</option>
  <option value="destination-out">destination-out</option>
  <option value="destination-atop">destination-atop</option>
  <option value="lighter">lighter</option>
  <option value="copy">copy</option>
  <option value="xor">xor</option>
  <option value="overlay">overlay</option>
  <option value="normal">normal</option>
  <option value="multiply">multiply</option>
  <option value="screen">screen</option>
  <option value="darken">darken</option>
  <option value="lighten">lighten</option>
  <option value="color-dodge">color-dodge</option>
  <option value="color-burn">color-burn</option>
  <option value="hard-light">hard-light</option>
  <option value="soft-light">soft-light</option>
  <option value="difference">difference</option>
  <option value="exclusion">exclusion</option>
  <option value="hue">hue</option>
  <option value="saturation">saturation</option>
  <option value="color">color</option>
  <option value="luminosity">luminosity</option>
  </select>
</div>

Ok, so we have two widgets, one that creates the FeatureLayer with the blendRenderer and another widget that updates the blendMode of the renderer.

Let's wire this up in a main.js module to get things started.

define([
  'esri/map',
  'esri/layers/ArcGISTiledMapServiceLayer',
  'app/widgets/population/widget',
  'app/widgets/blendselection/widget',
  'app/utils/popupUtil',
  'app/utils/rendererUtil'
], function(
  Map, ArcGISTiledMapServiceLayer,
  PopulationWidget, BlendSelectionWidget,
  popup,
  renderer
) {
  var map = new Map('map', {
    center: [-100, 38],
    zoom: 5
  });
  var tileLayer = new ArcGISTiledMapServiceLayer('http://tiles.arcgis.com/tiles/nzS0F0zdNLvs7nc8/arcgis/rest/services/US_Counties_basemap/MapServer');
  map.addLayer(tileLayer);
  map.on('load', function() {
    var populationWidget = new PopulationWidget({
      layerOptions: {
        outFields: ['WHITE', 'POP2012', 'AMERI_ES', 'HISPANIC', 'BLACK', 'ASIAN', 'POP12_SQMI', 'NAME', 'STATE_NAME'],
        opacity: 1,
        infoTemplate: popup
      },
      renderer: renderer,
      map: map,
      url: 'http://services.arcgis.com/P3ePLMYs2RVChkJx/arcgis/rest/services/USA_Counties_Generalized/FeatureSer...'
    }, 'population-container');
    var blendSelectionWidget = new BlendSelectionWidget({}, 'blend-selection-container');
    // one way to do update the blendMode
    blendSelectionWidget.on('blend-select-update', function(mode) {
      console.log('update blend mode with events');
      renderer.blendMode = mode;
      populationWidget.get('layer').setRenderer(renderer);
      populationWidget.get('layer').refresh();
    });
  });
});

Ok, so the purpose of the main file is to create the map and load the widgets, passing the required options while also using the utils we created earlier. You will also notice that I am using blendSelectionWidget.on('blend-select-update', function(mode){}) to listen for when an event is emitted and manually update the renderer for the layer in the population widget. This is another way you can do communication between widgets, where you can do it in a main file or maybe you'll have a WidgetController that handles all your applications widget communication, it really depends on what tickles your fancy. Normally, I would even break out the map creation as it's own widget as well.

I'd also like to point out the dojoConfig for this application.

var dojoConfig = {
  isDebug: true,
  deps: ['app/main'],
  packages: [{
  name: 'app',
  location: location.pathname.replace(new RegExp(/\/[^\/]+$/), '') + 'app'
  }]
};

That is dead simple. Doing it this way, I have defined an app package and all my modules live in this package. This means I don't have to create a widgets package or a utils package, I can just reference them as app/widgets and app/utils. Notice the deps property too. This will tell the Dojo loader to load this module when Dojo is loaded. You can check the docs here. This makes my actual index.html file really simple.

<!DOCTYPE html>
<html>
  <head>
  <meta http-equiv="Content-Type" content="text/html; charset=utf-8">
  <meta name="viewport" content="initial-scale=1, maximum-scale=1,user-scalable=no" />
  <title>Modular App Demo</title>
  <link rel="stylesheet" href="http://js.arcgis.com/3.14/esri/css/esri.css">
  <link rel="stylesheet" href="css/main.css">
  <script src="dojoConfig.js"></script>
  </head>
  <body>
  <div id="blend-selection-container"></div>
  <div id="population-container"></div>
  <div id="map"></div>
  <script src="http://js.arcgis.com/3.14/"></script>
  </body>
</html>

You can read about other methods to initialize your application here.

Just take it piece by piece

You can find the entire modularized application in this github repo. I hope this provides a little more insight into how you might break up an application into modules and how you can start thinking about modularity in your own development. I tend to like breaking out features of an application into their own widgets, whether it be editing, searching, geocoding even just adding some behavior.

You can see some other samples of modularity in stuff I worked on in the past in this starter-kit, which is fully configurable or my latest experiments in this yeoman generator, and sample app. Another app that is very modular is something like the cmv app.

Again, this is simply my opinion on how I think you could break up an app into smaller modules that make it not only easier to maintain over time but to easily add new functionality as well.

For more geodev tips and tricks, check out my blog.

more
0 0 1,762
63 Subscribers