- Home
- :
- All Communities
- :
- Products
- :
- Geoprocessing
- :
- Geoprocessing Questions
- :
- Re: Sample (spatial analyst) bug in 10.5.1.7333
- Subscribe to RSS Feed
- Mark Topic as New
- Mark Topic as Read
- Float this Topic for Current User
- Bookmark
- Subscribe
- Mute
- Printer Friendly Page
Sample (spatial analyst) bug in 10.5.1.7333
- Mark as New
- Bookmark
- Subscribe
- Mute
- Subscribe to RSS Feed
- Permalink
I have an issue where the sample tool incorrectly reports values from a raster when using a point file. For example a point lies entirely within a raster cell and the sample tool provides a result of "49" when the identify tool correctly provides a results of the actual cell value of "19"
- Mark as New
- Bookmark
- Subscribe
- Mute
- Subscribe to RSS Feed
- Permalink
Your tiff... info reports a value for R, G, B
Your shapefile just has totally unrelated attributes.
What values are your expecting? and by chance are there other layers in your dataframe?
- Mark as New
- Bookmark
- Subscribe
- Mute
- Subscribe to RSS Feed
- Permalink
The Tiff has 6 bands
The point shapefile is used for sampling and wouldn't need to have related attributes.
No other layers are in my data frame
For example when I sample band 5 alone I get these values from the Sample tool in the output table
topo_seque 1 (alluvial site) - 49
topo_seque 2 (mid slope) - 48
topo_seque 3 (upper slope) - 44
From the identify tool I get these values by identifying from all layers and selecting each point ID in turn
ID 1 (alluvial site) - 53
ID 2 (mid slope) - 45
ID 3 (upper slope) - 19
- Mark as New
- Bookmark
- Subscribe
- Mute
- Subscribe to RSS Feed
- Permalink
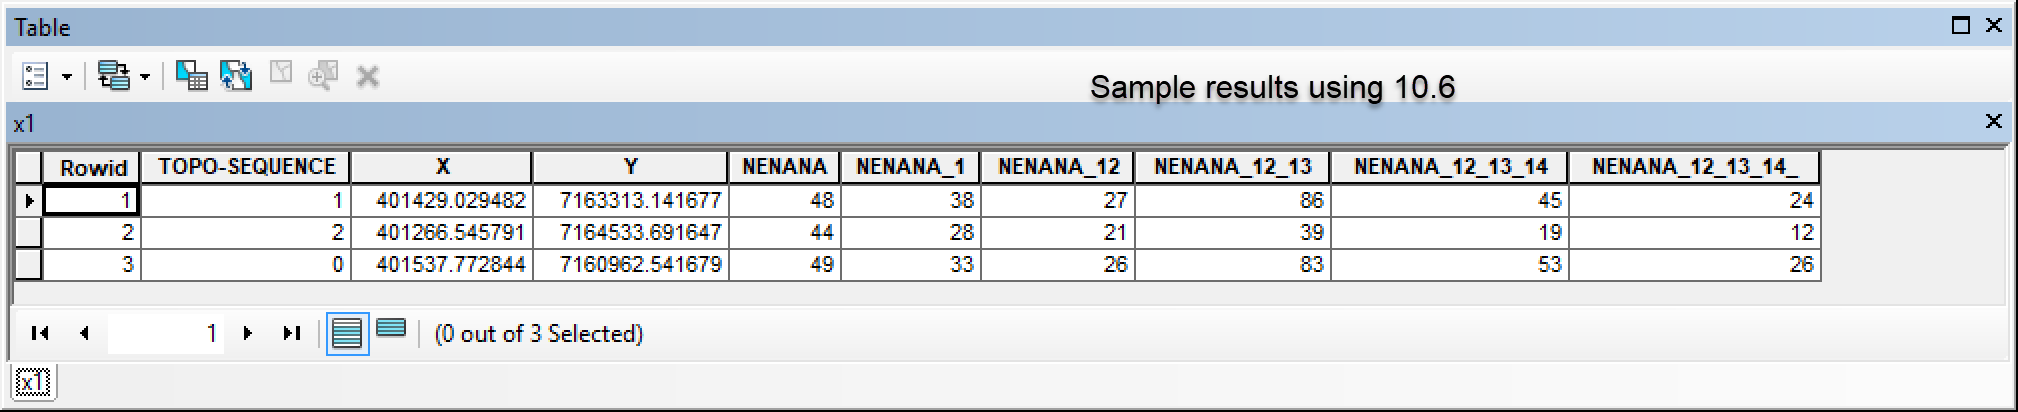
Do your sample results look like this? I only have 10.6 available. What looks different is what is assigned to RGB if you have 5 bands
- Mark as New
- Bookmark
- Subscribe
- Mute
- Subscribe to RSS Feed
- Permalink
| topo_seque | X | Y | Nenana | Nenana_1 | Nenana_12 | Nenana__13 | Nenana__14 | Nenana__15 |
| 2 | 401429.02948200000 | 7163313.14168000000 | 48.00000000000 | 38.00000000000 | 27.00000000000 | 86.00000000000 | 45.00000000000 | 24.00000000000 |
| 3 | 401266.54579100000 | 7164533.69165000000 | 44.00000000000 | 28.00000000000 | 21.00000000000 | 39.00000000000 | 19.00000000000 | 12.00000000000 |
| 1 | 401537.77284400000 | 7160962.54168000000 | 49.00000000000 | 33.00000000000 | 26.00000000000 | 83.00000000000 | 53.00000000000 | 26.00000000000 |
Hmm, I do get the same results as you when I bring in the tif as all bands instead of just band 5. In my table the Nenana__14 is the same as the original band 5. This reports the correct values unlike when I ran the sample tool on just band 5. In that case I only selected band 5 within the tif to bring into ArcMap and ran that with the sample tool.
- Mark as New
- Bookmark
- Subscribe
- Mute
- Subscribe to RSS Feed
- Permalink
I wouldn't have just isolated a single band for some reason... perhaps what band 5 is another column... who knows... but if the whole is right then 10.5 and 10.6 are reporting the same (I wouldn't use the info tool as defacto standard since I was getting only an r,g,b value and I didn't know what it chose for r, g or b)
- Mark as New
- Bookmark
- Subscribe
- Mute
- Subscribe to RSS Feed
- Permalink
Sorry I don't follow your logic. The sample tool and info tool bring back the same values when the sample tool is ran on the entire multiband tif file. The sample tool brings back different values when ran on just band 5. I'm not concerned about what was chosen for r,g, and b as the display option.
For some reason there is a difference in the results with the sample tool depending on if the multiband file is brought in as a whole or if just one band is added. That seems like it could pose a serious problem.
Edit: As it turns out it is reporting the correct values for band 1 even though I only brought in band 5. I think that's the issue.