- Home
- :
- All Communities
- :
- Products
- :
- Data Management
- :
- Geodatabase Questions
- :
- Re: GDB table with XY data fields won't put geomet...
- Subscribe to RSS Feed
- Mark Topic as New
- Mark Topic as Read
- Float this Topic for Current User
- Bookmark
- Subscribe
- Mute
- Printer Friendly Page
GDB table with XY data fields won't put geometry/points on map
- Mark as New
- Bookmark
- Subscribe
- Mute
- Subscribe to RSS Feed
- Permalink
- Report Inappropriate Content
Forgive my newness, I got tossed to the wolves with a project here at work just because once upon a time I was a Geography major. I'm really good and unafraid as a software/computer user user and have tried my best to troubleshoot what I'm about to ask. I am at my wit's end though and need some help.
I am in a GDB that was set up by an outside entity to submit data to them that will show my company's locations on a map. Using ArcMap 10.5.1 and have a layer set up with a street basemap and the GDB. I open the table that is built into the GDB and then enter Edit Features mode. Rather than plot a point onto the map and have the table create a new object row, because I have a few hundred locations to list (each with about 18 pieces of data each, in the table) it is way easier to just past my data in from an Excel spreadsheet that I have open. Here's the problem...even though the XY data looks to be set up correctly when I look at the GDB/table fields in ArcCatalog, it will not plot a point/show geometry on the map. When I dig around in ArcCatalog, I can see so many options that I try and try to get me there, but I just can't figure it out - how to get it to use the XY data fields to then actually show a visual point ON the map.
If screenshots of anything would help...I'm happy to oblige.
Thank you in advance!!
- Mark as New
- Bookmark
- Subscribe
- Mute
- Subscribe to RSS Feed
- Permalink
- Report Inappropriate Content
Hi Julie,
if you have a standalone table, you have to create a geographic feature in order to see your point:
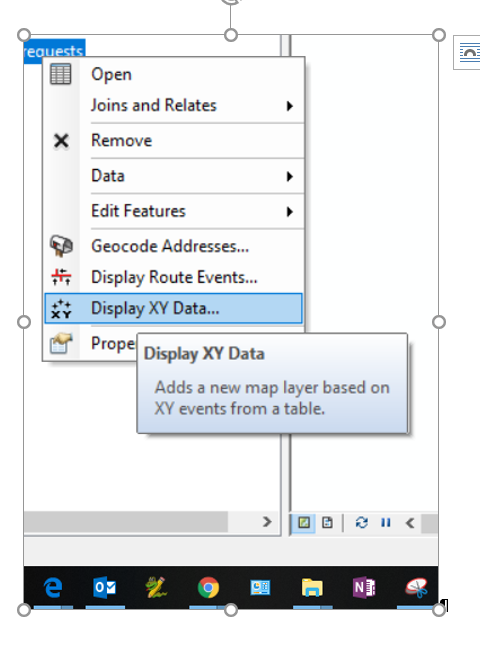
1. with your table in the Table of contents, right click on the table and click on Display XY data
then choose you x and y fields, set the right Coordinate System and click ok.
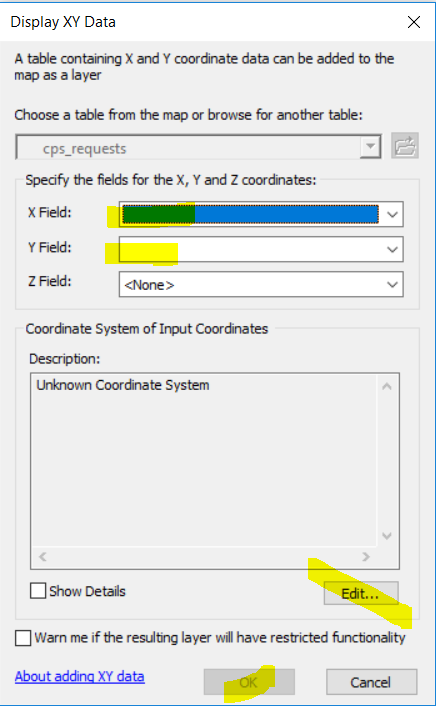
Check if your points are lining up in the correct location, otherwise you have to carefully check if the coordinate system inputted is correct.
Remember that you are creating an Event layer (it's a temporary view) not a feature class.
In order to save this view in your geodatabase, right click on the event layer > Data > export data
- Mark as New
- Bookmark
- Subscribe
- Mute
- Subscribe to RSS Feed
- Permalink
- Report Inappropriate Content
Display XY works great, but if your data is in a coordinate system, such as UTM or State Plane, that does not just have simple X and Y fields, you will need to use the Edit button on the Display XY box to choose your zone. And other data (such as MGRS) needing a little more work may require one of my favorite ArcToolbox tools, Convert Coordinate Notation.