Turn on suggestions
Auto-suggest helps you quickly narrow down your search results by suggesting possible matches as you type.
Cancel
- Home
- :
- All Communities
- :
- Services
- :
- Esri Technical Support
- :
- Esri Technical Support Blog
- :
- JavaScript Debugging Tips Part II – Google Chrome ...
JavaScript Debugging Tips Part II – Google Chrome and the Console Tab
Subscribe
4665
4
01-23-2017 10:00 PM
- Subscribe to RSS Feed
- Mark as New
- Mark as Read
- Bookmark
- Subscribe
- Printer Friendly Page
- Report Inappropriate Content
01-23-2017
10:00 PM
This blog post is the 2nd in a series of JavaScript debugging tips and tricks to help you on your way. See JavaScript Debugging Tips Part I – Google Chrome and the Network Tab for our first segment.
The most enjoyable part of any programming assignment is right near the beginning when you sit down with a pile of tools and resources and start hammering away at raw clumps of code. The more difficult part comes when you attempt to launch the application, only to watch that tightly-written code unravel into multiple late nights staring at a computer screen. However, all is not lost, as we have an excellent recommendation for you, which is the subject of this blog: the Console tab inside your favorite browser's Developer Tools.
If you’re feeling upset or emotional, the Console tab is the perfect choice for you. Maybe someone in your family is dealing with a difficult time, and could use some cheering up. Consider the Google Chrome Console tab (gluten free options are available). Users who like the Console tab might also enjoy the ArcGIS API for JavaScript.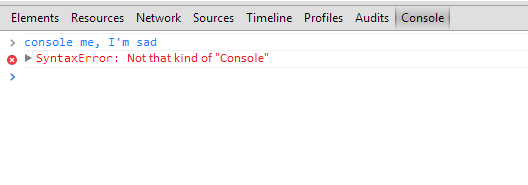
As we wrote in Part I, accessing the Chrome Developer Tools is easily done using shortcut keys (Control + Shift + I) or by navigating to the top right of the browser, clicking on the hamburger and choosing “More Tools”, then “Developer tools”.
Once the Developer Tools are open (other Developer Tools are available in other browsers), there are several Tabs that become accessible to you. Here we will focus on the Console. If you want to open the Console tab in Chrome Developer Tools directly, use this keyboard shortcut: Control + Shift + J (the “J” stands for jocular). For more neat tips, please check out the official Google documentation about Chrome DevTools: Using the console.
The Console is used for two purposes: 1) to display logged information from an application's JavaScript (usually during application development), and 2) to interrogate objects and execute JavaScript interactively. In this blog, we will look at both kinds of examples, and elaborate on some additional tips and tricks that we use in Technical Support.
The first thing we can do is to add some “console.log” statements inside our application. We will take a modified sample, hosted on GitHub, which can be found here: Sample Console Application. Feel free to follow along at home.
At lines 60-62, and again at line 66, we’ve added some of those “console.log” statements to display information about our Feature Layer. Our use case is that we are creating a web mapping application, and during our testing, we want to ensure that the data we are consuming from ArcGIS Online is the correct data to display on the map. To this end, we print out a few choice pieces of information about the Feature Layer: the title of the layer, and the URL of the layer. Since I do not know the syntax for the URL property, I use “URL” and “url” as seen below.
Here is a screenshot of the output of the “console.log” statements. We see the relevant information we were expecting. Also, please note that the output for “featureLayer.URL” is “undefined”. This is because items in the console are case sensitive. The valid property is “featureLater.url”, and invalid properties do not throw an error, and instead return an undefined result. This can be a tricky thing to trap, but later on in this blog we will look at some tips for dealing with this sort of issue.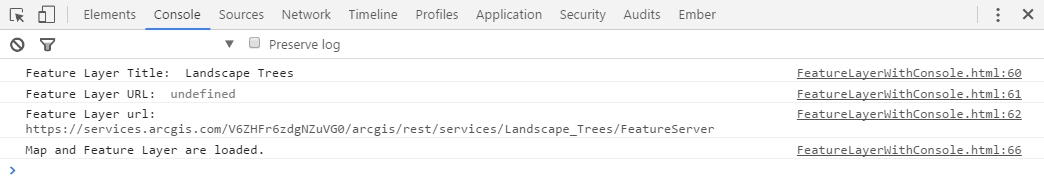
With the Console still open, let’s try entering the same property values from the code:
Notice that all of these properties now return an error, instead of an actual value (or even “undefined”). This is because the local variables are no longer in scope after the app is initialized, so even the “featureLayer” object cannot be recognized. Here is a screenshot of the output of the new console statements.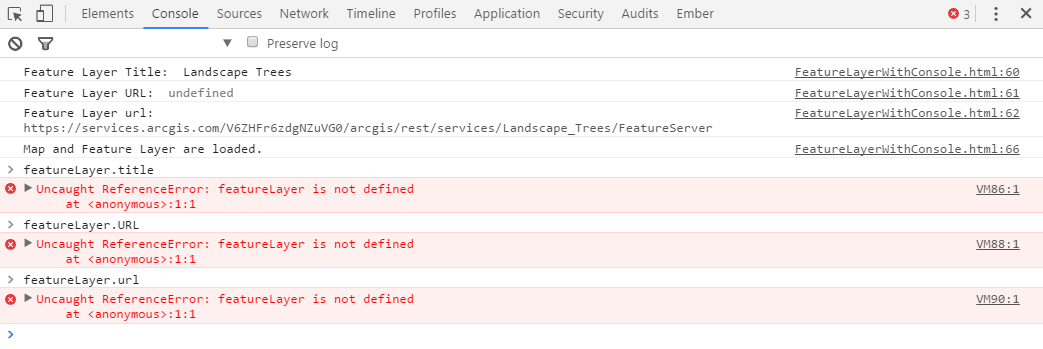
If we had made “featureLayer” a global variable, we would then see “undefined” returned for the object in the Console (variable is known, but the details are still not accessible). The point is: only variables that are in scope can be interrogated in the Console. So can we use the Console interactively and type in property values? Let’s find out.
The next thing we can do to our sample app is to add a “debugger;” statement in the code. We will take another modified sample, hosted on GitHub, which can be found here: Sample Console Application 2. Feel free to follow along at home.
At line 60, we’ve added a “debugger;” statement to help display information about our Feature Layer in the Console.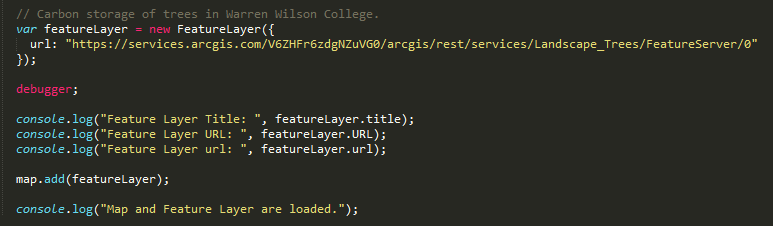
How does this statement work? Click the link to run the application. Then, open the Developer Tools (Control + Shift + I or Control + Shift + J), and refresh the application. The application should pause, and you should see a “Paused in debugger” message at the top of the screen, and the “debugger” line highlighted in the Sources tab: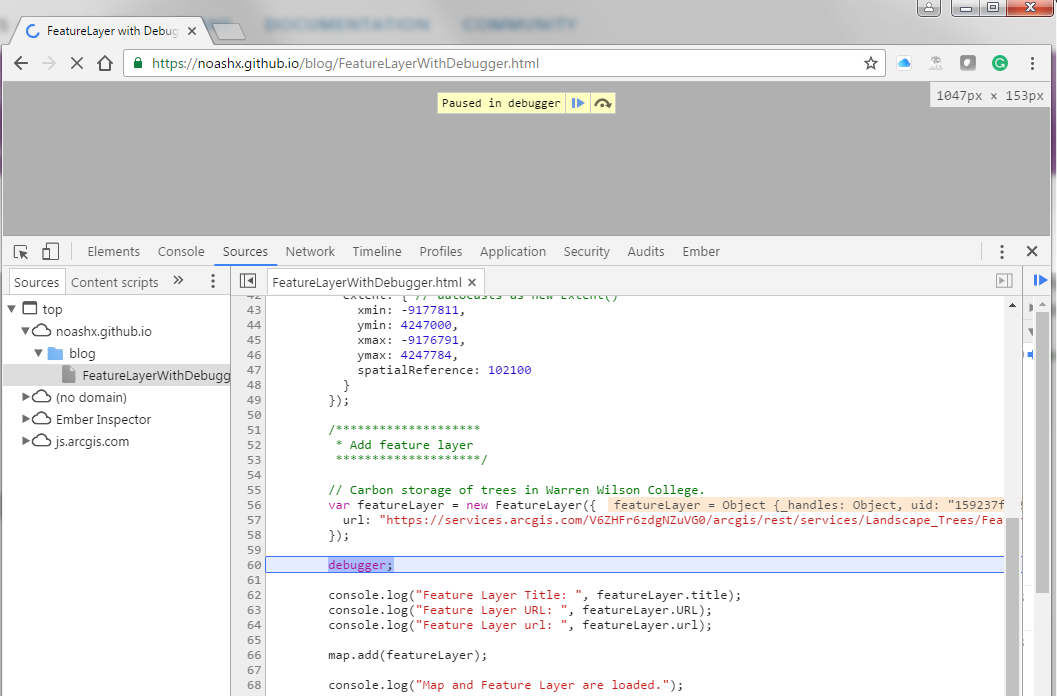
Now, with the application paused, we can go back to the Console tab, and try interrogating the featureLayer properties again. Here we see that we have proper scope to the variable and we can see the output: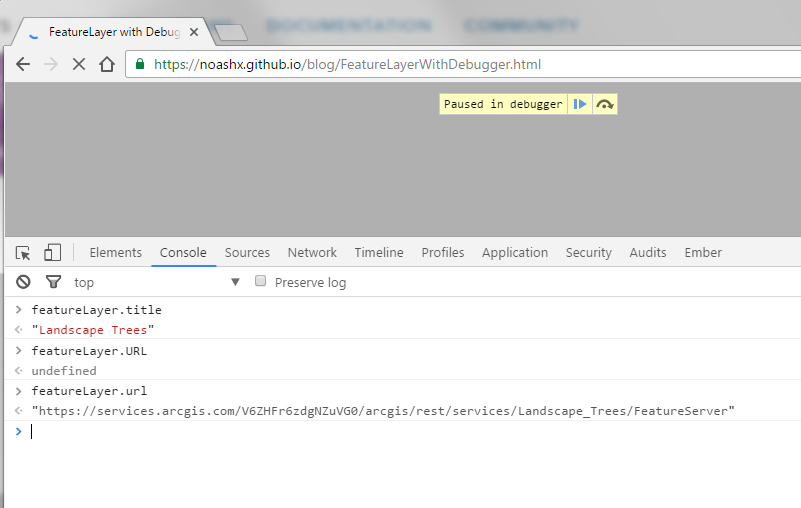
Cool, right?
Let’s look at another option, similar to “debugger”. Back to the Sources tab, notice the line numbers to the left of the code. If we left-click on a line number, we can set a breakpoint, which will have the exact same effect as writing “debugger” in the code. Left-click on lines 56, 62, and 66 in the same application, then refresh the application.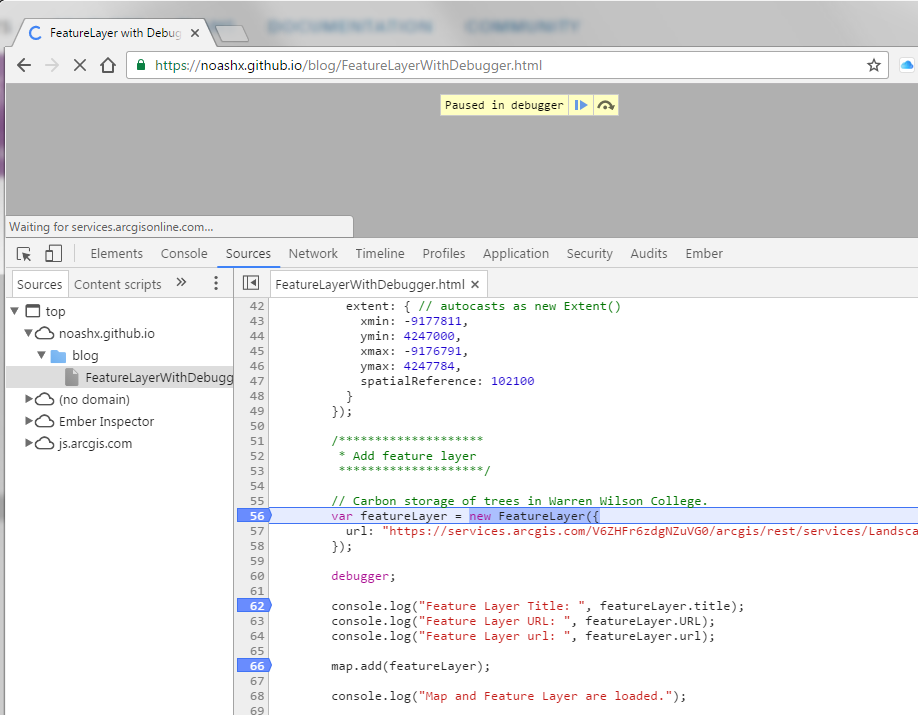
The application pauses immediately at the first breakpoint. Now, we could go back to the Console tab and again inspect variables and properties to our heart's content. Not only that, by clicking the curved arrow to the right of the Play button at the top of the screen, we can step through our application and watch the excitement as we see how the code executes step-by-step. Or, we can click the Play button at the top of the screen, and let the application run to completion, or to the next breakpoint.
And another Play button click brings us to the next breakpoint.
The point of this blog is to highlight the usefulness and functionality of the Console, but we do want to point out another usage of setting breakpoints here as well. Breakpoints allow the developer the ability to see the order in which asynchronous code executes, how functions are run and what parts get skipped or fail. For more information about debugging tips with JavaScript applications, here are a couple additional resources from the past several years:
In this installment, we learned how to access and use the Console tab inside Chrome Developer tools to reveal the properties and values of variables and objects in our JavaScript code. This information can greatly facilitate the debugging and coding of a web-based application. This concludes part two of a multi-part series on JavaScript Debugging Tips. Join us next time when we delve even deeper into some Developer Tools, and we all get raises. Happy debugging!
Noah S. and John G. - SDK Support Services
The most enjoyable part of any programming assignment is right near the beginning when you sit down with a pile of tools and resources and start hammering away at raw clumps of code. The more difficult part comes when you attempt to launch the application, only to watch that tightly-written code unravel into multiple late nights staring at a computer screen. However, all is not lost, as we have an excellent recommendation for you, which is the subject of this blog: the Console tab inside your favorite browser's Developer Tools.
If you’re feeling upset or emotional, the Console tab is the perfect choice for you. Maybe someone in your family is dealing with a difficult time, and could use some cheering up. Consider the Google Chrome Console tab (gluten free options are available). Users who like the Console tab might also enjoy the ArcGIS API for JavaScript.

I obviously do not understand homographs
As we wrote in Part I, accessing the Chrome Developer Tools is easily done using shortcut keys (Control + Shift + I) or by navigating to the top right of the browser, clicking on the hamburger and choosing “More Tools”, then “Developer tools”.
Once the Developer Tools are open (other Developer Tools are available in other browsers), there are several Tabs that become accessible to you. Here we will focus on the Console. If you want to open the Console tab in Chrome Developer Tools directly, use this keyboard shortcut: Control + Shift + J (the “J” stands for jocular). For more neat tips, please check out the official Google documentation about Chrome DevTools: Using the console.
The Console is used for two purposes: 1) to display logged information from an application's JavaScript (usually during application development), and 2) to interrogate objects and execute JavaScript interactively. In this blog, we will look at both kinds of examples, and elaborate on some additional tips and tricks that we use in Technical Support.
The first thing we can do is to add some “console.log” statements inside our application. We will take a modified sample, hosted on GitHub, which can be found here: Sample Console Application. Feel free to follow along at home.
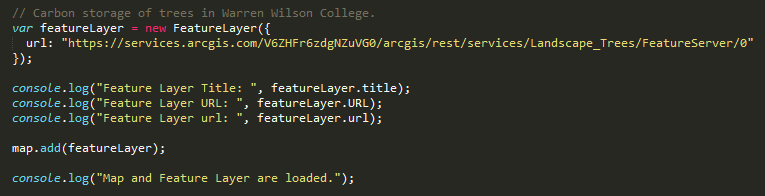
At lines 60-62, and again at line 66, we’ve added some of those “console.log” statements to display information about our Feature Layer. Our use case is that we are creating a web mapping application, and during our testing, we want to ensure that the data we are consuming from ArcGIS Online is the correct data to display on the map. To this end, we print out a few choice pieces of information about the Feature Layer: the title of the layer, and the URL of the layer. Since I do not know the syntax for the URL property, I use “URL” and “url” as seen below.

JavaScript console.log statements
Here is a screenshot of the output of the “console.log” statements. We see the relevant information we were expecting. Also, please note that the output for “featureLayer.URL” is “undefined”. This is because items in the console are case sensitive. The valid property is “featureLater.url”, and invalid properties do not throw an error, and instead return an undefined result. This can be a tricky thing to trap, but later on in this blog we will look at some tips for dealing with this sort of issue.

JavaScript Console Output from console.log
With the Console still open, let’s try entering the same property values from the code:
featureLayer.titlefeatureLayer.URLfeatureLayer.url
Notice that all of these properties now return an error, instead of an actual value (or even “undefined”). This is because the local variables are no longer in scope after the app is initialized, so even the “featureLayer” object cannot be recognized. Here is a screenshot of the output of the new console statements.

JavaScript Console Output after App is loaded
If we had made “featureLayer” a global variable, we would then see “undefined” returned for the object in the Console (variable is known, but the details are still not accessible). The point is: only variables that are in scope can be interrogated in the Console. So can we use the Console interactively and type in property values? Let’s find out.
The next thing we can do to our sample app is to add a “debugger;” statement in the code. We will take another modified sample, hosted on GitHub, which can be found here: Sample Console Application 2. Feel free to follow along at home.
At line 60, we’ve added a “debugger;” statement to help display information about our Feature Layer in the Console.

JavaScript debugger statement
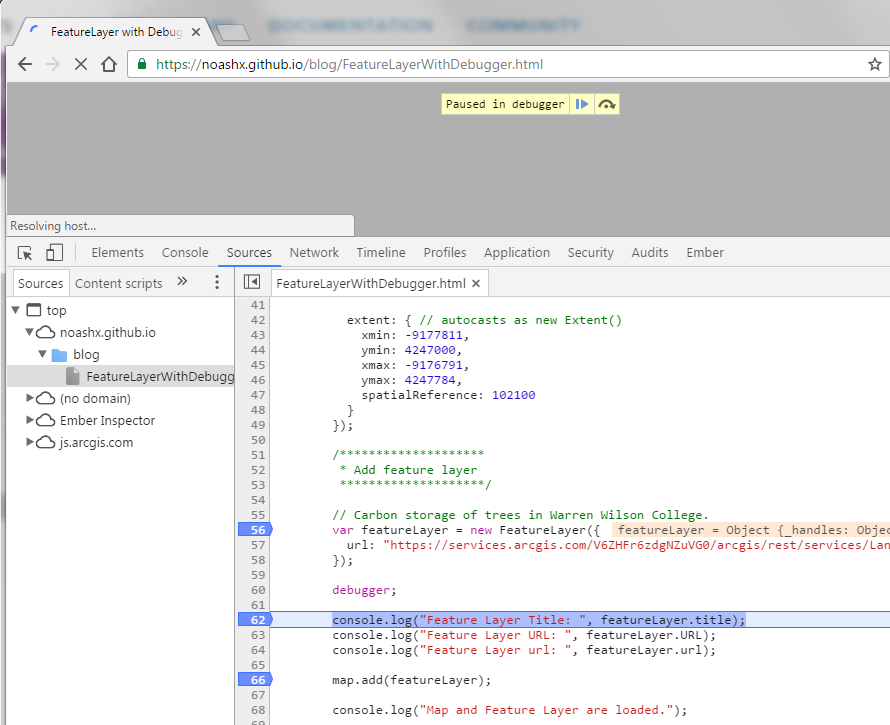
How does this statement work? Click the link to run the application. Then, open the Developer Tools (Control + Shift + I or Control + Shift + J), and refresh the application. The application should pause, and you should see a “Paused in debugger” message at the top of the screen, and the “debugger” line highlighted in the Sources tab:

Paused in debugger 1
Now, with the application paused, we can go back to the Console tab, and try interrogating the featureLayer properties again. Here we see that we have proper scope to the variable and we can see the output:

Paused in debugger 2
Cool, right?
Let’s look at another option, similar to “debugger”. Back to the Sources tab, notice the line numbers to the left of the code. If we left-click on a line number, we can set a breakpoint, which will have the exact same effect as writing “debugger” in the code. Left-click on lines 56, 62, and 66 in the same application, then refresh the application.

Breakpoint 1
The application pauses immediately at the first breakpoint. Now, we could go back to the Console tab and again inspect variables and properties to our heart's content. Not only that, by clicking the curved arrow to the right of the Play button at the top of the screen, we can step through our application and watch the excitement as we see how the code executes step-by-step. Or, we can click the Play button at the top of the screen, and let the application run to completion, or to the next breakpoint.

Breakpoint 2
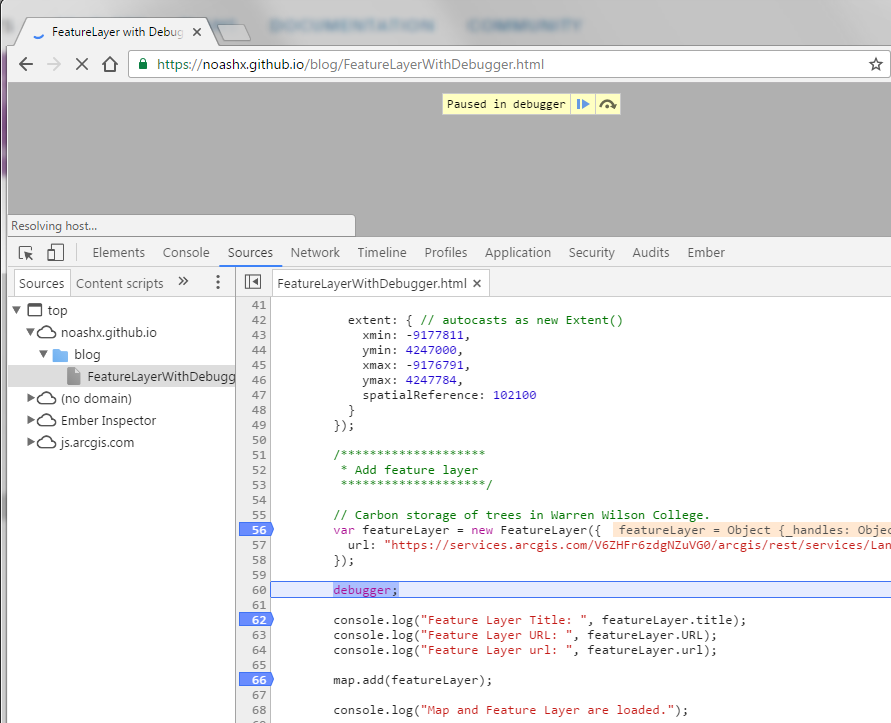
And another Play button click brings us to the next breakpoint.

Breakpoint 3
The point of this blog is to highlight the usefulness and functionality of the Console, but we do want to point out another usage of setting breakpoints here as well. Breakpoints allow the developer the ability to see the order in which asynchronous code executes, how functions are run and what parts get skipped or fail. For more information about debugging tips with JavaScript applications, here are a couple additional resources from the past several years:
- Advanced Debugging With JavaScript (2009)
- Debugging JavaScript with Chrome DevTools Breakpoints (2016)
- JavaScript Debugging Tips Part I (2014)
In this installment, we learned how to access and use the Console tab inside Chrome Developer tools to reveal the properties and values of variables and objects in our JavaScript code. This information can greatly facilitate the debugging and coding of a web-based application. This concludes part two of a multi-part series on JavaScript Debugging Tips. Join us next time when we delve even deeper into some Developer Tools, and we all get raises. Happy debugging!
Noah S. and John G. - SDK Support Services
Labels
4 Comments
You must be a registered user to add a comment. If you've already registered, sign in. Otherwise, register and sign in.
About the Author
Noah Sager is a Product Engineer on the ArcGIS Maps SDK for JavaScript team at Esri. Prior to joining Esri, he mapped utility lines around Appalachia, investigated public restroom access in Chicago, and studied foraging behavior in squirrels in Canada.
Labels
-
Announcements
70 -
ArcGIS Desktop
87 -
ArcGIS Enterprise
43 -
ArcGIS Mobile
7 -
ArcGIS Online
22 -
ArcGIS Pro
14 -
ArcPad
4 -
ArcSDE
16 -
CityEngine
9 -
Geodatabase
25 -
High Priority
9 -
Location Analytics
4 -
People
3 -
Raster
17 -
SDK
29 -
Support
3 -
Support.Esri.com
60
- « Previous
- Next »