Esri Technical Support Blog - Page 2

cancel
Showing results for 
Show  only  | Search instead for 
Did you mean: 

Latest Activity

(383 Posts)
by Anonymous User
Not applicable

Picture the scenario: You are working with Collector for ArcGIS, but you continue experiencing minor problems with adding points. You give your friendly Esri Support Analyst a call and they begin walking you through some steps to troubleshoot the app. You’re not seeing the options they’re talking about, and it’s getting a little frustrating. If only there was a way to show the Esri Analyst your screen so things could go more smoothly….Well there is! It is possible to share the screen on your iOS and Android devices using Zoom.

Please be aware that iOS 11 or later is required to perform screensharing with Zoom


To screenshare from a Mobile Device with Zoom....

1. Install the Zoom app from the Google or Apple Store on the mobile device

2. Launch the Zoom app > Ignore Sign In/Sign Up and click on "Join a Meeting"

3. You will be prompted for the meeting ID, just as you would on a desktop. Enter the meeting ID provided by the analyst

4. Once you have joined the meeting, things are a little different for beginning the share between Android and iOS

Android:
5a. Tap the black screen once and you will see a toolbar come up from the bottom. Click "Share Content." Click "Allow" if prompted to give the device permissions to share. You are now sharing on an Android device.

iOS (>11 only):

5b. Add Screen Recording to the Control Center 
> Settings > Control Center > Customize Controls > Add Screen Recording

6. Once Screen Recording is added, swipe up from the bottom of the screen to display the Control Center

7. Tap and HOLD the Screen Record button > A dialogue will pop up to have you switch Screen Recording from Camera Roll to Zoom

8. Start Broadcasting > 3,2,1 countdown will begin and the screenshare will begin after 1.


If you would like to get in contact with an Esri Support Analyst, please call 1 (888) 377-4575 and choose option 2. You can also visit our website to request a case or begin a live chat: https://support.esri.com/en/contact-tech-support

Happy Screensharing!

more
11 3 13K
by Anonymous User
Not applicable


Users/Administrators of ArcGIS Online Organizations may have noticed some irregularities with feature storage credit charges between January 1st and July 4th, 2018. This was a result of a bug in the credit accounting process that resulted in sporadic timeouts and increased execution times while running the feature storage credit calculation service. This issue fixed on July 4th, 2018. The operations team is working towards being able to detect such scenarios with improved monitoring of these services.

BUG-000100343: Occasionally, users are not charged for feature service storage for an hour at a time.


As a result of the bug, some organizations were sporadically not charged for feature storage in hour long increments over this time. Organizations will not be charged for any missing feature storage charges. Although no action is required on your part, we want to show you what the error may have looked on the status tab and point you to the reporting tools to understand credit storage. understand if you were affected by this bug


Identify irregularities:

1. Navigate to the status tab and view the last 60 days, or a time period that includes before and after July 4th

2. View Irregular and Consistent Feature Storage in status reporting.

NOTE: Keep in mind that if members in the organization were publishing, deleting or adding to new features to hosted feature layers, feature storage may fluctuate due to changes in data storage.

3. Click on a specific day to verify if the charges were consistent for each hour. If there are sporadic missing hourly charges, then you have probably experienced BUG-000100343. If you are consistently charged hourly across the day, then you were not affected. As this bug was sporadic, you may have been affected on some days and not others, so feel free to check out multiple days.

BUG-000100343:


Correct hourly credit charges:


 4. To verify the amount of data stored for a specific day, click on the storage ring and view the table below. You will notice that the size remains the same when comparing the feature storage before July 4th and after July 4th, but the credits charged may vary.

BUG-000100343: Before July 4th 2.76 GB, 11.83 credits


After July 4th, 2.76 GB,  21.84 Credits


To verify your feature storage size, throughout this time period, please  view the feature storage details on the status dashboard. As mentioned above, there is no action required on your part, but as an administrator you can dig into your credit reporting to see if you were affected. If something doesn't quite seem right, feel free to get in touch with us in Technical Support to answer any questions.


Some helpful blog links:

Feature Storage Reporting on the Status Tab:

https://www.esri.com/arcgis-blog/products/arcgis-online/administration/understanding-feature-storage... 

Strategies for managing credits:

https://www.esri.com/arcgis-blog/products/arcgis-online/administration/five-strategies-and-tools-for... 

Help:

http://doc.arcgis.com/en/arcgis-online/reference/credits.htm 

http://doc.arcgis.com/en/arcgis-online/administer/view-status.htm#ESRI_SECTION1_1D001100A7A24CDF85A0...     

more
5 0 2,830
GeorgePlumley
Occasional Contributor

I'm trying to download some base maps that covers the extent of Alaska using the Download Map Tool in ArcGIS Pro 2.2, but since Alaska spans across the 180° line I get everything except the area that I want. Hopefully this can be addressed in a future update.

I've included a couple screen captures, one of the area of interest, and the other being the resulting tile package.

Thanks

more
0 0 1,832
MunachisoOgbuchiekwe
New Contributor III

Introduction

This is a quick blog post to show how easy it is to integrate beautiful graphs into your JavaScript application using the 4.x API. If you are new to the ArcGIS API for JavaScript, we provide an easy way to get started making web mapping applications. Head over to the ArcGIS API for JavaScript site to get started. For this sample we will be using a third party library called Chart.js. Chart.js is a simple yet flexible JavaScript charting library which makes it easy to make simple graphs for your data.

Load in the Chart.js library into your JavaScript application

In order to use Chart.js in our application we need to load it in as a module. This is because Dojo uses Asynchronous Module Definition (AMD) format to load in modules as supposed to loading in a file using a script tag. To achieve this we can use dojoConfig to load in our custom JS package as a module.

<script>
        const options = {
            // tell Dojo where to load other packages
            dojoConfig: {
                async: true,
            packages: [
                {
                    location: 'https://cdnjs.cloudflare.com/ajax/libs/Chart.js/2.7.2/Chart.js',
                    name: 'Chart'
                }
            ]
            }
        };
</script>
<script src="https://js.arcgis.com/4.7/"></script>‍‍‍‍‍‍‍‍‍‍‍‍‍‍‍‍‍‍‍‍‍‍‍‍‍‍‍‍‍‍

As you can see from the sample code above, we are going to tell dojo to load in a module from a Content Delivery Network (CDN). In this case we are using the CDN that Chart.js provides for us. You can also install the files through a package manager like npm or Bower. You can learn the different ways of installing Chart.js through their Installation documentation. To avoid any potential errors, ensure the dojoConfig is declared before the ArcGIS for JavaScript API.

Integrating Chart.js in your JavaScript application

Once you have completed the above steps, we can now use Chart.js in our JavaScript file...

require([
    "esri/Map",
    "esri/views/MapView",
    "esri/PopupTemplate",
    "esri/layers/FeatureLayer",
    "esri/widgets/Popup",
    "esri/tasks/support/Query",
    "https://cdnjs.cloudflare.com/ajax/libs/Chart.js/2.7.2/Chart.js",
    "dojo/domReady!"
  ],
  function (Map, MapView, PopupTemplate, FeatureLayer, Popup, Query, Chart)‍‍‍‍‍‍‍‍‍‍‍‍‍‍‍‍‍‍‍‍‍‍

In the require array we put in the CDN link to the library. We then name the module Chart so that we can create a new instance of it later on in our code.

Querying data from a Feature Layer

In this example I am using a Feature Layer of California from ArcGIS online . Each time I click on a county, I want a pop up to show information about the demographics of the area. For this we can use a Query, which will allow us to get information from our Feature Layer and spatially query the layer to only show data where we clicked. Once the promise has resolved, we will call the view's PopUp and send the data to setContentInfo. This is a function that will create the chart for us. The setContentInfo function will be explained more in detail on the next section. Here is the code snippet that shows this.

   var query = new Query();

    query.returnGeometry = true;
    query.outFields = ["STATE_NAME", "WHITE", "BLACK", "ASIAN", "HAWN_PI", "OTHER", "HISPANIC"];
    query.where = "1=1";
    query.num = 50;

    // On view click, query the feature layer and pass the results to setContentInfo function.
    view.on("click", (e) => {
      query.geometry = e.mapPoint;
      featureLayer.queryFeatures(query).then((results) =>{
        if(results.features[0].attributes.STATE_NAME === "California"){
          view.popup.visible = true;
          view.popup.open({
              title: "Doughnut Graph Example",
              content: setContentInfo(results.features[0].attributes)
          });
        }
      });
    });‍‍‍‍‍‍‍‍‍‍‍‍‍‍‍‍‍‍‍‍‍‍‍‍‍‍‍‍‍‍‍‍‍‍‍‍‍‍‍‍

Create a graph using Chart.js

We now get to include the Chart module that we instantiated awhile ago. In the previous code we set the content parameter to a function called setContentInfo and passed in the data. In the next code snippet, we are going to create this function and use it to initialize our charts inside the pop up. To start off we are going to create a new canvas element and give it the id of myChart.

var canvas = document.createElement('canvas');
canvas.id = "myChart";‍‍‍‍

Then we are going to set up the Data Structure object with our own data. In this particular case we are using a doughnut graph which would have a different Data Structure than a line graph. For more information about the different types of charts you can use, please see the following documentation on the Chart.js website. For a doughnut graph the object would look like the following code snippet below.

var data = {
      datasets:[{
        data: [results.ASIAN, results.BLACK, results.HAWN_PI, results.HISPANIC, 
                 results.OTHER, results.WHITE],
        backgroundColor: ["#4286f4", "#41f4be", "#8b41f4", "#e241f4", "#f44185", "#f4cd41"]
      }],
      labels: [
        'Asian',
        'Black',
        'Hawaiian',
        'Hispanic',
        'Other',
        'White'
      ]
    };‍‍‍‍‍‍‍‍‍‍‍‍‍‍‍‍‍‍‍‍‍‍‍‍‍‍‍‍‍‍

You can see that in the data array, we are setting the results that we got from our feature layer. Each result will represent one piece of the doughnut graph, the backgroundColor is also set for each result value. Additionally, the labels attribute is set for each item in the data array.

Finally, our last step is to create a new Chart object with the data and type properties. Then we return the Chart object.

var myPieChart = new Chart(canvas,{
      type: 'doughnut',
      data: data
  });
return canvas;‍‍‍‍‍‍‍‍‍‍

Once the object is return we should get a chart inside our pop up showing demographic information each time we click on a county. You can also create this sample using TypeScript. Here is a link to the sample, if you are wondering how it would look in TypeScript.

Tip: Here is a quick video showing how the sample works.

Conclusion

The ArcGIS API for JavaScript makes it super simple to integrate beautiful graphs from third party libraries like Chart.js. There are many more libraries that you can integrate into your JavaScript application like this that allows you to make powerful maps with additional functionality. Feel free to head over to the GitHub Gist page for the full sample.

more
5 3 5,763
AlanRex1
Esri Contributor

In a previous blog post, my esteemed colleague and board game nemesis Kelly Gerrow-Wilcox discussed the basics of capturing web traffic in a web browser using the built in browser developer tools.  But what about when you’re consuming services in ArcGIS Pro, ArcMap or any other non-browser client?  Enter: web traffic capturing tools.  There are numerous free tools (such as Fiddler, Wireshark, Charles and others) which allow users to capture web traffic from their computers.  This blog will focus on capturing HTTP/HTTPS traffic using Fiddler.  I've chosen Fiddler because of its relatively simple interface and broad adoption within Esri Technical Support. 

Basics: download, configuration and layout

Fiddler can be downloaded here.  After installation, the only critical configuration that needs to 
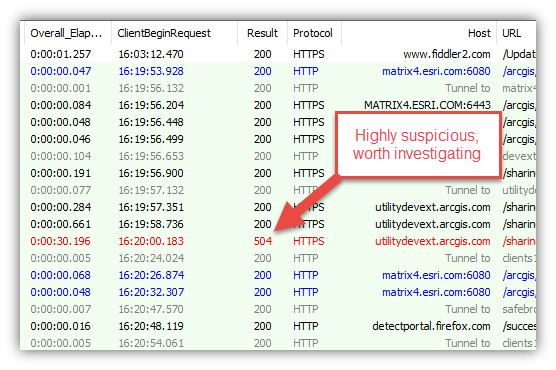
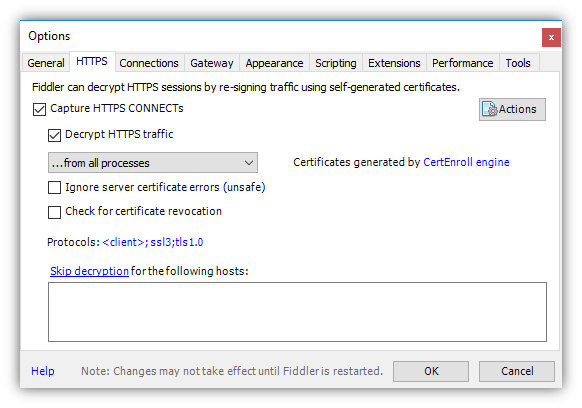
occur is to enable it to capture traffic over HTTPS.

  1. With Fiddler open go to Tools > Options
  2. In the pane that opens, check Capture HTTPS CONNTECTs and Decrypt HTTPS traffic. (This allows you to capture any requests sent using HTTPS, which is slowly but inevitably replacing HTTP as the protocol for transferring data across the web). 

If it’s necessary to capture network traffic from a mobile device, some extra configuration is required.  Both the mobile device and the machine where Fiddler is installed will need to be using the same wifi network.  The following documents outline the steps to capture mobile traffic:

The Fiddler application itself is split into two main sections; the Web Session
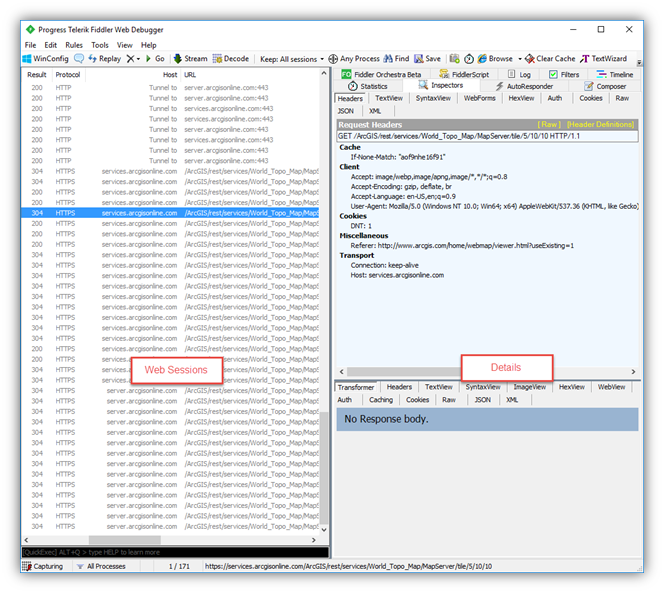
s list and the…other pane (I couldn’t find an official name so for the purposes of this blog we’ll refer to it as the Details pane). 

The Web Sessions pane includes a sequential list of every request sent by the client to a web server.  Important information contained here includes:

  • The type of protocol used (HTTP or HTTPS)
  • Which server the request was sent to, and the full URL
  • The HTTP/HTTPS response code (here’s a description of what these mean)
  • The size of the body of the response (in bytes)
  • The content type (image, text, etc)


Note: the columns in the Web Sessions pane can be custom configured by right clicking anywhere in the headers and selecting Customize Columns.  Some useful fields to turn on can be:

  • Overall Elapsed (available under Collection: Session Timers. This is the overall time it takes for the request to be sent and returned)
  • ClientBeginRequest (available under Collection: Session Timers. This is the time your software first began sending the request, using your computer’s time)
  • X -HostIP (Select Collection: Session Flags and manually enter in the Header Name. This is the IP address of the server destination of the request)


If you click a single web session, that triggers the Details pane to populate with a wide variety of information for that specific request. 


Intermediate:  What do these details mean? Do they mean things? Let's find out!

There are numerous tabs in the Details pane.  The most useful (for our purposes) are Timeline, Statistics, and Inspectors.  The others are all advanced functionality outside of the scope of this blog.


The Statistics and Timeline tabs are both helpful when investigating any performance related issue, for example if a service is taking a long time to load in the Map Viewer.  The Timeline tab is useful for identifying which request in a multi-request process is acting as a bottleneck.  To utilize the Timeline tab, select multiple requests in the Web Sessions list.  The timeline will display the requests in a sequential “cascade” format.  Any requests taking an unusually long time will clearly stand out with a significantly longer bar in the timeline.


Statistics displays the exact times every step of the request took, from the client initially making a connection to the last step of the client receiving the response.  This breakdown is useful to potentially identifying which step in the process of a single request is acting as a bottleneck.  For example, if every step is taking a fraction of a second, but there is a multi-second pause between ServerGotRequest and ServerBeginResponse that would indicate that something on the server side is causing a slowdown. 


Lastly, the Inspectors tab is the where the bulk of information is displayed and likely where the vast majority of any troubleshooting will be done.  Here is where the curtain is drawn back to reveal the nitty gritty of how applications interact with web services.  Inspectors is further divided into two main sections; the Request information (everything related to the request sent by the client) and the Response information (everything related to the response returned by the server).  Both divisions have a nearly identical set of subdivisions which display the content of the request/response in different formats.  Below are the useful tabs for our purposes:

  • Headers – A list of additional information that is not part of the main request. This may include information like security/authentication information, the data format of the request or response, the type of client making the request, etc. This is a good place to find an ArcGIS Online token, when relevant.
  • WebForms (request specific) – Depending on the type of request, this will display a breakdown of each request parameter and the value of that parameter. For example, when submitting a search query this section will display the parameters of the query (like keywords, date ranges, etc).
  • ImageView (response specific) – If the request is for an image, the ImageView will display the image which is returned. Obviously, this is particularly useful for requests involving tiled services.
  • Raw – This will display the entire request or response in text format.
  • JSON – If the request/response includes content in JSON format, this tab displays the content in a more human readable format. This is particularly useful for requests/responses to the REST api of ArcGIS Enterprise servers.
  • XML – If the request/response includes content in XML format, this tab displays the content in a more human readable format. This is particularly useful for requests/responses to OGC services.

Advanced: That’s great Alan.  But what am I supposed to actually do with this information? 

How you use network traffic information is going to depend on what you’re trying to learn or solve.  Checking network traffic can help identify the where and what of a problem but cannot tell you the solution.  This is where your knowledge of your app, your web services and if all else fails, some good old fashioned web searching come into play.  Here are a few common examples of ways to isolate the problem you’re facing:


  • Check the HTTP/HTTPS response code in the Web Sessions pane. Anything that isn’t 200 should be investigated (it might not necessarily be a problem, but it’s worth looking at).  Again, here’s a description of what these mean.  Even a 200 response could contain error messages or other useful information.
    • A 304 response from a server will trigger the client (web browser, ArcMap, etc) to use the client’s cache and Fiddler is therefore not actually capturing a complete response from the server. If there is a 304 response on a critically important request, try again either in Incognito mode or clear your client’s cache. 
    • A 401 or 403 response typically mean the server requires some sort of authentication. This would help, for example, identify an unshared feature service in a web map which is shared publicly. 
    • A 504 response typically means something timed out. Use this in conjunction with the Timeline, Statistics and Overall Elapsed column mentioned above to troubleshoot performance issues.

  • If you can’t find the problematic request, open the Raw, JSON or XML tabs of the response and just scroll through the requests looking for one that returns an error.
    • Raw, JSON and XML contain the exact same information, just formatted differently.
    • When errors occur, the error listed in the response may be more detailed than the error provided in the user interface of whichever application was being utilized.

  • Find a way to ignore irrelevant requests!!
    • One of the most challenging factors in troubleshooting network traffic is the volume of requests that are sent/and received for even minor actions. Below are strategies to help avoid cluttering your log with unnecessary requests.
      • Turn off Capture (File > uncheck Capture Traffic) when you know Fiddler’s not capturing relevant information.
      • Close any browser windows or background processes that don’t need to be running.
      • If Fiddler is capturing traffic you know is not related to what you’re investigating, Filter it out of the Web Sessions by right clicking a session > Filter > select what session parameter you want to filter.
      • If you’ve captured a number of requests that you know you don’t need, select and delete them.
      • Target Fiddler to only capture requests from a single application by clicking the ‘Any Process’ button (next to the small bullseye icon), holding and then releasing your mouse over the application you want to capture from. This would be useful, for example, to capture all traffic coming from ArcMap while ignoring everything that occurs with your browsers. 


Once you have isolated the request(s) relevant to the issue you’re investigating, the following tips can help determine what the actual problem is.

  • If you can isolate the problematic request, consider what is the nature of that request in order to help determine any next steps.
  • It’s possible to resend any requests by right clicking a Web Session > Replay > Reissue and Edit.
    • This is especially helpful for isolating a specific header or request parameter that might be problematic. Modify the information under WebForms or Headers to see if that fixes the problem you’re encountering or reproduces the problem you’re investigating.
    • If you have a request that’s succeeding and one that’s failing, copy the headers or WebForms parameters one at a time from the request that’s working to the request that’s failing. Once the request works, you’ve successfully isolated the parameter/header in the requests that’s causing the problem.
  • It’s possible to send repeated requests by right clicking a Web Session > Replay > Reissue Sequentially.
    • This is helpful for capturing issues which might be intermittent. Send the request 20 or 30 times automatically and see if hit the issue you’re looking for.
  • Web service query requests can be viewed in the browser with a user-friendly interface. This allows you to easily tweak and resend requests.  To view a query request in the browser:
  1. Right click the query session
  2. Copy > Copy the URL
  3. Paste in a browser window
  4. Change the section in the URL “…f=json…” to “…f=html…”
  5. Click enter to browse to the page


Fiddler and other network capture software are not silver bullets to solve all web traffic related GIS issues, but they are useful tools to help.  With a bit of practice, utilizing this type of software can help resolve a wide variety of issues when accessing web services in GIS applications. 

Got any good Fiddler (or general network traffic logging) tips?  Feel free to leave them in the comments!

more
23 11 26.7K
JuliePowell
Esri Contributor

This post provides insight into how we manage version 3.x of the ArcGIS API for JavaScript (JSAPI) release plan and technical support strategy.


The JavaScript development team has made great progress bringing version 4.x of the JSAPI closer to parity with 3.x, meanwhile introducing new tech for building very dynamic, expressive 2D and 3D apps. Over the next year, each release will be a balance between capabilities for reaching full parity with 3.x and brand-new innovation. Many customers’ app requirements are fully met by the current release of the 4.x API (4.7) while others are still dependent on 3.x (either with existing apps that they are maintaining or new apps that have requirements such as full editing support). We also have many Esri apps built on 3.x, such as the 2D version of Web AppBuilder for ArcGIS.


Technical Support Plan

Because we have a large customer base that still depends on 3.x, we are very careful about how we manage the Product Life Cycle (PLC). Our strategy is to make all PLC dates relative to our estimation of the last 3.x release. When is the last release? It depends on when we reach full parity in 4.x, enabling us to move critical apps such as ArcGIS Online’s map viewer to 4.x. When we reassess our estimation of the final release date, PLC phase dates are updated accordingly.


Relative dates for each PLC phase are determined in the following manner:

- 3.x remains in "General Availability" until the last release of 3.x.

- 3.x moves into "Mature Support" after the last release, and lasts for 1 year. 

- 3.x is retired 3 years after General Availability ends. 

For more information about the above software support phases and what they entail, refer to the PLC.


Recent Update to the PLC

Version 3.x was scheduled to move into mature phase next month; July 2018. Based on the current status of the API, this was moved to July 2019, with the mature phase starting August 2019 and retirement in August 2022. As mentioned above, these dates will be revisited depending on progress made towards 3.x parity.


If you need further clarification on the above, please reach out to Technical Support through the normal channels.

 ArcGIS API for JavaScriptKwasi Asante‌ 

more
6 4 4,891
Sharadarya
New Contributor

I am using SQL server 2012 SP1 and created the SQL Query Layer and once I open it in ArcMap 10.3.1 then I find few feature disappeared at the bottom. Also, I do pan the map to the bottom and do refresh the map ,features get disappeared. I search the same issue in Google and find out the below URL :

http://desktop.arcgis.com/en/arcmap/10.3/manage-data/gdbs-in-sql-server/sqlserver-spatial-types-and-...

Is it the same issue with SQL Server 2012 also.

Is any map frame defined for query layer in which data can not be displayed beyond that.

Your help would be highly appreciated.

more
0 0 865
AlanRex1
Esri Contributor

Have you ever suspected that there might be a service disruption with ArcGIS Online or one of the services provided by Esri?  Perhaps you can’t add a layer to your web map, or you’re receiving errors when trying to access the REST endpoint or item page of a service?  Although service disruptions are rare, this article will provide you with some resources to easily report a problem and get in contact with us to troubleshoot, ask questions and get things working again.


What are service disruptions?

ArcGIS Online is Software as a Service and is designed to be available always. In the rare event that you notice one of the services hosted in the Esri Cloud is not responding, not loading, or providing error messages and you suspect it may be caused by the underlying architecture, please report this as a potential service disruption. Many services are covered under the ArcGIS Online Service Level Agreement (SLA) and have guaranteed uptime. Whether it’s covered by the SLA or not, if you suspect there are issues with any Esri service, it’s important to report the problem.


How to confirm whether there is a known issue with ArcGIS Online

The ArcGIS Online Health Dashboard is the best resource for determining whether ArcGIS Online is experiencing any known issues, including historical incidents in the past 28 days. 


How to report a service disruption

If you think you are encountering a service disruption, please report it to Esri Technical Support!  You can report a service disruption at the link above by either calling the Support number, starting a Chat or clicking the ‘Request a Case’ link to create a case via a webform.  If you select ‘Request a Case’, be sure to select ‘ArcGIS Online Outage’ under the Issue Category section (during Step 2 in the webform) so that your case is correctly flagged as a potential service disruption.

Note: If you receive an error message trying to create a case via Chat or Request a Case, you can report a service disruption without authorized caller credentials by using the Report ArcGIS Online Service Disruption tool. Just follow the steps below:

  1. Go to the Request a Case page.
  2. Sign in (if you’re not already signed in within your browser session).
  3. Following the error message about not being able create a case, you will be provided with a list of options, including Report ArcGIS Online Service Disruption. Click this link.
  4. When prompted, submit your contact information and a brief description of the issue. Please provide the URL of the service you’re having issues with, a description of your steps to reproduce the problem and the text of the error you get (if an error is received).  With this information we can investigate the specific issue as soon as we receive the report, even before we talk to you personally.


What will Tech Support do once an issue is reported?

Once an issue is reported, Tech Support will first attempt to determine the nature of the issue: whether it appears to be an issue with the Esri-maintained infrastructure or services, or an issue specific to the customer’s data, workflow, organization settings, etc.  If the issue is determined to be isolated to a customer’s data, workflow, organization settings, etc., Tech Support will continue to troubleshoot the issue to resolution.  If the issue is determined to be a service disruption with Esri maintained infrastructure or services, it will be reported to the ArcGIS Online Operations team for resolution. 

Note: The Report ArcGIS Online Service Disruption reporting link listed above is only used for service disruptions. If it is determined that a reported issue is due to another factor (such as network connectivity, data, or browsers) and not a service disruption, you will be redirected to the appropriate resource (your International Distributor, the authorized caller for your organization, GeoNet, etc.). 

Any tips for the overachievers?

Although it is not your responsibility as the customer to isolate any issue before calling Tech Support, we know that some of you are technical and detail-oriented, and love digging into service requests.  Here are some of the questions Tech Support will typically use to identify the source of service issues reported to us:

  • Is the issue browser specific? Does it happen in Chrome, Firefox, Safari, Internet Explorer or all of the above?
  • What service is generating the error?
    • Pro Tip: if you don’t know the service that is having the problem, network traffic logging can help you determine that. The Dev Tools functionality built into all web browsers are the most convenient tool for issues you see in your browser.  Third-party applications like Fiddler can be utilized to log traffic from non-browser clients like ArcMap, Pro, or custom applications. 
    • The blog Introduction to Monitoring Network Web Service Requests provides a good basic overview of logging network traffic. Service disruptions can often be identified by looking at the HTTP Status responses (the most common problematic responses being 403 – authorization error, 404 – not found, 500 – general server error, and 504 – timeout).  Performance issues can normally be identified by looking at the Time column. 
  • What is the error received? (This error might be either in a popup in the user interface, or it may appear as a message in the Response section of any network traffic logging application.)
  • If the issue is intermittent, how regularly does it occur?
  • Is it reproducible with other services within the organization?
  • Is it reproducible with other services outside the organization? 
    • Pro Tip: if you’re having a problem and your hosted service is on, for example, http://services3.arcgis.com, try Google searching site:http://services3.arcgis.com for hundreds of publicly accessible test services.  You may have to click “show omitted results” to get a complete list. 

more
12 0 5,526
MeganSingleton
Occasional Contributor III

Parlez-vous français? The award-winning Esri Support website is now available in French!

Note: To view Support.Esri.Com in a language other than your default language, navigate to the language selector in the footer on any Esri.com page and select the desired language.

The Esri Support website hosts many critical resources for the Esri community, such as popular technical articles, product lifecycle documentation, support downloads, and more. The launch of the site in the French language represents our commitment to making these resources readily available for ArcGIS users around the globe. 

The French version of Support.Esri.com joins the Chinese, German, Japanese, and Spanish versions of the website, and will be joined in the upcoming months by additional languages.

Stay tuned!

Merci,

The Esri Online Support Team

more
2 3 10.5K
tempJosephMayfield
New Contributor III

Sprechen SIe Deutsch? The award-winning Esri Support website is now available in German! 

The Esri Support website hosts many critical resources for the Esri community, such as popular technical articles, product lifecycle documentation, support downloads, and more. The launch of the site in the German language represents our commitment to making these resources readily available for ArcGIS users around the globe. 


The German version of Support.Esri.com joins the Chinese, Japanese, and Spanish versions of the website, and will be joined in the upcoming months by additional languages.


Note: To view Support.Esri.Com in a language other than your default language, navigate to the language selector in the footer on any Esri.com page and select the desired language.

more
3 0 679
39 Subscribers