
3D data is becoming more ubiquitous nowadays and is especially promoted throughout the ArcGIS Platform. From web scenes, to CityEngine, to ArcGIS Pro, there are many different applications to import, manage, model, and share your 3D data. To get the output you are looking for, it may require numerous steps and tools. To navigate some of these steps and tools, here are some tips and tricks for working with 3D data in ArcGIS.
3D File Coordinate Systems
The majority of 3D formats do not store a coordinate system. GeoVRML and KML are the lone exceptions. KML will use a WGS 1984 coordinate system and meters for the unit of measurement. All other types (DAE, 3DS, OBJ) must be placed properly, otherwise they may import at "0,0" (off the coast of Africa).
Trick #1If you are using CityEngine, you can drag and drop your shape from the Navigator window into the scene (this workflow assumes a scene coordinate system is already set). When you export the shape to a multipatch feature class, the coordinate system is created with the data so you can bring it into another ArcGIS product.
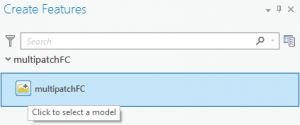
Import OverviewTrick #2The same workflow can be accomplished in ArcGIS Pro. Create an empty multipatch feature class, navigate to Editor > Create Features > Select Model, and click the globe to place the model.
 Trick #3
Use the Replace with Model tool (ArcScene or ArcGlobe) or the Replace with Multipatch tool (ArcGIS Pro).
 ArcGIS Desktop Replace with ModelArcGIS Pro Replace with MultipatchTrick #4
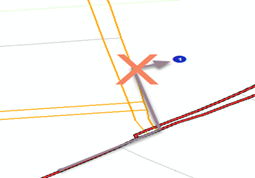
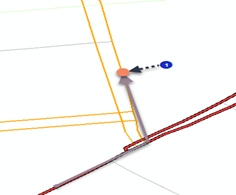
If you are using ArcScene, ArcGlobe, or ArcGIS Pro, manually place the model during an edit session using the Move, Rotate, or Scale operations.
Move, rotate, or scale a feature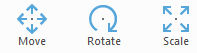 Note: There is known issue with the Import 3D files tool. The placement points parameter is not honored so as of ArcGIS 10.4.1 or ArcGIS Pro 1.3, this tool is not a viable option. This issue is planned to be fixed in a future release.
Textures
To import your 3D file with textures, you must ensure the texture resides next to the 3D file, either as an individual image file or a folder with the images.
Note: Both the file and folder must have same name for the software to recognize the texture.Trick #1Textures are only supported in file or enterprise geodatabases. Shapefile multipatches do not support textures, so make sure to import the multipatch into a geodatabase.
Z-values
Make sure your 3D data has valid z-values. When sharing a web scene or importing the data into ArcGIS Pro, you want to make sure the elevation values are correct.
Trick #1If your multipatch is not at the correct elevation, you can use this trick. In ArcGIS Pro,
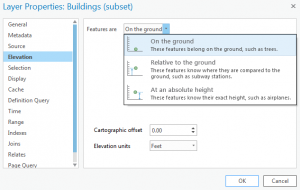
set the multipatch data "on the ground" and use the
Layer 3D To Feature Class tool. The elevation values are then embedded into the multipatch.
Trick #2If you are using simple feature data (non-multipatch), use the
Add Surface Information tool to add z-values to the data. Also, you can add z-values to an attribute table and with the
Add Z Information tool, you can verify the values with the tool's output. If the data does not have valid elevation values, see the next tip.
Tools to Create 3D Data
Understand which tools can create 3D data: Layer 3D To Feature Class, Interpolate Shape, or Feature To 3D By Attribute.
Understanding 3D Data
Understand your 3D data. Extruded 2D polygons are not true 3D features, so you must export to multipatch to make the polygon a true 3D feature. Simple point, line, and polygon features can be considered 3D data if they have the correct z-values. 2D features can also be symbolized using 3D marker symbology.
Know the difference between a z-enabled feature class and a non-z-enabled feature class with a z field in the attribute table. Feature classes must be z-enabled to display at the correct elevation. You might see a z field in the attribute table, but that does not mean the geometry has the correct z-values. This can be verified by
editing the vertices or adding z-values to an attribute table, as described above.
While this blog does not cover every facet of working with 3D data, it is my hope that this will provide some valuable information for working with 3D data on the ArcGIS Platform.
Andrew J. – Desktop Support Analyst
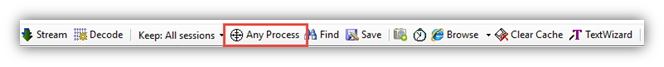
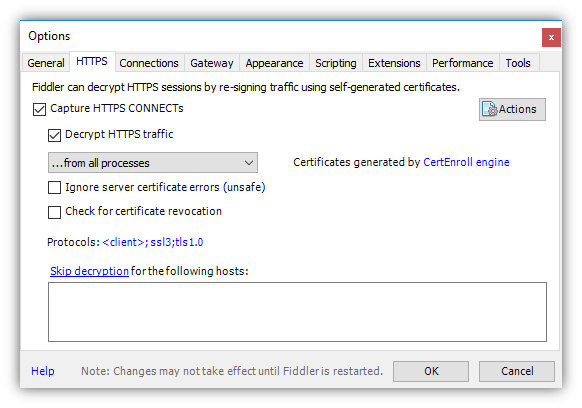 occur is to enable it to capture traffic over HTTPS.
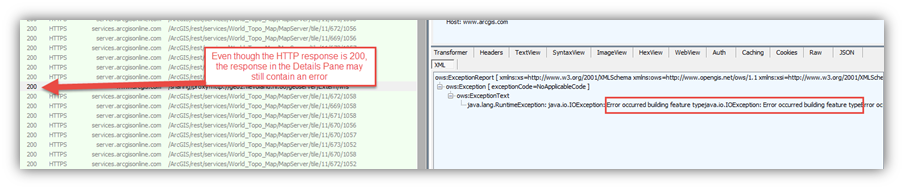
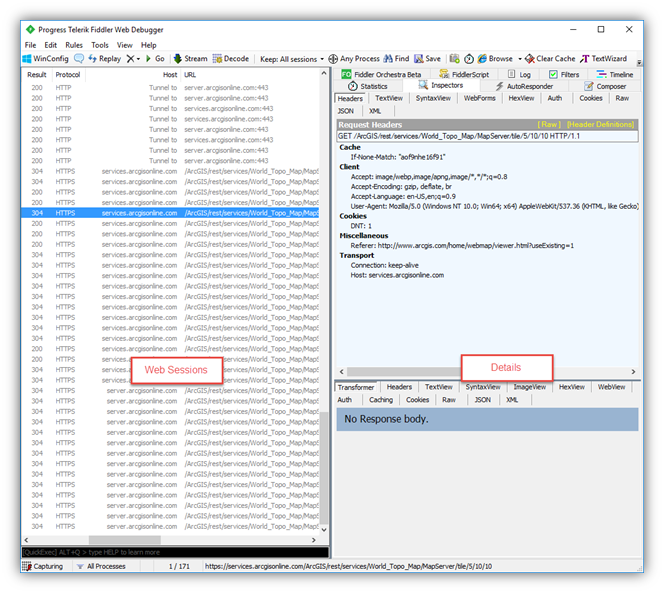 s list and the…other pane (I couldn’t find an official name so for the purposes of this blog we’ll refer to it as the Details pane).


