In a previous blog, we introduced you to Esri Redistricting. Today, let’s talk about some of the key features of this product.
Esri Redistricting provides an interactive Web‐based application that focuses on creating and maintaining redistricting plans. This app, based on ArcGIS Enterprise and ArcGIS API for Flex, provides a rich Internet application (RIA) user experience. Planners and decision makers get a common operating picture and the sophisticated geospatial analysis tools necessary to perform work related to the complex issue of redistricting.
With Esri Redistricting these are just some of the functions you can perform:
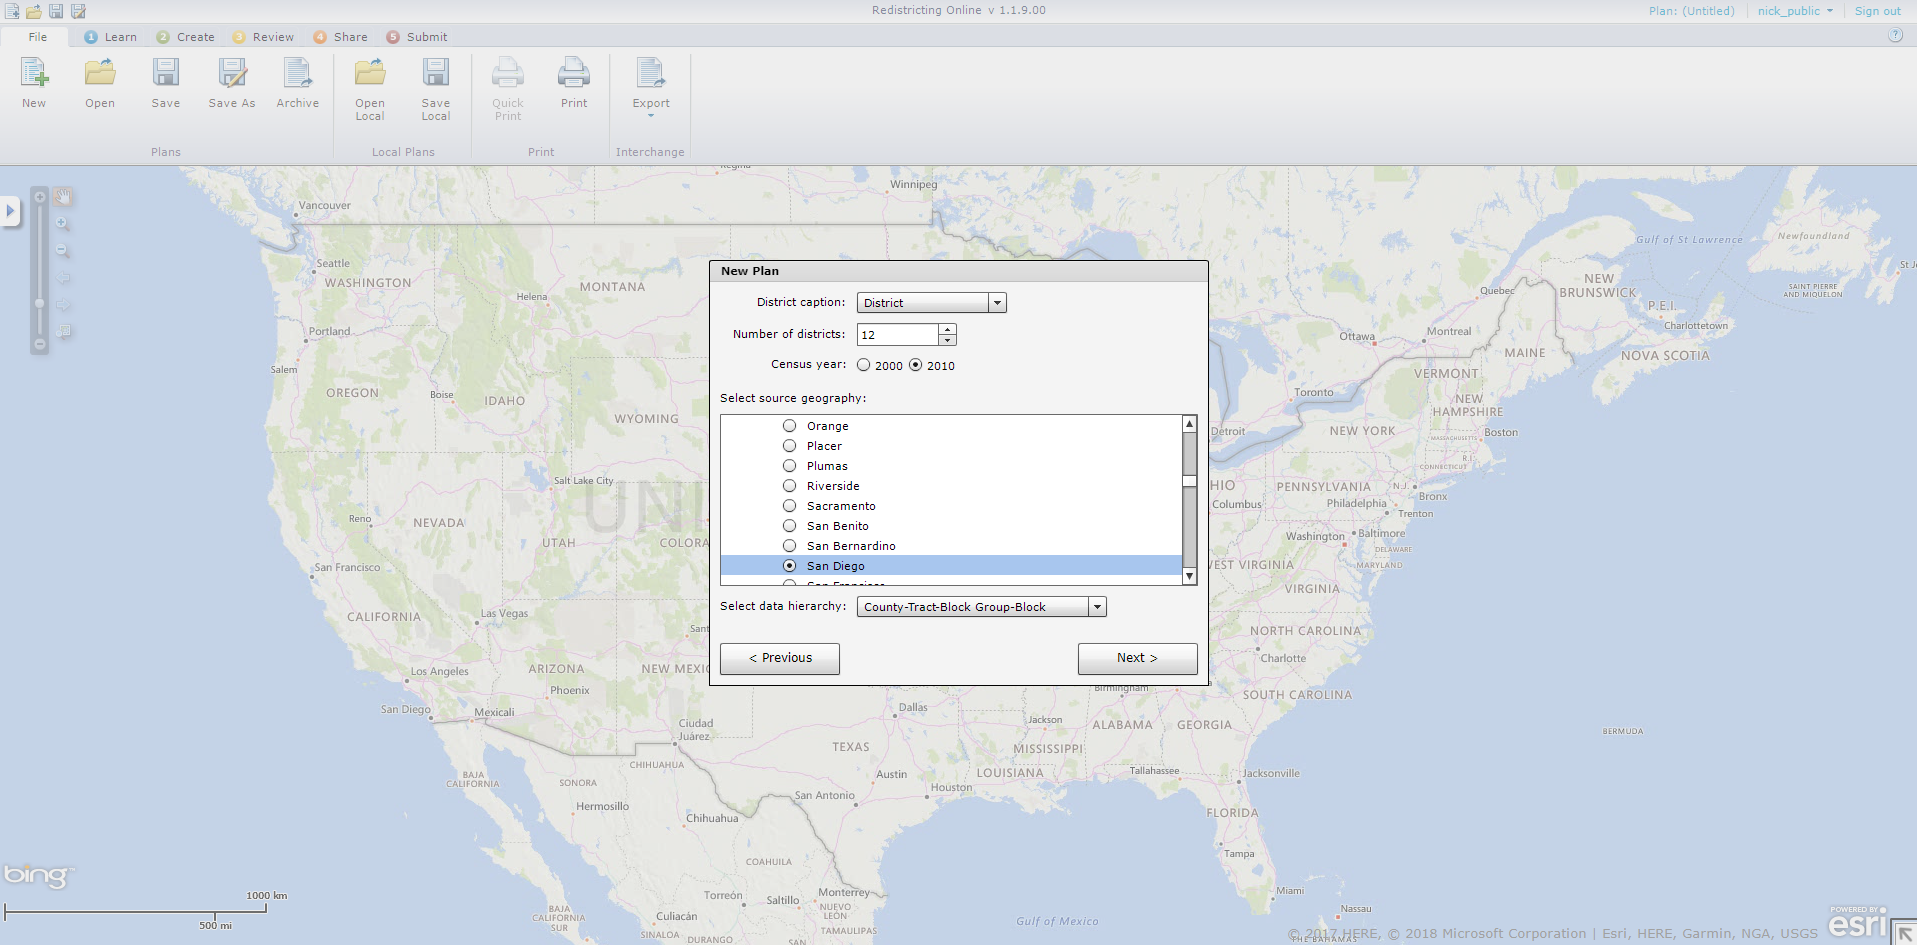
Plan Creation and Editing
Esri Redistricting is an Internet Web solution with a straightforward map-centric interface that provides easy‐to‐use tools and simple step-by-step workflow for creating, editing, viewing and sharing redistricting plans. It is geared toward ushering expert and non-expert users through the redistricting process.
You can:
- Delineate district boundaries using census geographies (blocks, block groups, tracts, counties or blocks, VTDs, counties)
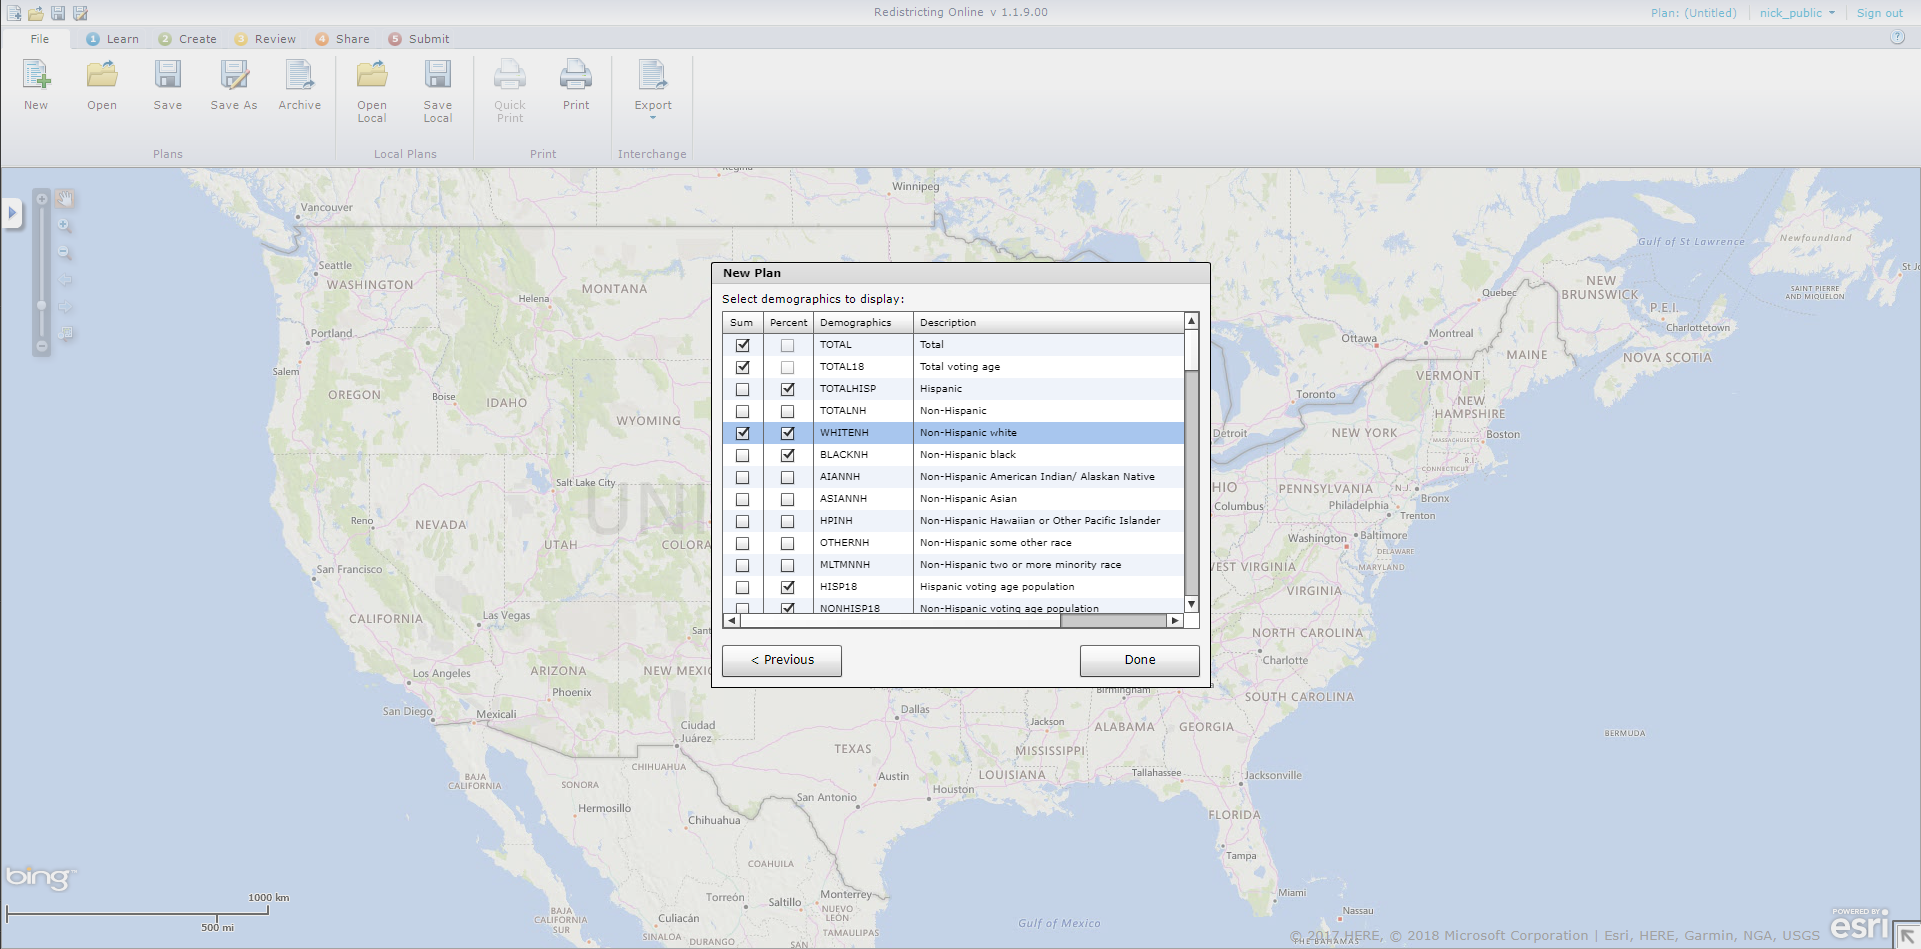
- Monitor demographics of critical geography selections and visualize their impact to a district profile
- Direct or two‐step district assignment of user‐selected geographies
- Lock or unlock district assignments to a selected geography
- Undo / redo district assignment history to a plan’s last save point
- Prevent geographies from being assigned to more than one district, as well as identifying areas that have yet to be assigned to a district
- Supports contiguous and non‐contiguous district definitions
Census and Custom Geography Data
The Redistricting application is complete with preprocessed census data—2000, 2010 TIGER, Public Law (P.L.) 94‐171, and 2020 census data (when available). Esri offers an optional data service package to support clients with integration of custom data sets supplied by the client. The add‐on data is integrated into Esri Redistricting data store before the solution is brought online for your organization. The following is supported:
- Pre‐deployment, customer‐provided data in ArcGIS‐supported formats (TIGER/Line shapefile, shapefile, file geodatabase)
- Census TIGER data (geography files) for 2000, 2010 and 2020 (when available)
- Census geography definitions (blocks, block groups, tracts, counties or blocks, VTDs, counties)
- Census P.L. 94‐171 population attribute data (race, ethnicity, etc.) related to census geographies
Map Navigation
The following map viewer navigation features are supported by Esri Redistricting:
- Zoom in / zoom out by bounding box
- Zoom in / zoom out by scale slider
- Zoom in / zoom out by mouse wheel
- Zoom to address
- Zoom to selection
- Zoom to ZIP Code
- Zoom to place name
- Zoom to latitude / longitude
- Zoom to district by name
- Zoom to unassigned geographies
- Zoom to selected geographies
- Overview map navigation
Mashups
Esri Redistricting supports the following map viewer mashup capabilities and augments the online redistricting plan map with easy–to‐use overlays of auxiliary data:
- Add maps from ArcGIS Online (street maps, satellite imagery, terrain, topographic, etc.)
- Add map resources hosted by your organization or other organizations through ArcGIS Enterprise
- Plot uploaded addresses (such as incumbents’ residences) or coordinate‐based data (CSV, Excel, shapefile)
Redlining
Esri Redistricting supports the following redlining or mark‐up capabilities to redistricting maps:
- Add user‐defined notes
- Add user‐defined shapes (points, lines, polygons, circles, and arrows)
- Add graphic image files (for example GIF, JPEG, PNG)
Feature Selection
Esri Redistricting supports geographic feature selection capabilities for assignment of features to a district:
- Select by attribute (Query Builder)
- Select by point
- Select by user drawn box, polygon, line, polyline, circle
- Select by district name
- Select unassigned districts
- Select by proximity (feet, yards, miles, meters, kilometers)
- Select by spatial overlay (for example, select by another layer’s spatial geography) with an optional attribute filter
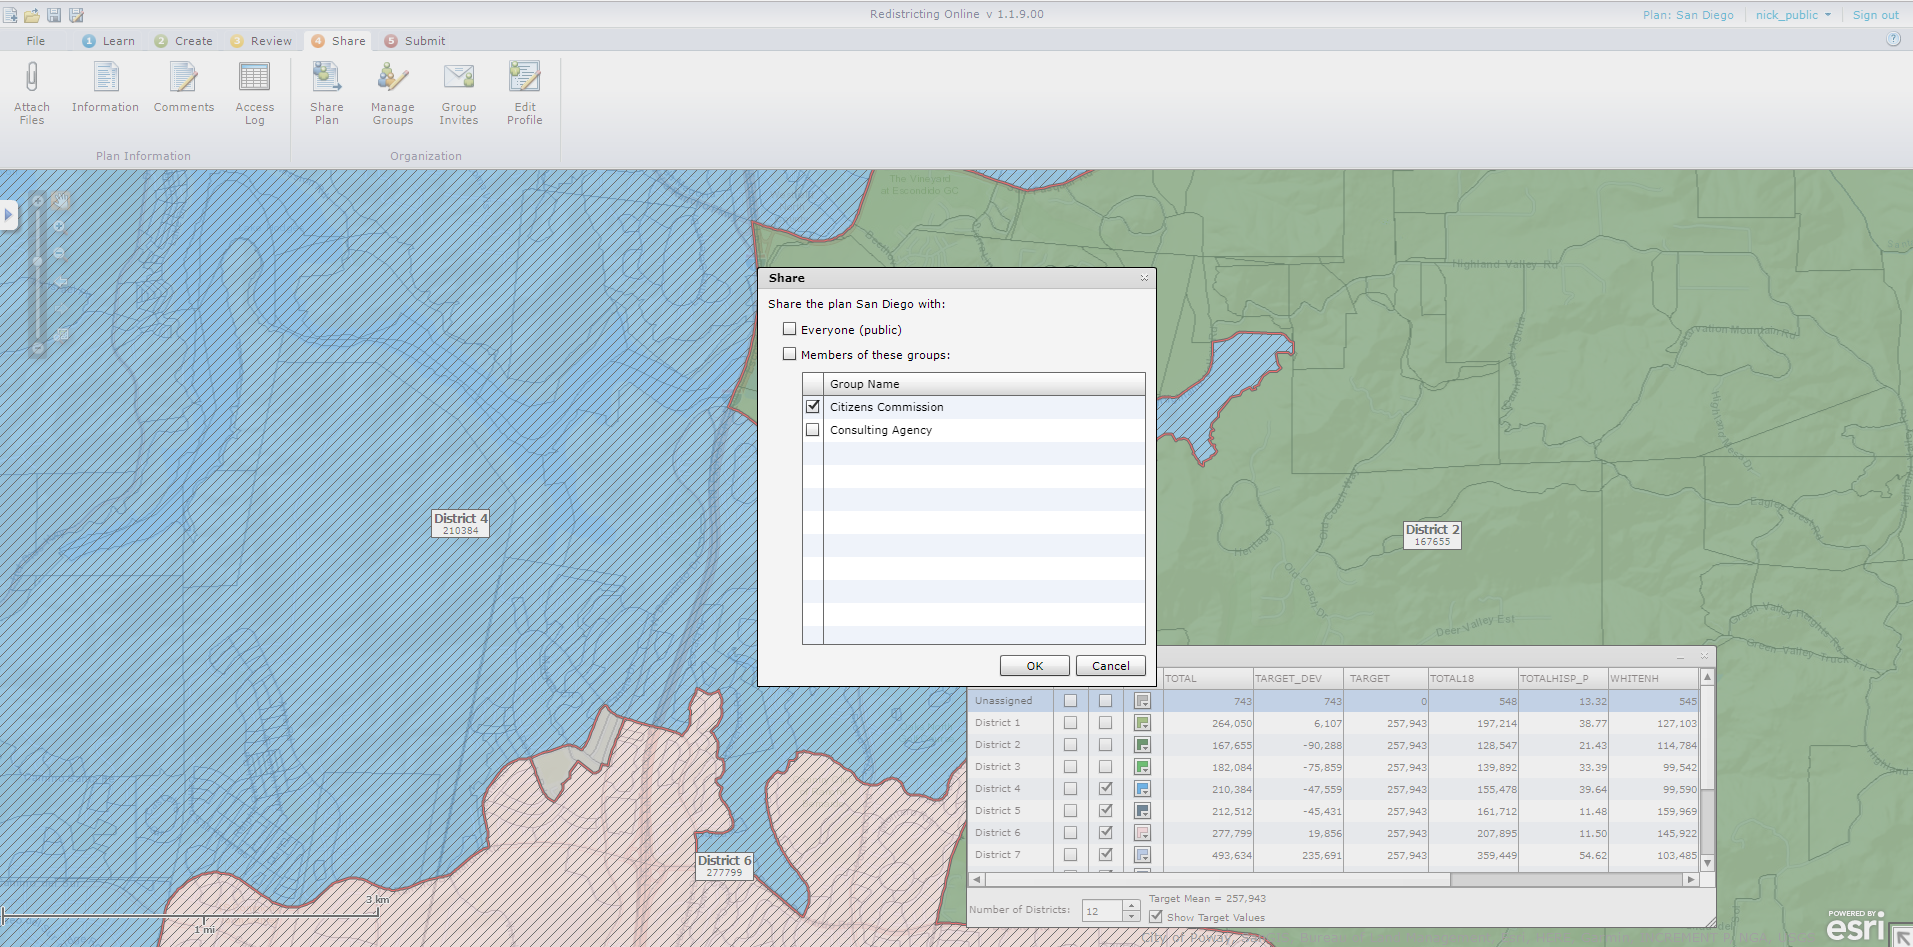
Plan Publication and Sharing
Esri Redistricting seamlessly integrates with ArcGIS Online to support accessibility restrictions for public group or private access. This solution provides access to a plan online, reducing the need for paper map production. The supported capabilities include:
- Sharing redistricting plans between users and groups. Users can be legislators, advocacy groups, and team members of the Reapportionment Office.
- Publishing plans to ArcGIS Online, with the capability to leverage all capabilities provided by ArcGIS Online on the plan, including secure access to groups.
Data Export
Esri Redistricting provides the ability to export plans to a variety of formats for sharing with other systems and applications. The following are supported:
- Export redistricting plans (PDF, text / ASCII, file geodatabase, etc.)
- Export reports (text / ASCII, CSV, Excel)
- Export plans to DOJ/OMB format (block assignments)
Printing
To support workflows that require paper and PDF reports and maps, the following printing options are supported by Esri Redistricting:
- Print tabular reports based on census geographies and census data
- Print maps to predefined templates with basic map information
- Production of multipage redistricting plan map books
- Print to all standard paper sizes: E‐size, B‐size, letter size, plotter size, 8 ½” x 11”
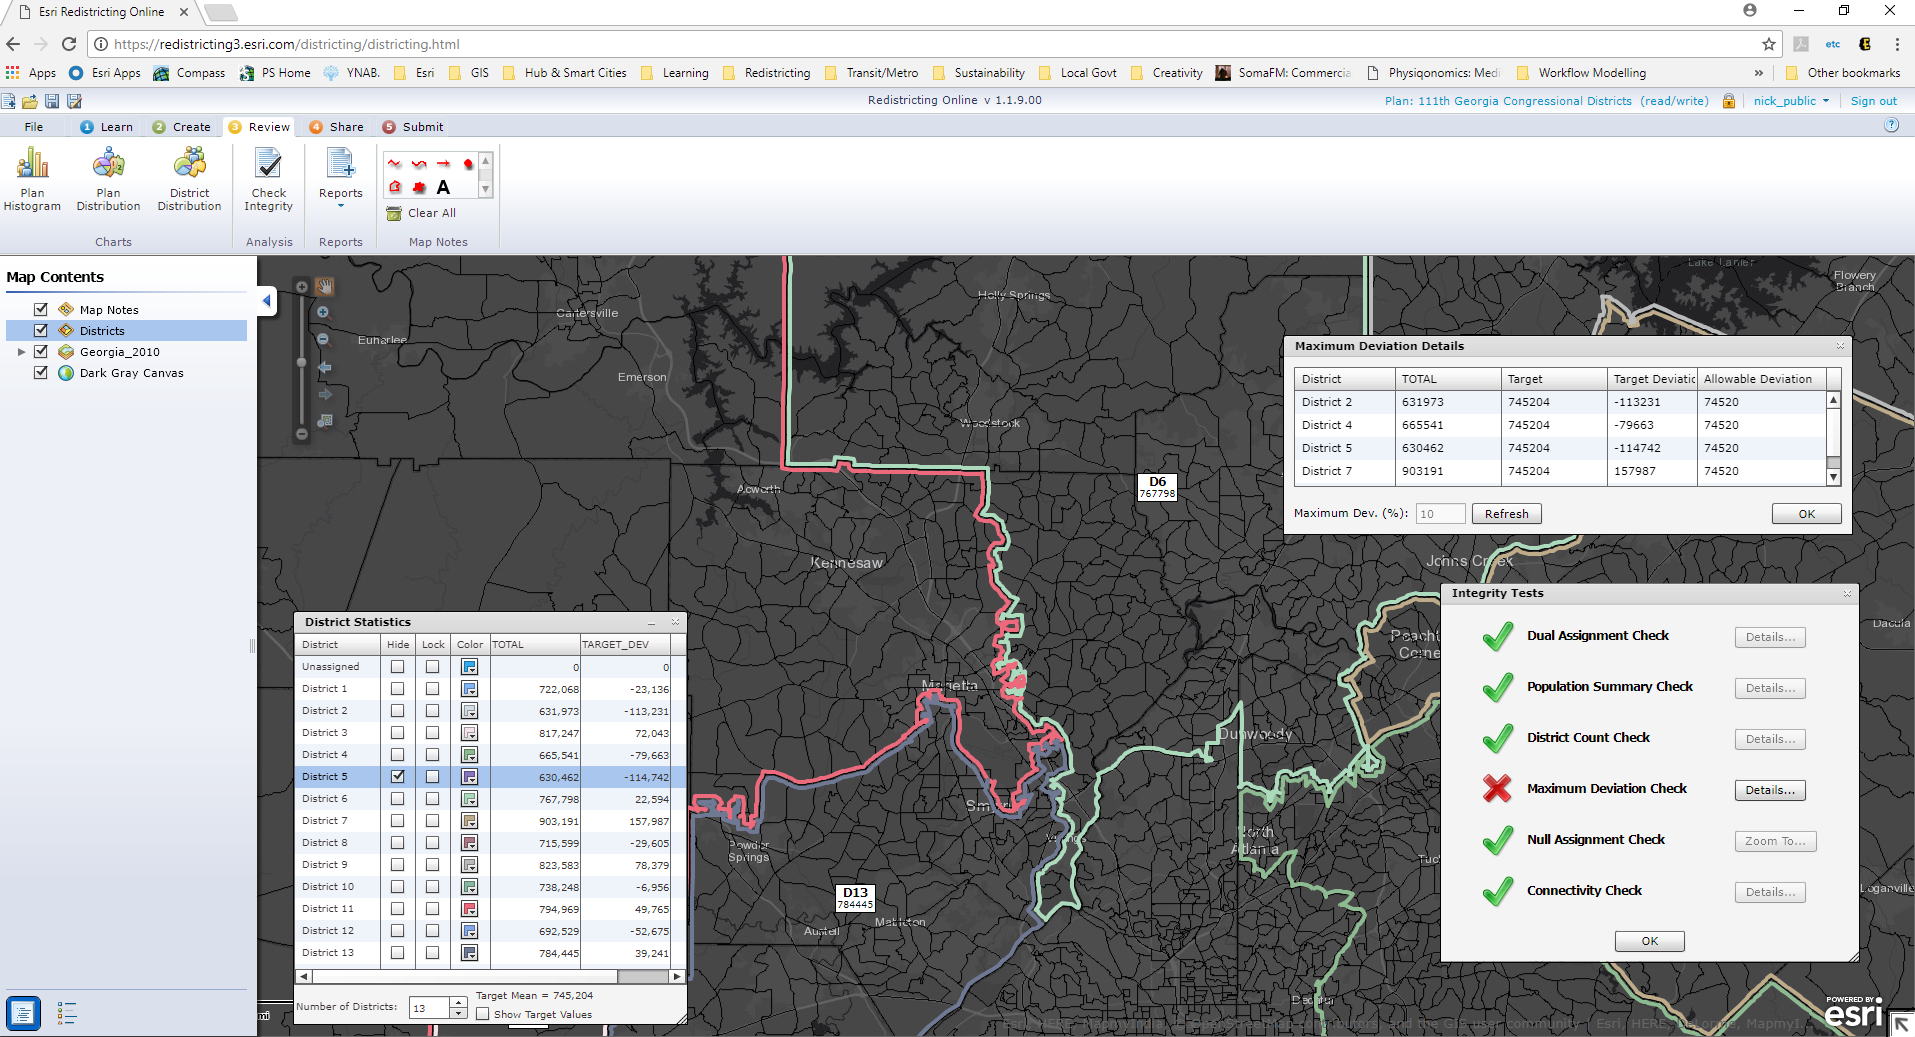
Plan Integrity
There are a number a data quality checks contained in Esri Redistricting, including:
- Checks that the total number of districts required by the plan is enforced
- Cross check to prevent a geography assignment to more than one district
- Cross checks to ensure summation of district populations matches client population totals
- Check validates districts have contiguous geographies (optional)
- Check for plan compactness
- Check for district(s) that violate allowable population deviation
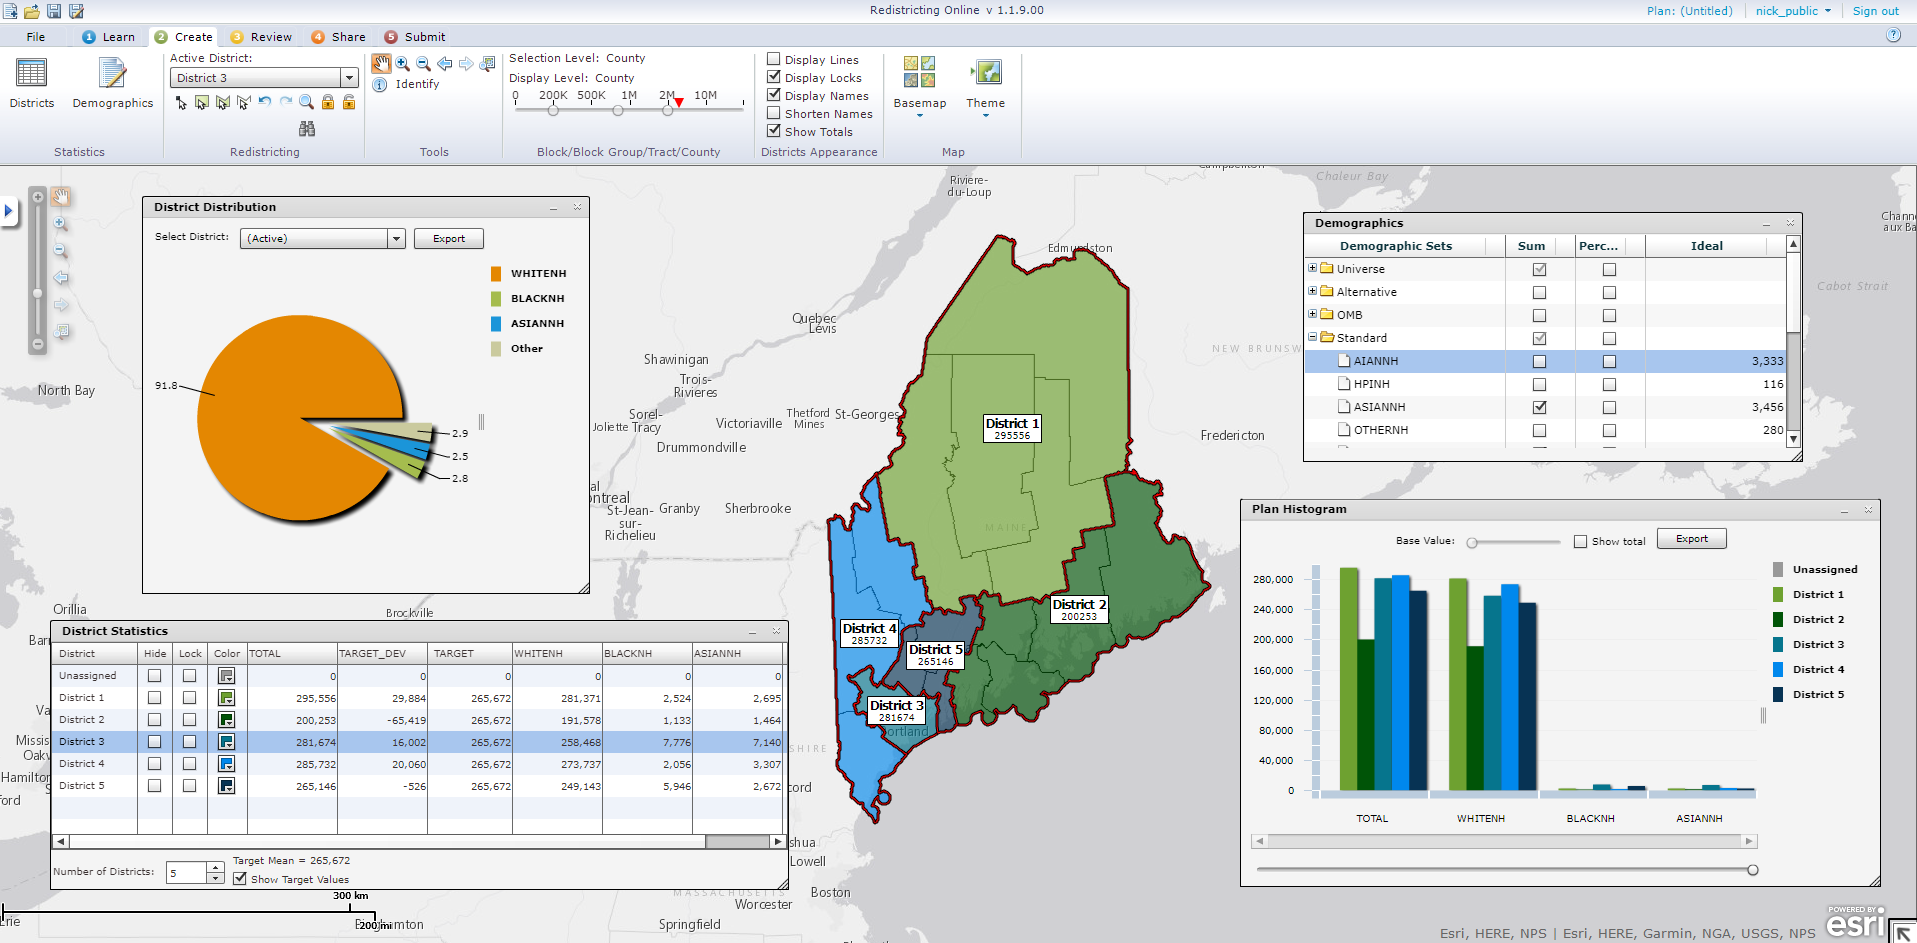
Reporting
Reporting is supported by the solution at two levels: 1) a statistics table that reflects working census demographics by district, updated upon each geography assignment to a district, and 2) ad‐hoc tabular reporting / charting against the redistricting plan. The following feature set is provided:
The following predefined report templates will be included:
- Population Summary Report
- All Summary Report
- District Geography Report
- Voting Age Population Report
- District Statistics Report
- Unassigned Geography Report
- Plan Comparison Report
You may create report templates against:
- Census P.L. 94‐171 population demographic data at the following levels: district, block, block group, tract
- Customer‐specific data integrated via the data add‐on pack (for example, historical voting data)
Reporting functionality will support the following capabilities:
- Save report templates and use them across redistricting plans
- Create formula fields to report against
- Generate charts and graphs in reports
- Embed graphics into a report
- Export statistics table and reports (CSV, PDF, Excel)
- Display demographic changes between districts caused by geography assignment(s)
- Display ideal versus actual district population
- Share reports with other users and groups
Plan Management
Esri Redistricting has a redistricting plan explorer that provides the following features:
- Centralized plan management
- Save a copy of a plan (“Save As”) or save a copy of portions of a plan (select plan features)
- Lock plans as “Read‐only”
- Maintain a log of access and modifications to a plan (for example, created, opened, or saved)
- Maintain plan metadata
- Ability to merge plans for consolidated redistricting plan assignments
- Overlay plan comparison / visualization
- “Folder‐like” redistricting plan explorer to manage and categorize plans by keyword
Plan Management Administration and Access Control
Esri Redistricting supports the creation, storage, and retrieval of redistricting plans from the Redistricting Database. As such, this module also regulates plan access and user/group management and supports user entities with the following rights:
You can:
- Create groups
- Invite other users of the system to join groups they create
- Delete groups they created
- Modify membership to groups they created
- Share plans with their groups (with read or read/write access)
- Accept or reject membership to groups they have been invited to
- View and modify (if shared with write access) plans shared to their group
You cannot:
- See groups they are not members of
- View or modify plans not shared to a group they belong to
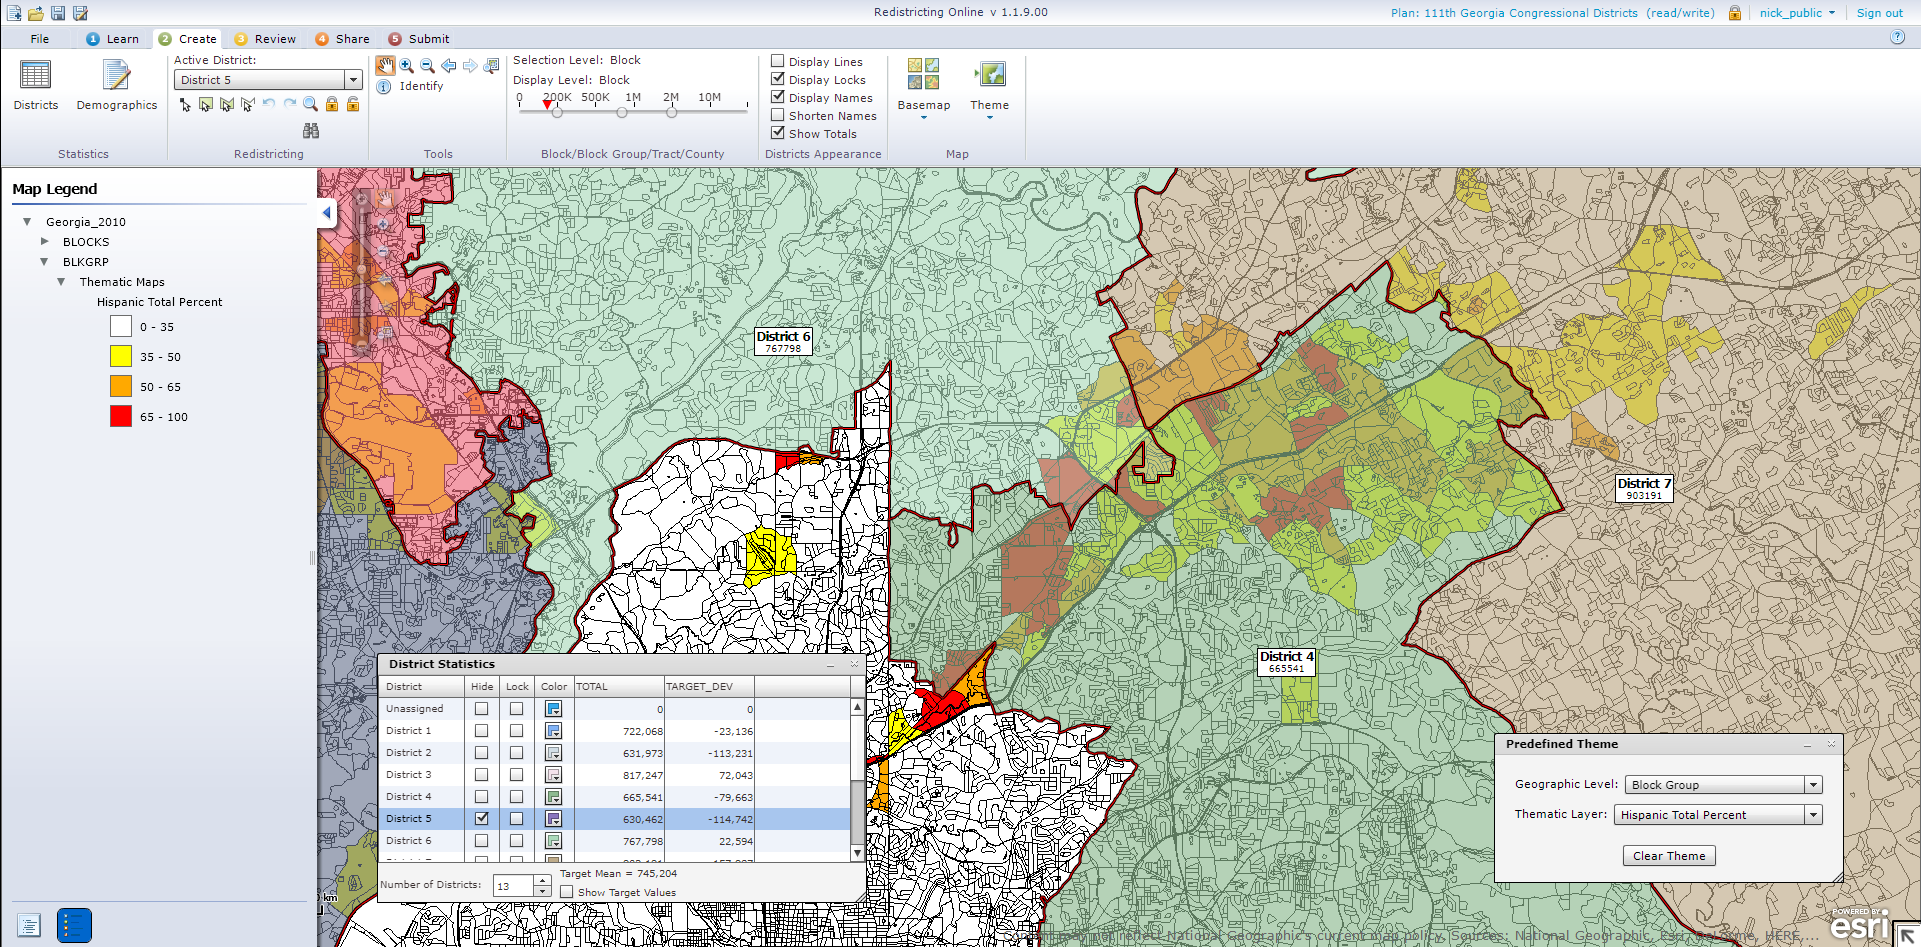
Thematic Mapping
Thematic Mapping provided by Esri Redistricting allows users to build a thematic layer by selecting a variable used to classify the geographies into different groups (for example, population density or demographic concentration). The following capabilities are supported:
- Thematic maps based on census geographies
- Selectable color ramps
- User modification of class break ranges (not SaaS model)
- User modification of polygon symbology for class breaks (including fill color, fill pattern)
- Thematic map legend
- Preconfigured thematic map templates
- Thematic map labeling