- Home
- :
- All Communities
- :
- Industries
- :
- Education
- :
- Education Blog
- :
- Using two new tools to analyze volcanic eruptions ...
Using two new tools to analyze volcanic eruptions in Kilauea and Beyond
- Subscribe to RSS Feed
- Mark as New
- Mark as Read
- Bookmark
- Subscribe
- Printer Friendly Page
- Report Inappropriate Content
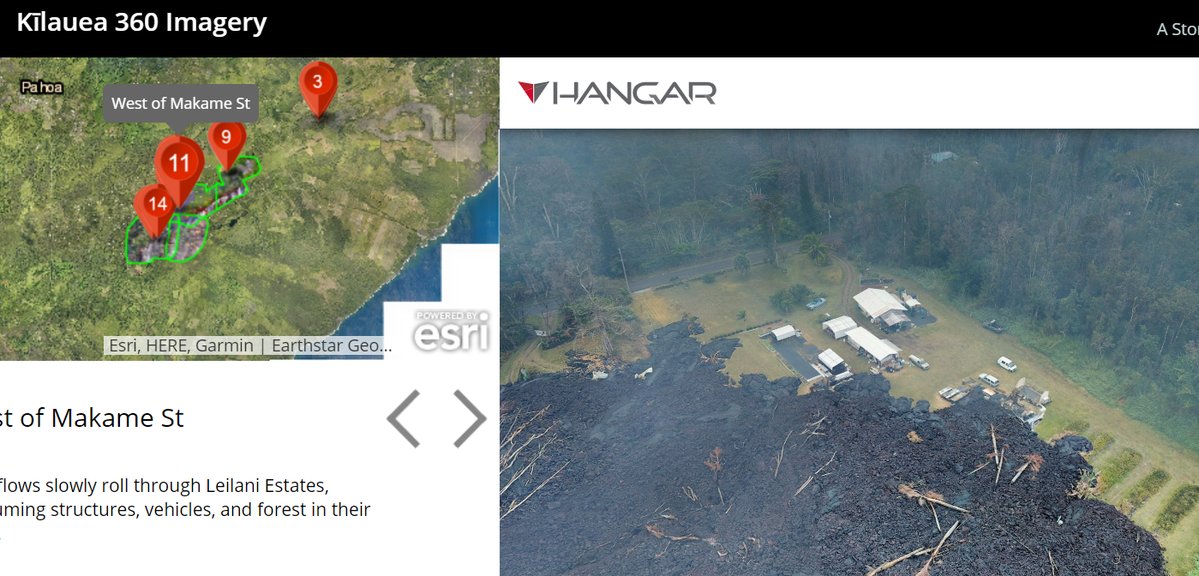
The rapid advancement of Unmanned Aerial Vehicle (UAV) data in society and in programs at universities and even in some secondary schools has led to some amazing tools and data with which to analyze the world. Esri has a new UAV partner, the good people at Hangar, which operates a very innovative service to fly areas that people request them to. Hangar recently flew across Kilauea Hawaii and have compiled their 360-degree immersive UAV imagery into a story map. This makes for an incredibly engaging and rich tool for use in instruction, about human-environment interaction, impact of natural hazards, plate tectonics, current events, and much more. As an example, see the image I posted here: https://pbs.twimg.com/media/DgI567QVMAI1bbW.jpg or below. I highly encourage you to take a look at this story map, paying particular attention to the house being engulfed in photo # 11.
But that's not all. Another recent advancement is the announcement of the new Sentinel-2 imagery in ArcGIS Online. Sentinel-2 is part of Copernicus, the world’s largest single Earth observation program directed by the European Commission in partnership with the European Space Agency. Esri makes the multi-spectral data quickly accessible using ArcGIS Image Server and publishes an image service through the ArcGIS Living Atlas of the World (Living Atlas), hosted on the Amazon Web Services Infrastructure. The service includes all Sentinel-2 imagery going back 14 months, enabling change to be easily reviewed, and is updated every 5 to 7 days. Incredible! Image analysis can be run directly on the service to create indexes displaying properties such as vegetation health or soil moisture as well as quantifying the changes over time, for better understanding of the environment.
I added the Sentinel-2 data from ArcGIS Online, zoomed to Kilauea, and rendered the image as Geology with DRA (Dynamic Range Adjustment) which makes use of the SWIR (ShortWave Infrared) bands 1.... This only took a few minutes and now I can measure the length of the new lava from that day (in yellow), and make use of the Imagery with Labels or Open Street Map basemaps to determine the homes that are affected. My students could investigate further to determine exactly which of the homes are shown in the UAV images in the above story map. The results are shown in the image below. For more information, see my video on the Hangar Esri UAV story map and my video on the Sentinel-2 data.
A video showing blue flame from methane in this exact rift zone is very compelling and makes for an excellent supplement for the above two resources that I described. The video is here: Hawaii volcano: blue flames burn in streets as methane escapes - YouTube . In addition, this web map contains multiple renderings from a DigitalGlobe WorldView-3 collect on May 19, 2018. Leveraging the Near Infrared and Short Wave Infrared wavelengths captured by WorldView-3 can not only help to define the lava flow extents but also identify hot spots. The infrared imagery also helps to peer through smoke that may otherwise occlude the ground.
Update May 2020: The Kilauea eruptions are now over 14 months old. Because the image service at present only contains data for the past 14 months, you will need to query on a more recent image where an eruption has occurred somewhere in the world. These could include the following eruptions:
- 3 Nov 2019 Kikai, Japan
- 30 Sep 2019 Shishaldin, Alaska
- 13 Jan 2020 Fernandina, Galapagos
- 14 Jan 2020 Reventador, Ecuador
- 28 April 2020 Krakatau, Indonesia
- 28 April 2020 Rincon de la Vieja, Costa Rica
For more eruptions, examine the Smithsonian Institution's Volcanism Bulletin. Note further that the Sentinel team at Esri is seeking to add all of the archive to the service, not just the past 14 months, so stay tuned on this point.
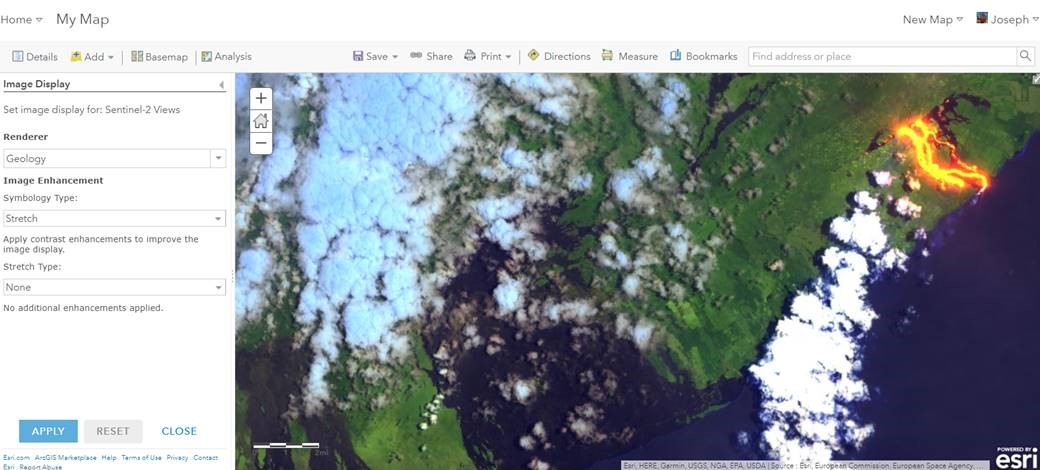
Sentinel-2 imagery rendered as Geology with DRA and filtered for 23 May 2018 in ArcGIS Online.
You must be a registered user to add a comment. If you've already registered, sign in. Otherwise, register and sign in.
-
Administration
38 -
Announcements
44 -
Career & Tech Ed
1 -
Curriculum-Learning Resources
178 -
Education Facilities
24 -
Events
47 -
GeoInquiries
1 -
Higher Education
518 -
Informal Education
265 -
Licensing Best Practices
46 -
National Geographic MapMaker
10 -
Pedagogy and Education Theory
187 -
Schools (K - 12)
282 -
Schools (K-12)
184 -
Spatial data
24 -
STEM
3 -
Students - Higher Education
231 -
Students - K-12 Schools
85 -
Success Stories
22 -
TeacherDesk
1 -
Tech Tips
83
- « Previous
- Next »