- Home
- :
- All Communities
- :
- Industries
- :
- Education
- :
- Education Blog
- :
- Touch the Future: Integrating Augmented Reality w...
Touch the Future: Integrating Augmented Reality with Field Work, GIS, and Argis Solutions
- Subscribe to RSS Feed
- Mark as New
- Mark as Read
- Bookmark
- Subscribe
- Printer Friendly Page
- Report Inappropriate Content
One of my favorite sets of GIS videos has long been the Geospatial Revolution set from Penn State for clearly explaining what geotechnologies are and why they matter. One of the forward looking segments in those videos was a demonstration of someone walking around their community, pointing their phone at cafes and other parts of the built environment, obtaining attributes in real time about those features. I always looked forward to the day when I and other educators could actually do this in an instructional setting. Now, 11 years after these first videos were produced, that day has arrived!
One innovator in the augmented reality space is Argis Solutions. Argis Solutions is a GIS consulting company, offering help to project managers from the medical, city, county and federal sectors, bringing products and services to market by harnessing the power of cutting-edge technologies like computer vision, 3D rendering and image recognition, and applying it to geospatial data analysis. Argis Solutions is a Esri partner network silver member. One of the things that the Argis staff created that I am most excited about is their augmented reality solution, Argis Lens. Similar to other partner solutions I have written about in the past, such as conducting fieldwork with Mapillary, I am excited about the education potential for Argis. I believe that students and instructors at the secondary and university level could make meaningful and extensive use of the Argis Lens. This essay and guidelines explains why I am excited about this and how you can use it in your own educational setting. I also provide it in the following videos:
1. How to set up Augmented Reality for Education in GIS and mapping.
2. How to find Spatial Data to use with Augmented Reality with GIS and mapping.
3. How to use Augmented Reality in mapping and GIS with Existing Features.
4. How to use Augmented Reality in Mapping and GIS with Features Collected by You or Your Students.
Since all of us in geospatial technology love visuals, the best way to help you understand what the Argis Lens does is to compare these two pictures that I captured below on a school campus. What are the differences between the left and the right picture?
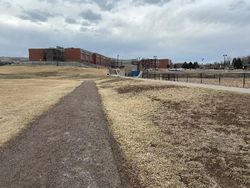
The picture at right gives me the attributes of the features that I see on the ground on the school campus!
How is this possible? Consider the following: We are all familiar with examining data on maps using GIS tools, such as this accident data over a span of a few decades, shown below in ArcGIS Online:
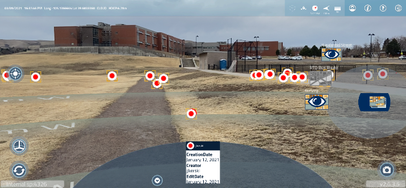
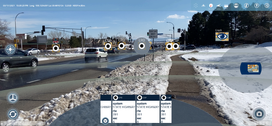
But what if you could be on the ground, inside your study area on the above map, and just with an ordinary smartphone, examine that same data, seeing exactly where that data or phenomenon occurred? Below is a screen shot from the Argis Lens app on my phone, after I walked to the intersection that I was examining above. Here I am examining the accident data, at the locations where the accidents occurred! Each point shown in the image represents an accident, and inside the boxes at the bottom of the image are the attributes.
The uses of Argis in government, industry, academia, and nonprofits for Argis are many; one of the chief uses is for organizations to “see” what is underground in a specific area—water, electric, and gas lines; utility and fiber optic cables, and much more. See this video from Argis Solutions for a demonstration. The field app, the Argis Lens, overcomes the barriers of two-dimensional mapping technology, bringing GIS data into the three-dimensional world in which field crews work, giving them superior knowledge of what is underground before they dig. Imagine the safety enhancements, plus savings in time, energy, and costs that could result by using this smart solution! In fact, the CGA 2019 DIRT Report revealed that $30 billion in utility damages were incurred just in that single year, from people digging in the wrong area and not understanding what lies underground, with an estimated 532,000 damage-causing incidences occurring that year in the USA alone.
In an educational setting, examining the living and built environment in an augmented reality setting is a powerful way of understanding the way the world works, what is mapped, why and how it is mapped, and why it all matters. How can you take advantage of these exciting capabilities?
Setting It Up
First, as explained in more detail on the Argis Solutions site, you need three things to activate the Argis Lens: (1) Access to an ArcGIS Online organizational subscription. If you are at a university or a school, you should already have access to ArcGIS Online; if not, let my Esri education teammates or myself know. (2) An Argis Client login on the Argis administration Console. (3) A subscription to ArGIS. For (2) and (3), contact the good folks at Argis Solutions.
Then, what you need to do is:
(1) Choose a study area in which to work. It could be your local wetland, an urban greenway or trail, a stretch of riverbank or shoreline, a historic district in your community, a public park, your own school or college campus, or somewhere else.
(2) Find GIS data to be viewed with augmented reality (AR) as a feature service. Since you will be in the field examining this data, you will need to go to your local city, county, or other organization who might be hosting data in the public domain that covers the area in which you will be working. Since you will likely be accessing your study area on foot, choose layers that have a fairly high density of coverage in that study area. Otherwise, you will be walking hundreds of meters or more between each feature, which will add to the time required to examine the data and to teach the concepts that you wish to teach.
How can you find these data layers? Fortunately, we are firmly in the era of data-as-services, which are becoming more and more common as communities realize the value of open data that allow people to make wise decisions. See my detailed guidance below these steps.
Fun and important note: You can also collect your own data and examine it as well! More about that later in this essay.
(3) Log in to the Argis Console to create a list of servers that are housing the data that you choose to examine. Enter the REST Endpoint URL into the Argis Console to securely access this data. My servers are mostly from my own city government and my county government’s open data portals. Yours will cover different areas of interest but the idea is the same—find data providers that host data covering your study area. I recommend focusing on point data, such as light poles and storm drains, but include at least one line layer (such as streets), and at least one polygon (such as ponds, or parcels).
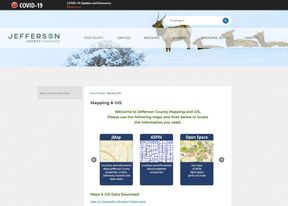
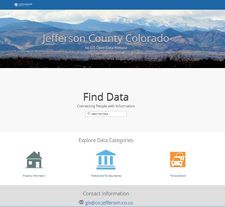
To find the REST endpoint requires a bit of digging: You typically need to go beyond the data portal’s front page to the list of data layers. For example, Jefferson County Colorado’s front GIS data pages look like this:
But if you dig deeper, you will find metadata pages like the ones shown below where you can obtain the REST endpoint address of the layers. Your goal is here is that you don’t want PDFs, or online mapping applications, but rather, the feature service addresses themselves. This is what can be mapped in ArcGIS Online, ArcGIS Pro, other GIS software, as well as the Argis Lens. Shown below is just a fraction of the layers available from my own local city and county government agencies (thank you, folks!). These include trails, parcels, fire districts, light poles, storm drains, traffic accidents, and much more. Choose carefully, keeping in mind issues of bandwidth and pulling up these layers on a phone in the field. More is not always better! The URLs for the layers that you are seeking can be obtained from these pages.
For example, here is the layer for one of the layers I am interested in examining, the motor vehicle accidents layer (named, appropriately, “crash”). The metadata for the layers will help you choose which layers that might meet your needs.
The REST endpoint of my own data layers came from my own ArcGIS Online organization’s server. I entered this REST endpoint in the Argis Console through the Add Server function as follows:
When done, make sure you can view the list of your servers in the Argis Console, as I show below:

A view of one of my data scenes is shown below. You know you are on the right track if you can zoom to your study area and see features there, such as my assortment of signs, traffic lights, and storm sewers.
You can set up more than one data scene. In my case, I created several data scenes, one for a few things in the built environment, such as light poles, signs, and storm drains, one for the accident data, and one combining my own data with data that local governments had created. Some are shown below.
(5) Before you go into the field, test to make sure your data layers will be visible once you are there. To do so, adjust your “current” coordinates by clicking on the Location button on the app’s left side and entering the longitude/latitude of a point inside your study area. One easy way to determine a suitable latitude-longitude point is to open up ArcGIS Online (www.arcgis.com), panning and zooming to your study area, and using the position location tool under the measurement functions and taking note of that latitude and longitude. Enter these values as shown below.
(6) Now you are ready to go into the field! Once there, you will pull up the Argis Lens app and view your desired data scenes. More extensive help exists on the Argis website, but in brief: On the Argis Lens app’s interface, you will see the layers that you have loaded in your scene at the right, with the layers currently visible with the “eye” symbol, as shown below. As you walk the landscape, you will see the points, lines, and polygons appear as you approach them. In the image below, you see one polygon and a set of points as red dots. You can set the tolerance of when they appear, such as “show when I am closer than 75 meters from the object.”
While in the field, ask your students about the patterns that they notice about the features you are analyzing, why and how such features are maintained in the field, and by whom (say, the light poles vs the storm drains), and the advantage to your government agency or other data provider to map and maintain all of these features in the first place. Include some of the teachable moments that I describe below, such as about spatial accuracy and attribute completeness.
On the app, you can select by clicking on any of the features, and their attributes will appear. Below, for example, I see point data for accidents (on left), and I can click on each of them to obtain their attributes (right).
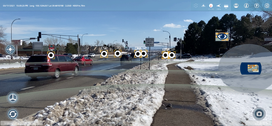
I recommend that you examine some point, some line, and some polygon features to foster geospatial literacy and to keep things interesting! In the scene below, the traffic signals are points, and the streets are the thick blue lines.
Selecting the light pole reveals the attribute table, part of which is shown below, including the owner (Xcel Energy), watts, type of light fixture, and more.
How can I find local data for my study area?
Thanks to the open data movement and the advancement of data sharing formats and standards, a growing number of portals and servers exist containing spatial data. These layers are often easily ingested into ArcGIS Online and hence, the Argis Lens. Where can you find these data portals? Start with my guidelines, Modern Strategies for Finding Geospatial Data. In short, the Living Atlas of the World is an excellent starting point (https://livingatlas.arcgis.com), Many of these portals use ArcGIS Hub technology, and searching these hubs is another fruitful method. Another method is to search on <your city or county or your community or region’s name> plus the phrase “open GIS data” or “open data portal” or “GIS Department”. Our Spatial Reserves data blog also provides essays that can be used for discussing related societal issues such as location privacy, spatial accuracy, and the pros and cons of charging a fee for data. An increasing number of these data portals allow you to visually inspect the data on web maps to help you decide whether or not you want to use the map or map layer. For example, while I liked the idea of using the floodplains layer in my own county (below), I could not use it in my study because it did not overlap with my study area. But it would be useful for other areas in my region.
My county has a ArcGIS Hub here and my city also hosts GIS REST services. Did they have everything I wanted? No; I wanted a tree layer, for example. But there was enough data here for me to use. One useful layer is the traffic signals, especially relevant to route and slow traffic around schools and university campuses:
Students may not be initially excited about storm sewers, manholes, and drains, but choosing this type of layer may be fruitful because (1) they are relevant to mitigate floods, and therefore relevant to discuss, and (2) they are of sufficient density to be fairly numerous for wherever your study site happens to be (see below).
Examining traffic accidents is not only interesting to students, but can connect well with drivers’ education programs in secondary schools along with alcohol awareness and prevention efforts, and at the university level, connects well with community safety and criminal justice programs. I can ask students: How many accidents are in the database? Does this number surprise you? My county alone had 55,839 in the database, spanning only a 5 year period; therefore, over 30 accidents occur on average, daily. What is the pattern of these accidents over space, time of day, day of the week? My study area contained several accidents near the school campus and especially down the street along the north-south state highway (below).
You can also, through many of these portals, see the attributes available for each layer. In the case of the accidents data, plenty of attributes exist, including the weather at the time of the accident, time of day, day of the week, how many vehicles and injuries were involved, whether anyone was impaired, age and gender of those involved, and much more, as shown below. Investigating and understanding these data layers is an important step in the decision-making process.
How can you tap into these tools?
Argis Solutions offers an education bundle for colleges and universities that includes the Argis Lens for use within GIS departments and facility management, as well as admissions tours. Contact a representative (scroll to the bottom of this page) to create a tailored-made solution to meet your campus needs. I have gotten to know the Argis staff over this past year and they are incredibly knowledgeable and passionate about education.
Adding and Analyzing your Own Field Collected Data
Let’s say you used the above workflow and viewed some data collected by local governments and other organizations in the field. These organizations serve their data openly; therefore, you can view it in the field with the Argis Lens app. But now let’s say you want to dig a little deeper by collecting and examining your own data. Not only can this be done, but it can be done easily, thanks to the existence of data-as-services. Data you collect with the ArcGIS platform is stored in the same type of format as that served by your local government or other agency. In this way, GIS is becoming the “common language of the planet”.
Collecting and examining your own data adds additional skills, teachable moments, and another immersion into the world of geotechnologies. You can also combine your own data with data from your local government and other organizations for the best of both worlds.
The easiest and most straightforward way to add your own data is with Survey123. Survey123 is a field data collection tool from my organization (Esri) that allows you to quickly set up, gather data into, and map and analyze the results (hence the “123” part of the name). In my example, I set up a Survey123 to collect point features on a campus, such as trees, recycling bins and trash cans, parking bumpers, fences, and other objects. These are easily observed and collected on any campus. Decide what attributes about your points you would like to collect. In my surveys, I find it instructive to include one attribute that is a number (such as a height, a temperature, a circumference or something else), one attribute that can be ranked on a Likert scale (such as condition ranging from very poor to excellent), along with some nominal data such as type of feature.
My survey, located here (https://arcg.is/0eHOLe), contains 5 questions. Once a person answers the “living/non-living” question, the survey expands to ask “what type of living” or “what type of nonliving” object is it? … with a small list of choices to pick from (tree, shrub, flower, for living) (light pole, sign, fence, electrical box, parking object, for nonliving), with the last option under each, for “other”.
Once my survey was constructed, tested, and shared, I wrote down the URL for the survey. I then went into the field with the Survey123 app on my phone and collected my desired features, answering the survey questions so that the attributes would be attached to each feature. I took a photograph of each feature, and while I was filling out the survey, my ground position was being recorded and mapped. The resulting feature layer is named Campus Living and NonLiving Infrastructure. Next, I set up a map in ArcGIS Online so I could see my point features. The resulting layers, survey, and map in my ArcGIS Online organization are shown below. Of course, a better workflow instead of you, the instructor, collecting data into the survey, would be to have your students do this!
Below is a map of my collected points on the campus. I got a little excited and collected over 250 points, but you’ll be fine as long as you collect more than just a few points. :- ) Each of my points contains 6 attributes: Living or nonliving, type of object, condition (from very poor to excellent), the height (in meters) of the object, position (collected automatically), and photograph. I recommend starting with points, and as you become more familiar with these tools, include lines (such as sidewalks, powerlines, and the running track at the fieldhouse or stadium), and polygons (such as buildings, parking lots, football field, and so on).
If smartphones for students are not available or if there are challenges to getting into the field to collect your own data, another way to add data is to do it in ArcGIS Online in your own classroom or in virtual classrooms (i.e. the students can do this in their homes). To do this: Go to ArcGIS Online > Add Item > Add a feature service, say, a point layer of trees > Open that layer in ArcGIS Online Map Viewer > Zoom to your desired study area > using a satellite image base, add trees wherever you see one on the satellite image. Be sure to save your map and layer when you are done adding features and share it.
Alternatively or in addition, do the same thing for light poles, crosswalks, or anything else you want to collect. Each feature can be in its own feature layer, or you can combine features into one layer. In my case, to keep it simple, I created one layer called “campus living and nonliving infrastructure 2021”. This layer contains, as the name implies, trees and shrubs, but also litter, fences, curbs, benches, objects on the football and baseball fields, bike racks, signs, drains, cable boxes, and much more.
Now, with my own data collected, I added it to the layers from the local government agencies, again, for the best of both worlds. Now in my Argis Lens app I can see my own points, and the points mapped by others. It is extremely gratifying for students to see data that they actually collected themselves, as real scientists.
Why These Tools Are Useful in Education
I believe these tools are incredibly useful in education from the middle school level, through high school, and on to higher education, in geography, environmental science, mathematics, engineering, and GIS courses. The first reason why is that these tools connect well and seamlessly with the ArcGIS platform from Esri. Using the tools helps solidify what I want students to know about in GIS data—servers, feature services, maps, layers, and their attributes, and in GIS access—sharing, groups, and so on. More broadly, students learn about types of spatial data—point, line, and polygon—and how it is stored, symbolized, and represented.
The second reason that I believe these tools are useful in education is that they allow students to “touch the future.” Using these Argis tools touch on many of the key trends impacting geotechnologies, including data-as-services, IoT feeds with real-time data, artificial intelligence machine learning, 3D analytics, and augmented reality. Students can do more than just read about these technologies, they can actually engage with these technologies as real scientists with the Argis tools. The tools illustrate the value of 3D and an immersive experience, with data fed from a variety of organizations that are all kept up-to-date.
Perhaps most importantly, with Argis Solutions, students interact with augmented reality (AR). AR will only grow in importance over the coming years: Soon, seeing attributes with smartphone cameras will be commonplace, from ratings of and hours for stores and cafes, to weather happening right now or forecasted tomorrow, to the type of animal or plant species that one observes. In fact, two years ago I began using the PictureThis AI app to identify plant species from my phone: It is amazingly accurate and as its name implies, uses Artificial Intelligence as its engine and becomes more accurate over time as the community uses it. Looking forward, we will move from obtaining attributes from a hand-held device to having this information on glasses that we can wear, and someday, perhaps as contact lenses or even corneal implants. And the students can look back at what they do today with Argis and say “I was on the ground floor of all of this!”
The third reason I love these tools is that they offer another opportunity to conduct field work. As I have written about here on the Esri Community, in dozens of my own videos, and in other articles, field work offers a myriad of advantages in education: It connects students to issues in their community, involves them as citizen scientists, uses their powers of observation and all five senses, combats “nature deficit disorder (per Richard Louv’s book Last Child in the Woods), and is essential for fostering sense of place. See the image below: You might find interesting things in the field; some may only be temporary!
The fourth reason I love these Argis tools and workflows is that they offer teachable moments (see below) including fostering discussions about spatial and attribute accuracy.
Teachable Moments
Teaching with GIS always involves higher goals. It is never just about learning about tools and data. Here are a few higher ‘teachable moments”; others exist as well.
1. Spatial accuracy. Notice above where I said you are “seeing exactly where that data or phenomenon occurred.” Well, most likely, not exactly. The spatial accuracy of the positions that I was examining, and that you will likely examine, depend on several factors. First, the GPS accuracy of a smartphone is nowhere near as accurate as those collected with a high end GPS receiver. I can sometimes get within 2 meters of what I consider to be my “true” latitude and longitude, as based on a satellite image (which themselves are only representations of reality and have their own tolerances), but with a Topcon, Trimble, Leica, or other survey-grade equipment, sub-centimeter accuracy is possible. Second, the features that I was examining, and that you will likely examine, such as the light poles, accidents, and storm drains, were collected by different crews, in different conditions, and with different equipment. The accident positions, for example, might be collected with an ordinary smartphone in the field by the police officers or sheriffs. Some storm drains might have been collected by a field worker marking a paper map with a pen 25 years ago and then digitized, with a consumer-grade GPS 20 years ago, and with a survey-grade GPS in more recent years.
Even so, you may be surprised by the spatial accuracy of some features; see below. The point feature representing the “Bump – 25 mph” sign is actually sitting right on the sign post!
2. Attribute completeness and characteristics. Another discussion should be about attributes: How descriptive are they? What units are the measurements in? Being aware of the strengths—and limitations—of data, is a key part of building data literacy and fluency.
3. Public information. What information is public, and what is not? In most communities, land ownership is public information. I loaded my county’s parcel layer from the assessor’s office into an Argis scene, and lo and behold, as I walked the landscape, could view all sorts of information about who owned each parcel, when it was purchased, and other information about it. I tested it with my very own residence (which is not shown below, but others are shown). This is already available by visiting the GIS layers on city and county data servers, but seeing it in the field as you are walking by vacant lots, schools, businesses, and houses somehow makes these discussions all the more relevant and timely. Who decides what information should be public? How does this information improve decision making? How might some object to certain information being public? How does information access vary among countries of the world, and why? How does changing technology and societal needs influence information policies?
4. Connection to existing programs. As I touched upon above, certainly a higher goal is to raise awareness of driver safety and drug and alcohol awareness and prevention, and examining the accident data in web maps and in the field would truly help drive these points home. In addition, it could save precious student lives. I can't think of a more noble goal than that.
5. Augmented reality and technology in society. How do technologies such as augmented reality and GIS affect human behavior today (such as encouraging exercise via fitness apps, finding your way through a campus or through a city, and much more)? How will they affect human behavior and society in the future?
I highly recommend that you use these tools and through their use and ensuing discussions, foster spatial thinking and critical thinking.
●
You must be a registered user to add a comment. If you've already registered, sign in. Otherwise, register and sign in.
-
Administration
38 -
Announcements
45 -
Career & Tech Ed
1 -
Curriculum-Learning Resources
179 -
Education Facilities
24 -
Events
47 -
GeoInquiries
1 -
Higher Education
519 -
Informal Education
266 -
Licensing Best Practices
46 -
National Geographic MapMaker
11 -
Pedagogy and Education Theory
187 -
Schools (K - 12)
282 -
Schools (K-12)
185 -
Spatial data
24 -
STEM
3 -
Students - Higher Education
231 -
Students - K-12 Schools
86 -
Success Stories
22 -
TeacherDesk
1 -
Tech Tips
83
- « Previous
- Next »
