Turn on suggestions
Auto-suggest helps you quickly narrow down your search results by suggesting possible matches as you type.
Cancel
- Home
- :
- All Communities
- :
- Industries
- :
- Education
- :
- Education Blog
- :
- Ten Ways to Teach and Learn About Water Using ArcG...
Ten Ways to Teach and Learn About Water Using ArcGIS Online
Subscribe
425
0
04-13-2012 02:11 AM
- Subscribe to RSS Feed
- Mark as New
- Mark as Read
- Bookmark
- Subscribe
- Printer Friendly Page
- Report Inappropriate Content
04-13-2012
02:11 AM
Just in time for Earth Day, but suitable for use throughout the year in geography, earth science, environmental science, chemistry, social studies, and in other disciplines is a new lesson that invites students to learn about water using ArcGIS Online.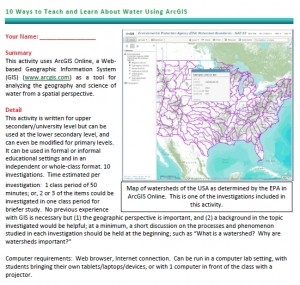
Water is a spatial subject: It easily moves among its solid, liquid, or gas phases on our planet. It flows through oceans, rivers, wetlands, glaciers, and through the hydrologic cycle at different rates. It is affected by long-term climate, everyday weather, hurricanes, landforms, and air pressure. It has been channeled into settling ponds, water treatment plants, fields, irrigation ditches, drainage ditches, canals, reservoirs, and many other means by humans. It acts as a change agent above, on, and below the surface of the Earth, affecting crop yields, aquifers, erosion, floods, stream sediment, soil chemistry, weathering, and much more. Thus, the geographic perspective and GIS are useful to understanding water from local to global scales.
These activity use ArcGIS Online, a Web-based Geographic Information System (GIS). Students at the upper secondary/university level can use the lesson, but so can those at the lower secondary level, and the lesson can be modified for primary level. It can be used in formal or informal educational settings and in a whole-class format or in a lab. No previous experience with GIS is necessary but (1) the geographic perspective is important, and (2) a background discussion in the topic investigated will be helpful. For example: “What are watersheds and why are they important?”
Through the activities, students investigate major dams and reservoirs, cities along rivers, flood zones, food production, wetlands, and water quality. These include the following questions and assignments: What is the relationship between wind speed and direction to precipitation, current air pressure, temperature, and topography? Using USGS stream gages and weather stations, predict the height of the water in streams where significant precipitation has been occurring. What is the relationship between the location of the gaging station within the watershed and the height of the river? Go outside! Do current weather local conditions match the map you have been examining? Predict tomorrow’s conditions based on the maps you are examining.
How could you use ArcGIS Online to teach about water in your instruction?
- Joseph Kerski, Esri Education Manager
You must be a registered user to add a comment. If you've already registered, sign in. Otherwise, register and sign in.
About the Author
I believe that spatial thinking can transform education and society through the application of Geographic Information Systems for instruction, research, administration, and policy.
I hold 3 degrees in Geography, have served at NOAA, the US Census Bureau, and USGS as a cartographer and geographer, and teach a variety of F2F (Face to Face) (including T3G) and online courses. I have authored a variety of books and textbooks about the environment, STEM, GIS, and education. These include "Interpreting Our World", "Essentials of the Environment", "Tribal GIS", "The GIS Guide to Public Domain Data", "International Perspectives on Teaching and Learning with GIS In Secondary Education", "Spatial Mathematics" and others. I write for 2 blogs, 2 monthly podcasts, and a variety of journals, and have created over 5,000 videos on the Our Earth YouTube channel.
Yet, as time passes, the more I realize my own limitations and that this is a lifelong learning endeavor and thus I actively seek mentors and collaborators.
Labels
-
Administration
38 -
Announcements
44 -
Career & Tech Ed
1 -
Curriculum-Learning Resources
178 -
Education Facilities
24 -
Events
47 -
GeoInquiries
1 -
Higher Education
518 -
Informal Education
265 -
Licensing Best Practices
46 -
National Geographic MapMaker
10 -
Pedagogy and Education Theory
187 -
Schools (K - 12)
282 -
Schools (K-12)
184 -
Spatial data
24 -
STEM
3 -
Students - Higher Education
231 -
Students - K-12 Schools
85 -
Success Stories
22 -
TeacherDesk
1 -
Tech Tips
83
- « Previous
- Next »