Turn on suggestions
Auto-suggest helps you quickly narrow down your search results by suggesting possible matches as you type.
Cancel
- Home
- :
- All Communities
- :
- Industries
- :
- Education
- :
- Education Blog
- :
- Teaching about Watersheds and River Systems with A...
Teaching about Watersheds and River Systems with ArcGIS Online
Subscribe
1835
0
12-18-2014 10:17 PM
- Subscribe to RSS Feed
- Mark as New
- Mark as Read
- Bookmark
- Subscribe
- Printer Friendly Page
12-18-2014
10:17 PM
Teaching about watersheds and river systems has long been a major theme of physical geography, earth science, and environmental science instruction. ArcGIS Online now provides capabilities for educators and students to create watersheds, trace downstream, and create viewsheds, all of which can serve as an effective means to foster understanding of watersheds and river systems, how they are connected geographically and temporally, and why they are important.
Boulder, Colorado, like many mountain-front communities, is prone to periodic devastating floods. To supplement a lesson that I wrote about floods in Boulder, I used the watershed tool in ArcGIS Online to create the watershed that is drained in Boulder Creek through the mouth of Boulder Canyon. The area is 130.12 square miles, giving a clear reason why any major rapid snowmelt or any major rain event anywhere in that large area creates flood hazards for the city of Boulder.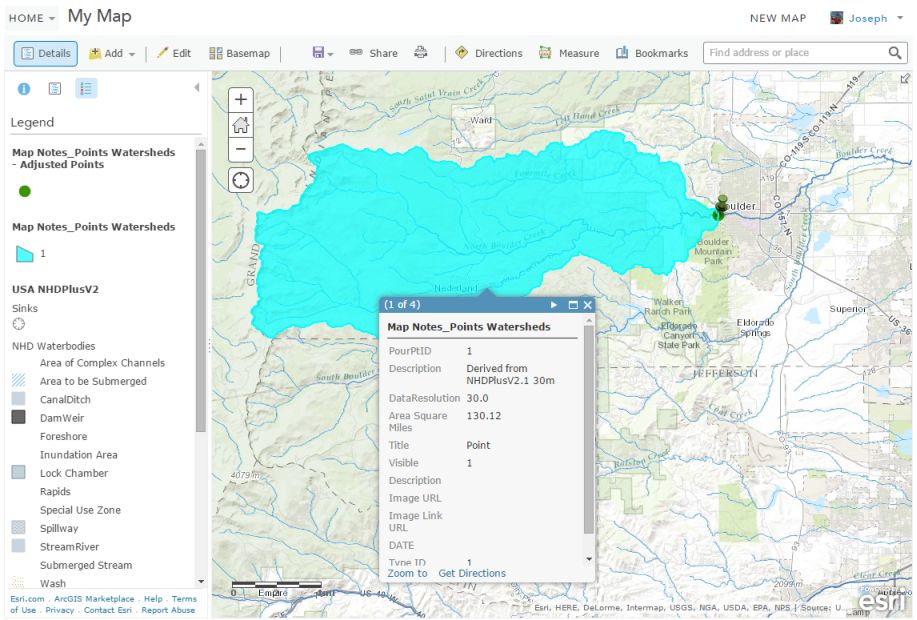
Where does that water flow once it reaches Boulder? To find out, I used the new Trace Downstream tool with a 15 mile limit. The result makes it clear that the areas east and northeast of the city also bear the effects of potential floodwaters.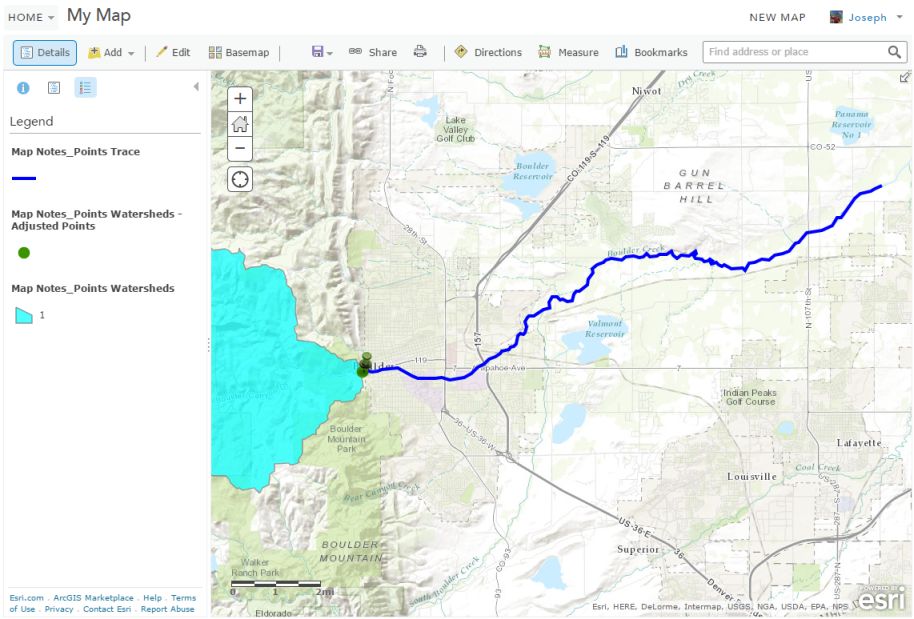
Using the same tool, I ran another Trace Downstream analysis and extended the distance to 3,000 miles. The result, shown below, fits in well with the lesson but also in any lesson that asks students, "where does a cup of water flowing from my location flow through before it reaches the ocean?"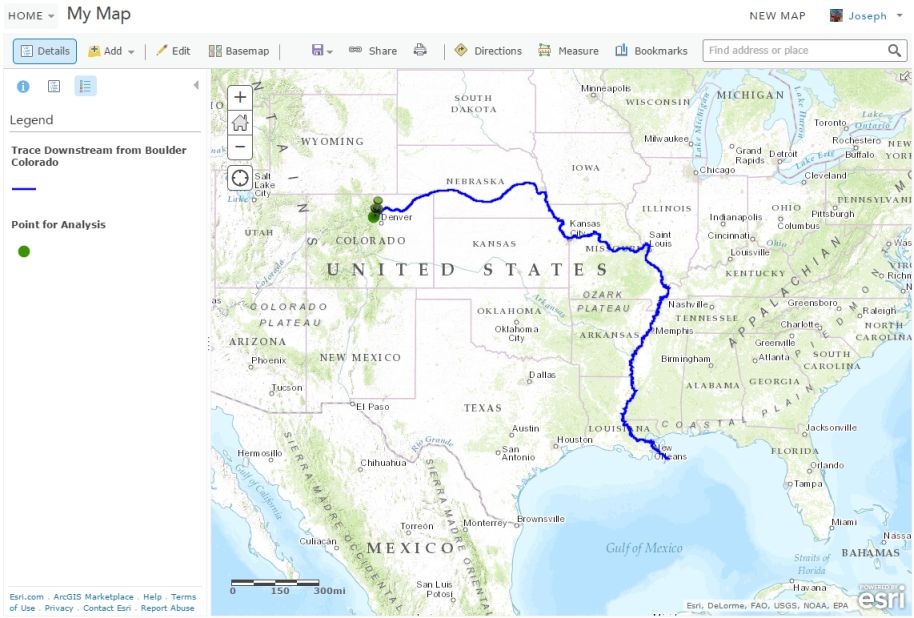
Finally, to get a sense for how the terrain in Boulder is mountainous to the west of the mouth of the canyon but flattens to the Great Plains to the east, I used the new Create Viewsheds tool from a point on top of Green Mountain, above the famous Boulder Flatiron rock formations. The viewshed, as the name implies, indicates the land viewable from a specific point, and in my case, I specified nine miles for the extent. The result of viewshed analysis can foster understanding of the terrain and how the terrain impacts streamflow and flooding.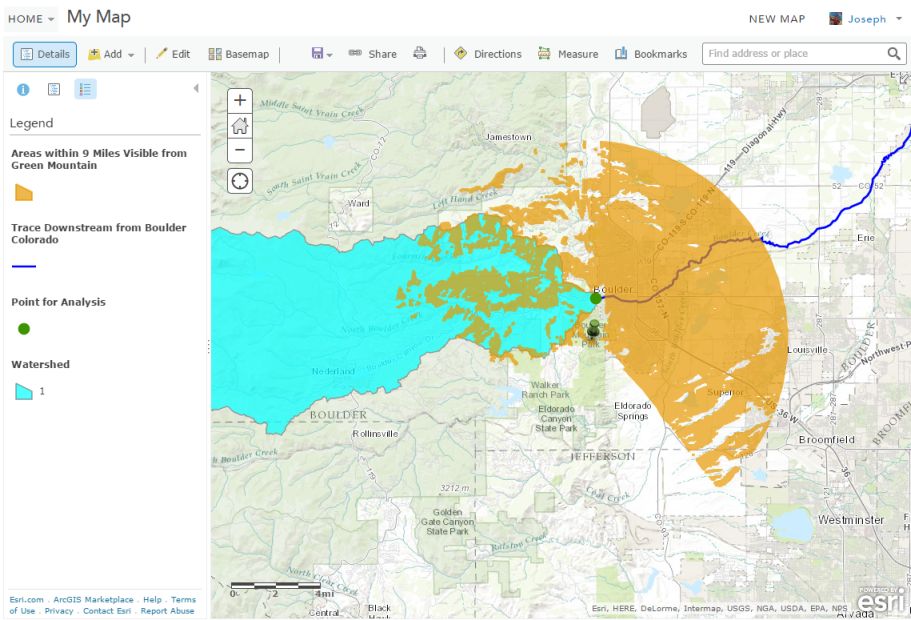
These activities require an ArcGIS Online organizational subscription and to generate the analysis layers such as the ones I did above, you need to have publishing rights in that organization. With your organizational subscription, examine the map I created above, and try these tools yourself for your own area!
You'll be amazed at how easy it is, and yet how powerful, because these tools can foster understanding of how streams, watersheds, and terrain are connected spatially and temporally.
Boulder, Colorado, like many mountain-front communities, is prone to periodic devastating floods. To supplement a lesson that I wrote about floods in Boulder, I used the watershed tool in ArcGIS Online to create the watershed that is drained in Boulder Creek through the mouth of Boulder Canyon. The area is 130.12 square miles, giving a clear reason why any major rapid snowmelt or any major rain event anywhere in that large area creates flood hazards for the city of Boulder.
Watershed upstream from Boulder Colorado.
Where does that water flow once it reaches Boulder? To find out, I used the new Trace Downstream tool with a 15 mile limit. The result makes it clear that the areas east and northeast of the city also bear the effects of potential floodwaters.
Trace 15 miles downstream from the mouth of Boulder Canyon, Colorado.
Using the same tool, I ran another Trace Downstream analysis and extended the distance to 3,000 miles. The result, shown below, fits in well with the lesson but also in any lesson that asks students, "where does a cup of water flowing from my location flow through before it reaches the ocean?"
Trace from Boulder Colorado to the Gulf of Mexico.
Finally, to get a sense for how the terrain in Boulder is mountainous to the west of the mouth of the canyon but flattens to the Great Plains to the east, I used the new Create Viewsheds tool from a point on top of Green Mountain, above the famous Boulder Flatiron rock formations. The viewshed, as the name implies, indicates the land viewable from a specific point, and in my case, I specified nine miles for the extent. The result of viewshed analysis can foster understanding of the terrain and how the terrain impacts streamflow and flooding.
Nine-mile Viewshed from Green Mountain.
These activities require an ArcGIS Online organizational subscription and to generate the analysis layers such as the ones I did above, you need to have publishing rights in that organization. With your organizational subscription, examine the map I created above, and try these tools yourself for your own area!
You'll be amazed at how easy it is, and yet how powerful, because these tools can foster understanding of how streams, watersheds, and terrain are connected spatially and temporally.
You must be a registered user to add a comment. If you've already registered, sign in. Otherwise, register and sign in.
About the Author
I believe that spatial thinking can transform education and society through the application of Geographic Information Systems for instruction, research, administration, and policy.
I hold 3 degrees in Geography, have served at NOAA, the US Census Bureau, and USGS as a cartographer and geographer, and teach a variety of F2F (Face to Face) (including T3G) and online courses. I have authored a variety of books and textbooks about the environment, STEM, GIS, and education. These include "Interpreting Our World", "Essentials of the Environment", "Tribal GIS", "The GIS Guide to Public Domain Data", "International Perspectives on Teaching and Learning with GIS In Secondary Education", "Spatial Mathematics" and others. I write for 2 blogs, 2 monthly podcasts, and a variety of journals, and have created over 6,500 videos on my Our Earth YouTube channel.
Yet, as time passes, the more I realize my own limitations and that this is a lifelong learning endeavor: Thus I actively seek mentors and collaborators.
Labels
-
Administration
89 -
Announcements
85 -
Career & Tech Ed
1 -
Curriculum-Learning Resources
280 -
Education Facilities
24 -
Events
77 -
GeoInquiries
1 -
Higher Education
616 -
Informal Education
284 -
Licensing Best Practices
102 -
National Geographic MapMaker
39 -
Pedagogy and Education Theory
239 -
Schools (K - 12)
282 -
Schools (K-12)
302 -
Spatial data
39 -
STEM
3 -
Students - Higher Education
257 -
Students - K-12 Schools
142 -
Success Stories
44 -
TeacherDesk
1 -
Tech Tips
125
- « Previous
- Next »