- Home
- :
- All Communities
- :
- Industries
- :
- Education
- :
- Education Blog
- :
- Teaching about Racial Equity and Social Justice Us...
Teaching about Racial Equity and Social Justice Using GIS and Spatial Data, Part 2
- Subscribe to RSS Feed
- Mark as New
- Mark as Read
- Bookmark
- Subscribe
- Printer Friendly Page
- Report Inappropriate Content
In Part 1 of this series, I described how racial equity and social justice can be understood and engaged with using Geographic Information Systems (GIS). In this “Part 2” essay, let’s dig deeper into practical ways of doing so and also discuss relevant issues that are inherent to using digital maps and data within a GIS environment.
One powerful capability within the modern ArcGIS platform is that you can map your own data. You can do this in a wide variety of means: You can scan and georeference historical maps or sketches of a community. You can geocode spreadsheets of location-based data. You can add mapped features while examining aerial, UAV, or satellite imagery. One of the easiest and most popular ways to gather and map your own data is with field surveys such as QuickCapture or Survey123. You can also crowdsource your field surveys to get community input on an issue. You can use the field surveys to empower the community to participate in mapping and understanding issues such as areas that are not walkable or not walkable, the presence of litter, green spaces (or lack thereof), benches, bus stops, recycling centers, community gardens, gathering places, or other information.
These maps are not just pretty graphics floating around in cyberspace. Each piece of data has topology; it “knows” where it is related to everything else around it. ArcGIS Online, ArcGIS Insights, and ArcGIS Pro offer the power of spatial analysis. Analysis tools work with the topology of the data and enable you to determine where variations and patterns in variables exist, where they change, determining size, shape, and distribution, how places are related, finding optimal locations and paths, detecting patterns, and making predictions. You run these spatial analysis tools in an intuitive step-by-step manner, adjusting the inputs and outputs as you see fit, whether it is map overlay, proximity, creating the weighted mean center of data, determining statistical significance, or other analytical tools. These tools are used in equity-driven research study in a wide variety of disciplines, though perhaps geographers have studied their spatial aspects the most. Searching on “equity” for example, in a recent conference of the American Association of Geographers, nets many studies in a wide variety of places at many scales.
Maps have always been used to tell stories. People can teach with maps and learn from maps. Beyond fostering skills in spatial thinking and geotechnologies, engaging with these digital maps encourages community members to think spatially and holistically about the interaction of people with the built environment and the natural world. The compelling multimedia maps that the ArcGIS platform enables you to create, such as story maps, 3D scenes, other web mapping applications, photos, sound clips, and videos, can be a powerful motivator people to take action. Over one million story maps exist, created by people from all over the world about a diversity of issues. These maps are a testimony to the attraction and utility of these maps. In one powerful example, the city of Asheville North Carolina created this story map to show historical roots and current issues around racial equity. In another example, GIS was used in the fight for fairer redistricting and voting right in California.
Inherent in working with data of any kind are ethical issues. Ethics are especially important in maps, which have for thousands of years been a visually powerful medium. When creating and sharing maps, it is important that you understand your data sources so that you can decide whether each source is suitable for your analysis. You also will need to make choices about the map projection, data model, classification method, number of classes, symbology (colors, shading, and types of symbols), and other aspects of your maps. Communicating through maps gives you much power, and that power must be used thoughtfully and ethically. This essay offers ways of teaching and learning about ethics through maps, through real life experiences, through good maps, and yes, even through “bad” or “misleading” maps!
Using these maps also fosters engagement with the geographic inquiry process, where people ask a geographic question, acquire data, analyze that data, communicate the results of the analysis, and act on what is learned.
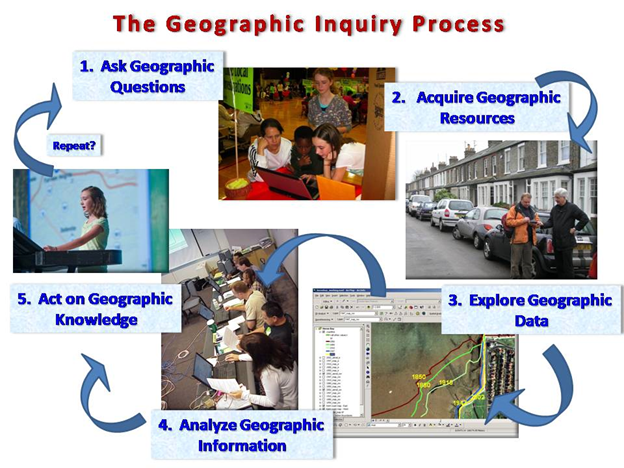
The geographic inquiry process.
For example, student-led mapping in Los Angeles focused on something that is often not thought about: shade, and the equitable planting of new trees. In another example, GIS was used in the fight for fairer redistricting and voting rights in California. To dig deeper, see the racial equity resources and this hub from Esri.
Many of these digital maps illustrate, in my view, where an opportunity exists to do something about an issue. Using these maps empowers people to tackle things they care deeply about. A few ways that organizations use GIS to help with social justice efforts include: Mapping and analyzing inequity, spatially enhancing community engagement, allocating resources equitably, and managing performance of racial justice initiatives. What issues could your students investigate through the geographic inquiry process and the data available on this site? Could projects showcased here could be replicated in your own community?
I began the first essay in this series with a statement about how maps have inspired people over the centuries. Maps have also served as a universal and common language that helps people visualize a large amount of data in a small amount of space. For many years I showed a video to my students about how maps produced from GIS helped bring two disparate groups in the Pacific Northwest (the environmental and the logging communities) together around a common goal—a healthy forest. It is my hope and belief that GIS can accomplish the same type of community building around racial equity and social justice. Through understanding the situation through maps, we can bring people together to build communities and a world in which we would all like to live.
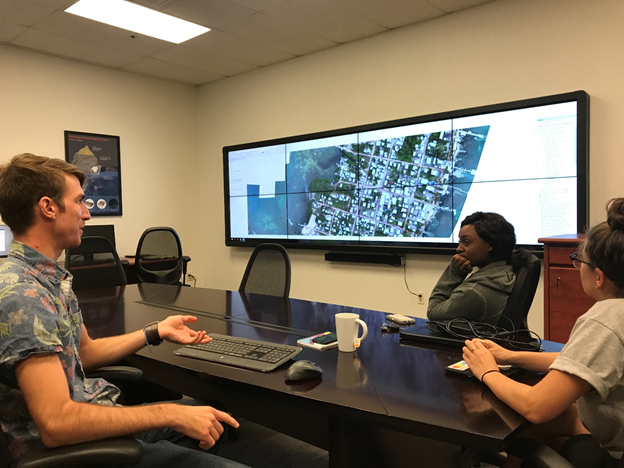
Discussing community issues around maps and imagery.
You must be a registered user to add a comment. If you've already registered, sign in. Otherwise, register and sign in.
-
Administration
38 -
Announcements
44 -
Career & Tech Ed
1 -
Curriculum-Learning Resources
178 -
Education Facilities
24 -
Events
47 -
GeoInquiries
1 -
Higher Education
518 -
Informal Education
265 -
Licensing Best Practices
46 -
National Geographic MapMaker
10 -
Pedagogy and Education Theory
187 -
Schools (K - 12)
282 -
Schools (K-12)
184 -
Spatial data
24 -
STEM
3 -
Students - Higher Education
231 -
Students - K-12 Schools
85 -
Success Stories
22 -
TeacherDesk
1 -
Tech Tips
83
- « Previous
- Next »