- Home
- :
- All Communities
- :
- Industries
- :
- Education
- :
- Education Blog
- :
- Studying regions and cities with the Urban Observa...
Studying regions and cities with the Urban Observatory
- Subscribe to RSS Feed
- Mark as New
- Mark as Read
- Bookmark
- Subscribe
- Printer Friendly Page
Comparing regions and cities with the Urban Observatory. A significant and growing part of virtually every region of the world is the presence of urban areas. In mid 2009, the number of people living in urban areas surpassed the number living in rural areas for the first time in history. In keeping with our Module theme of being critical of the data, what constitutes an “urban area”? This can be characterized by a certain population size, or a level of infrastructure, a lifestyle, or other means, and is difficult to define (https://unstats.un.org/UNSD/Demographic/sconcerns/densurb/densurbmethods.htm). However, most germane to our purposes in this activity is the fact that regions are influenced by and in turn influence their urban areas. Spatial Technology, through a web mapping application called the Urban Observatory, provides the means to compare urban areas via data and maps.
What is the Urban Observatory? The urban observatory was created by Richard Saul Wurman (the person who began the TED talks), Radical Media, and Esri, launching in 2013. This tool allows you access to datasets for cities around the world so you (and your students) can simultaneously examine data about the most important questions impacting today's global cities and the regions in which they exist. The urban observatory is curated by some of my favorite people here at Esri and they have created a wonderful teaching and research tool.
Compare and contrast cities using the Urban Observatory. Access the Urban Observatory here: http://www.urbanobservatory.org/. Select Start Comparing > and then, > Launch App. This is a web mapping application, similar to the Change Matters viewer you used earlier, but this application provides thematic maps and data side-by-side comparisons of urban areas. The application opens with population density in New York, London, and Tokyo, and you can interact with each by zooming and panning.
What would you like your students to observe about the population density patterns using this application? How does the physical geography impact each city’s traffic, land use, zoning, and density? Which of the classic geography urban models apply to each of the cities?
The application allows for the investigation of 100 cities, with more added yearly, and 50 themes. Select Cities, move to P in the alphabet, and change the city in Panel 3 to Perth. How does Perth’s density compare to New York and London? Why?
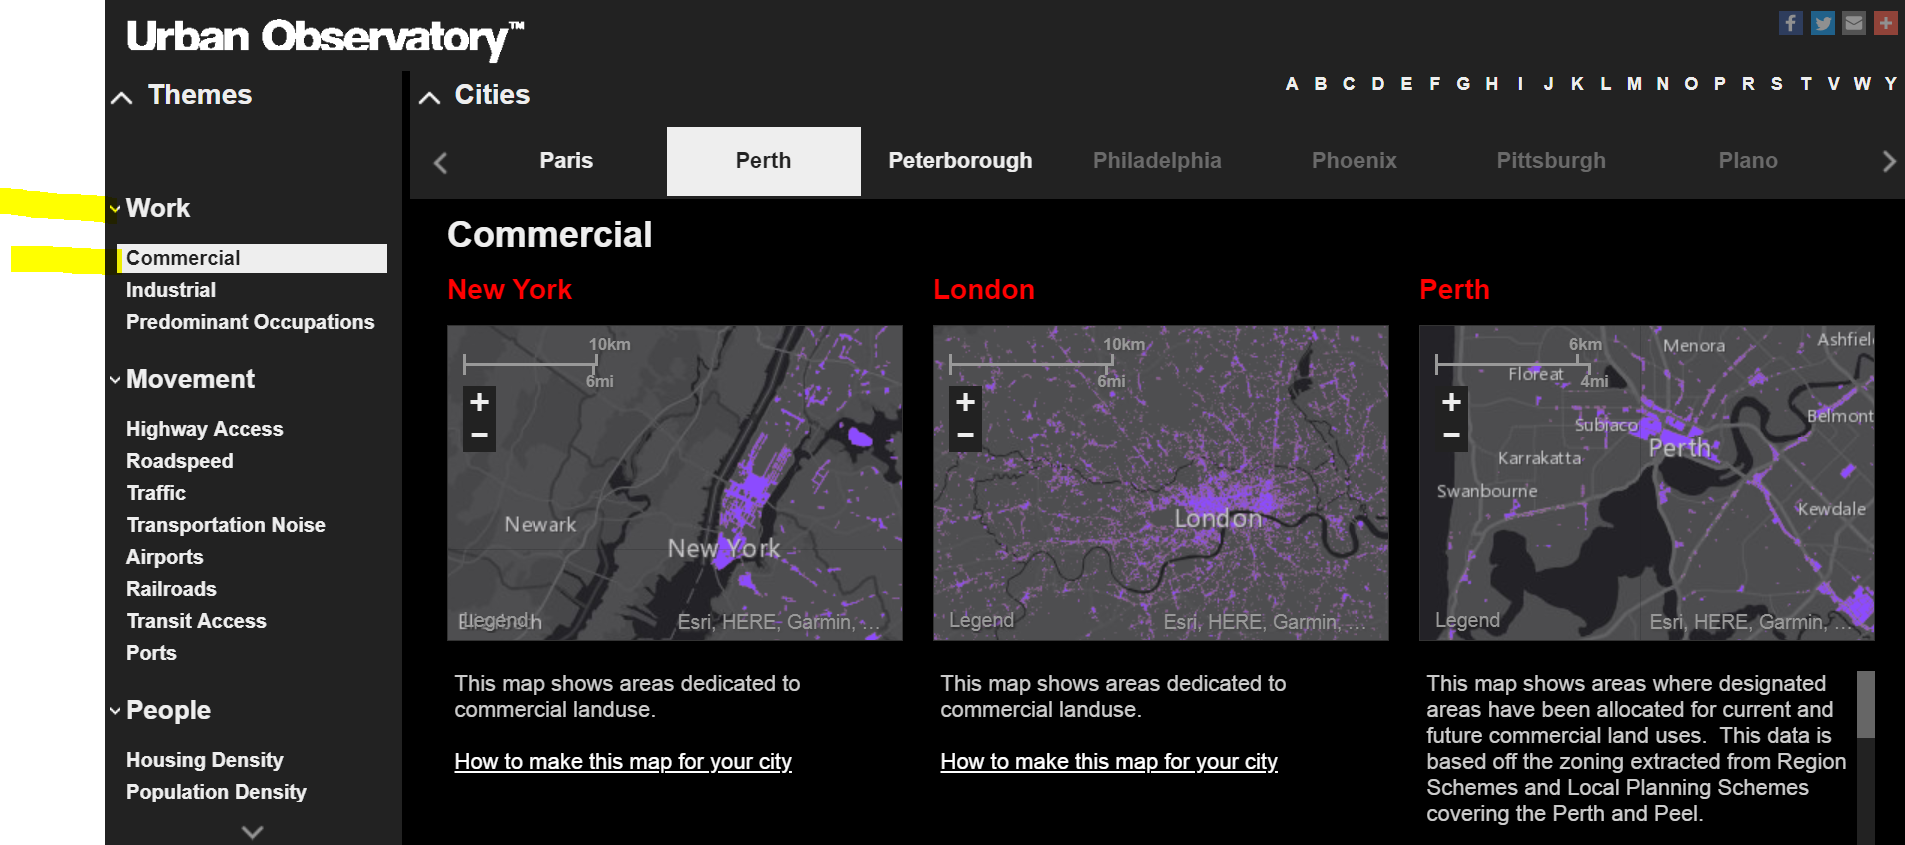
Now, instead of changing the city, change the theme. Change the theme to Work > Commercial, and compare New York, London, and Perth. Your map should look similar to that below.

- Contrast the spatial pattern of commercial land use in the three cities. What influence do the water bodies (harbours and rivers) have on the location of the commercial land use? Why?
- Are the 3 scales the same among all 3 maps? How might the scales influence the interpretation of the patterns?
- Change the theme to Work, Industrial. Contrast the spatial pattern of industrial land use in the three cities.
Teaching with the Urban Observatory. Another example of how you could use the Spatial Technology available to you in the Urban Observatory to support your instruction. Say you are teaching about world demographics and are showing population pyramids for countries. Ask students to use the Urban Observatory to compare senior population in New York, Accra, and Tokyo. Based on the content you have taught, ask them to state their hypothesis about the senior population in each city. (They might need to do some research to determine which countries each of these cities is located). Examine the resulting maps. The senior population for Accra should be much less than the senior population for Tokyo, with New York falling somewhere in the middle, and unlike the other two cities, being heavily influenced by immigration.
Examining real-time data with the Urban Observatory. Spatial Technologies are increasingly tied to real-time and near-real-time data, fed by citizen scientists and the sensor network, part of the Internet of Things (IoT). Examine the current temperatures for three cities in the Urban Observatory, making sure you select at least one in the Northern Hemisphere and one in the Southern Hemisphere. What is the effect of season on the temperatures right now? Compare cities near coasts with those far away, while asking: What is the effect of proximity to the ocean on temperature? Examine traffic, using a time zones map of the world as a supplementary resource. What effect does method of commute, time of day, day of the week, the road network, and physical geography have on current speeds along roadways?
Select different cities or different themes that you believe would be helpful to help students understand urban geography, and describe the themes and cities you chose, and the patterns that you observe. In each problem posed, tie the city to the region: Cities are part of regions—they do not exist on their own. They also are influenced by global networks of commerce (Singapore being an excellent case study).
You must be a registered user to add a comment. If you've already registered, sign in. Otherwise, register and sign in.
-
Administration
69 -
Announcements
73 -
Career & Tech Ed
1 -
Curriculum-Learning Resources
241 -
Education Facilities
24 -
Events
64 -
GeoInquiries
1 -
Higher Education
577 -
Informal Education
277 -
Licensing Best Practices
78 -
National Geographic MapMaker
29 -
Pedagogy and Education Theory
216 -
Schools (K - 12)
282 -
Schools (K-12)
247 -
Spatial data
34 -
STEM
3 -
Students - Higher Education
242 -
Students - K-12 Schools
119 -
Success Stories
34 -
TeacherDesk
1 -
Tech Tips
106
- « Previous
- Next »