- Home
- :
- All Communities
- :
- Industries
- :
- Education
- :
- Education Blog
- :
- Spatial Environmental Education: Exploring Content...
Spatial Environmental Education: Exploring Content and Relationships through Map-Based Analysis
- Subscribe to RSS Feed
- Mark as New
- Mark as Read
- Bookmark
- Subscribe
- Printer Friendly Page
- Report Inappropriate Content
In a recent post, I introduced the idea of spatial environmental education, using map-based analysis to teach and learn environmental studies. I hope to strengthen this idea in this column by showing how spatial analysis can foster learning about environmental content and relationships. One of the central themes of environmental studies is examining the interaction between humans and the environment. How does the environment affect people, through such characteristics as daily weather and long-term climate, native plants and animals, landforms, the availability of water, local and regional natural hazards, and predominant soil type? Conversely, how do humans affect their environment?
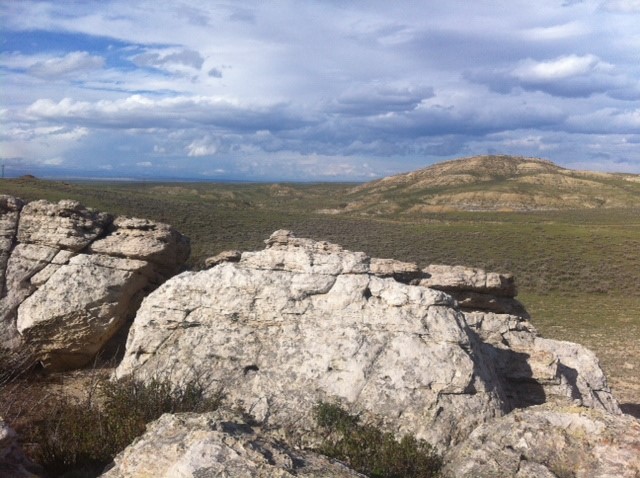
IS can be used to teach and learn about environmental content and relationships. Photograph by Joseph Kerski, out on the landscape in Wyoming.
Another central environmental theme is change. The Earth is a dynamic planet. Comparing land cover change based on examining Landsat satellite imagery, comparing the variation in the frequency and intensity of hurricanes by year, or investigating population change in an urban area are three of the many ways in which change can be examined using maps within a Geographic Information Systems (GIS), starting with ArcGIS Online.
Because environmental phenomena interact, move, and change, it is not enough to know content only: Relationships and processes are critical to understanding the environment. GIS can foster each of the Center for Ecoliteracy’s six core ecological concepts: networks, nested systems, cycles, flows, development, and dynamic balance. GIS allows variables to be input, modeled, and modified so that the dynamics of environmental processes can be studied. Hungerford and Volk (1991) defined nine key ecological concepts that they said were necessary for environmental education programs, including (1) individuals and populations, (2) interactions and interdependence, (3) environmental influences and limiting factors, (4) energy flow and nutrient cycling, (5) community and ecosystem concepts, (6) homeostasis, (7) succession, (8) humans as members of ecosystems, and (9) the ecological implications of human activities and communities. GIS can enhance the teaching of each of these concepts.
An NSF-funded project from the NAAEE resulted in a definition of environmental literacy that includes four interrelated components: (1) competencies, (2) knowledge, (3) dispositions, and (4) environmentally responsible behavior. By using the same tools used by scientists, GIS aids in the first two of these, and by investigating real issues in their communities and beyond, GIS aids in helping with the last two of these components.
Students who use GIS in tandem with environmental studies develop key critical thinking skills. These skills include understanding how to carefully evaluate and use data. This is especially critical in assessing environmental data, due to its increasing volume and diversity, and given its often sensitive and politically charged nature. Moreover, crowd-sourced data appears regularly from “citizen science” initiatives all over the world on pine beetle infestations, the appearance of monarch butterflies each spring, phenology, birds, and a host of other topics. These data are more frequently being tied to real-world coordinates that are mapped and analyzed. Students and graduates using GIS and who are grounded in environmental studies will be in demand to help make sense of this deluge of incoming data.
Students using these tools can map phenomena and features such as ocean currents, ecoregions, and the locations of usable geothermal energy. They can use the tools to answer various questions. How does pH vary along this stretch of river, and why? How do tree species and tree height change depending on the slope angle and slope direction of the mountain, and why? Why do wind speed and direction vary across North America the way they do?
Are you using GIS to teach or learn about environmental content and relationships? If so, how?
Reference
Hungerford, Harold R., and Trudi L. Volk. Curriculum Development in Environmental Education for the Primary School: Challenges and Responsibilities. Invited paper for The International Training Seminar on Curriculum Development in Environmental Education for the Primary School. May 1991.
- See more at: https://earthzine.org/spatial-environmental-education-teaching-and-learning-about-the-environment-wi...
You must be a registered user to add a comment. If you've already registered, sign in. Otherwise, register and sign in.
-
Administration
38 -
Announcements
44 -
Career & Tech Ed
1 -
Curriculum-Learning Resources
178 -
Education Facilities
24 -
Events
47 -
GeoInquiries
1 -
Higher Education
518 -
Informal Education
265 -
Licensing Best Practices
46 -
National Geographic MapMaker
10 -
Pedagogy and Education Theory
187 -
Schools (K - 12)
282 -
Schools (K-12)
184 -
Spatial data
24 -
STEM
3 -
Students - Higher Education
231 -
Students - K-12 Schools
85 -
Success Stories
22 -
TeacherDesk
1 -
Tech Tips
83
- « Previous
- Next »